Soil K rundown in the Western grains region – where, why and what does it mean for crop yields?
Author: R.W. Bell, Q. Ma, C.A. Scanlan, A. Neuhaus and James Easton | Date: 01 Mar 2022
Key messages
- Check soil test results for K including subsoils on loamy soils
- Use windrowing effects in crops to identify K responses (windrow effects may be obvious visually in 2022 after high biomass yields in 2021)
- Calculate K balances in cropping fields, especially where hay production occurs (input from K fertilizer minus K output in grain yield or hay)
Aims
We examine the evidence for soil K rundown, discuss its likely impacts on crop yields, implications for soil testing and K fertilisation and the types of soils which will be most at risk in the coming decade.
Introduction
Farming systems in the Western grains region, especially those that are crop dominant, have been running negative K balances (attributed mostly to greater K removal than application) for decades (Reuter et al. 1997). K deficiencies were identified for crop and pasture production on deep sands in the 1960s and on duplex soils in the 1990s. Evidence is also emerging that crops on loamy textured soils, which previously supplied sufficient K for crops despite K rundown, are now beginning to show K deficiency. In dryland agriculture, crop K nutrition plays a crucial role in promoting root growth, regulating plant water relations and alleviating biotic and abiotic stresses. Optimised use of soil and fertiliser K is increasingly necessary to sustain crop yields under stressed conditions in the context of K rundown in soils.
Method
Literature review
Journal articles and industry reports were reviewed regarding soil K rundown and negative K balances in the Northern, Central and Southern agricultural regions. Temporal soil K changes over the long term (1998 to 2021) and contemporary (2016 to 2021) samples in six Agzones were assessed using the database of soil test results from CSBP Plant and Soil Laboratories.
Field experiments
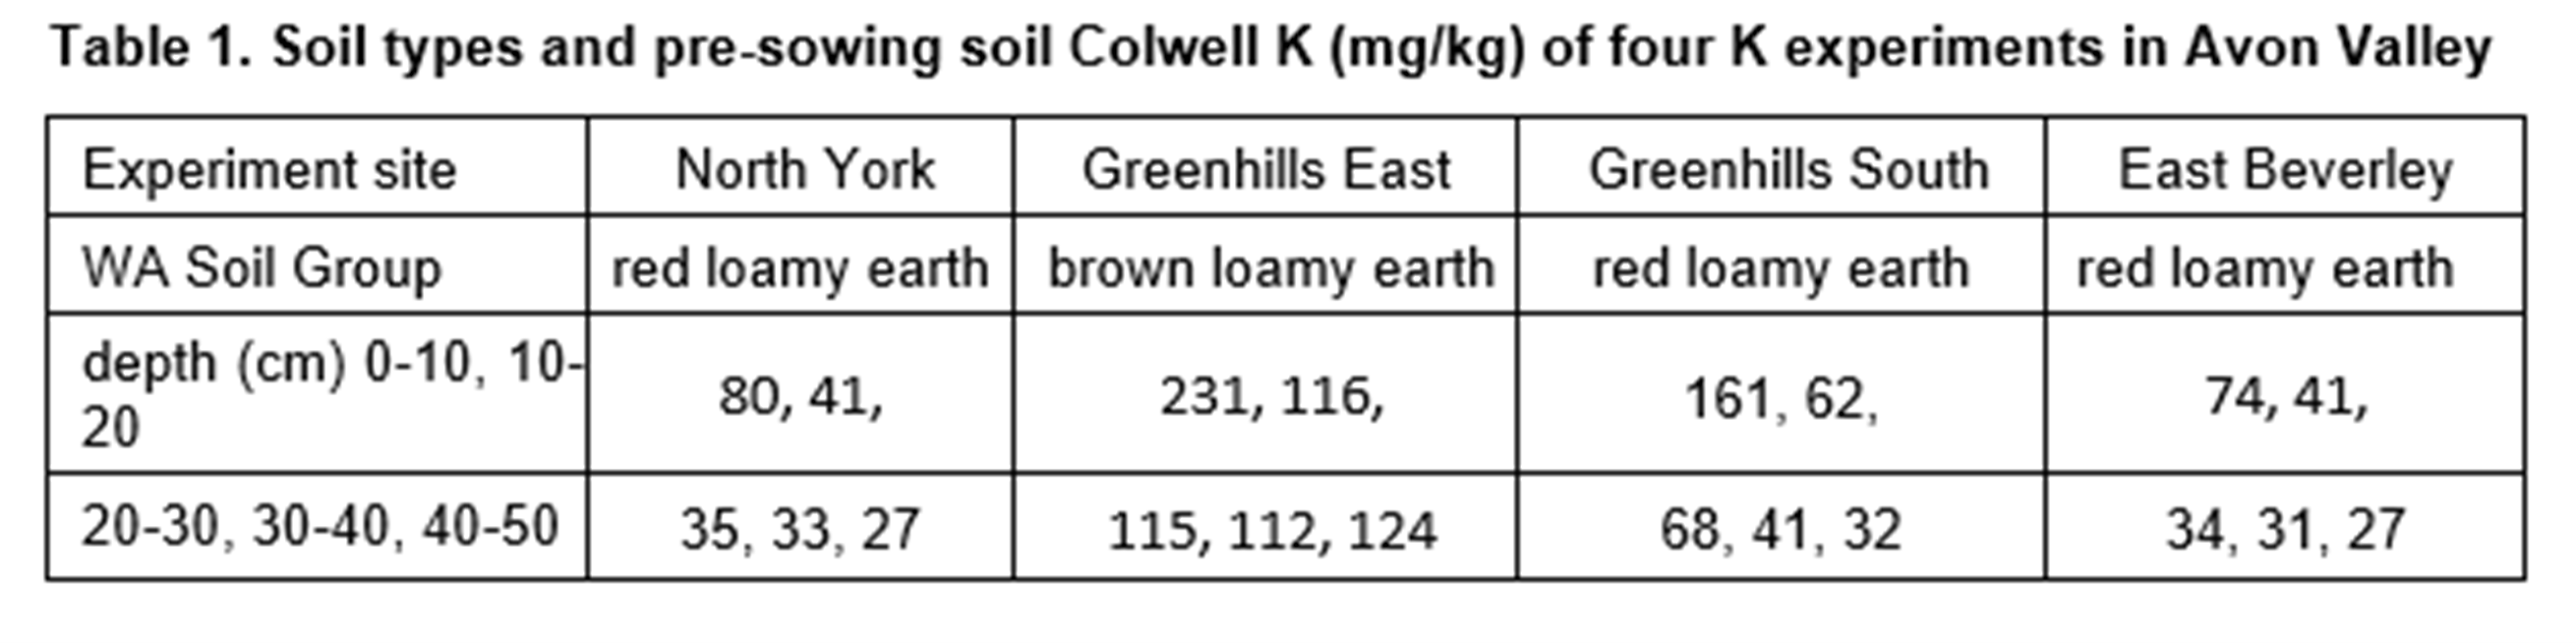
Four K experiments were conducted near York and Beverley in 2021. Soil types and pre-sowing soil K levels are shown in Table 1. Wheat cv. Scepter was sown in mid-May. Basal fertilisers included 68kg/ha monoammonium phosphate drilled, 40kg N/ha as urea topdressed at sowing, 20kg N/ha as UAN four weeks after sowing, 20kg N/ha as urea eight weeks after sowing and 40kg N/ha as urea at eight weeks after sowing.
All experiments were treated by topdressing muriate of potash at rates of 0, 25, 50, 25/25 split, 100 and 200kg K/ha in a randomised block design with six replications. For the 25/25 split-K treatment, 25kg K/ha was applied at sowing and 25kg K/ha at eight weeks after sowing, while all other K treatments were applied at sowing.
Crop K responses were assessed by measuring shoot K concentration at the start of stem elongation (Z30), shoot dry weight and K concentration at mid anthesis (Z65), and grain yield. All data of six K treatments were subjected to one-way analysis of variance. Treatment differences were separated by Fisher’s protected l.s.d. test and accepted at P = 0.05.
Results
Soil K rundown
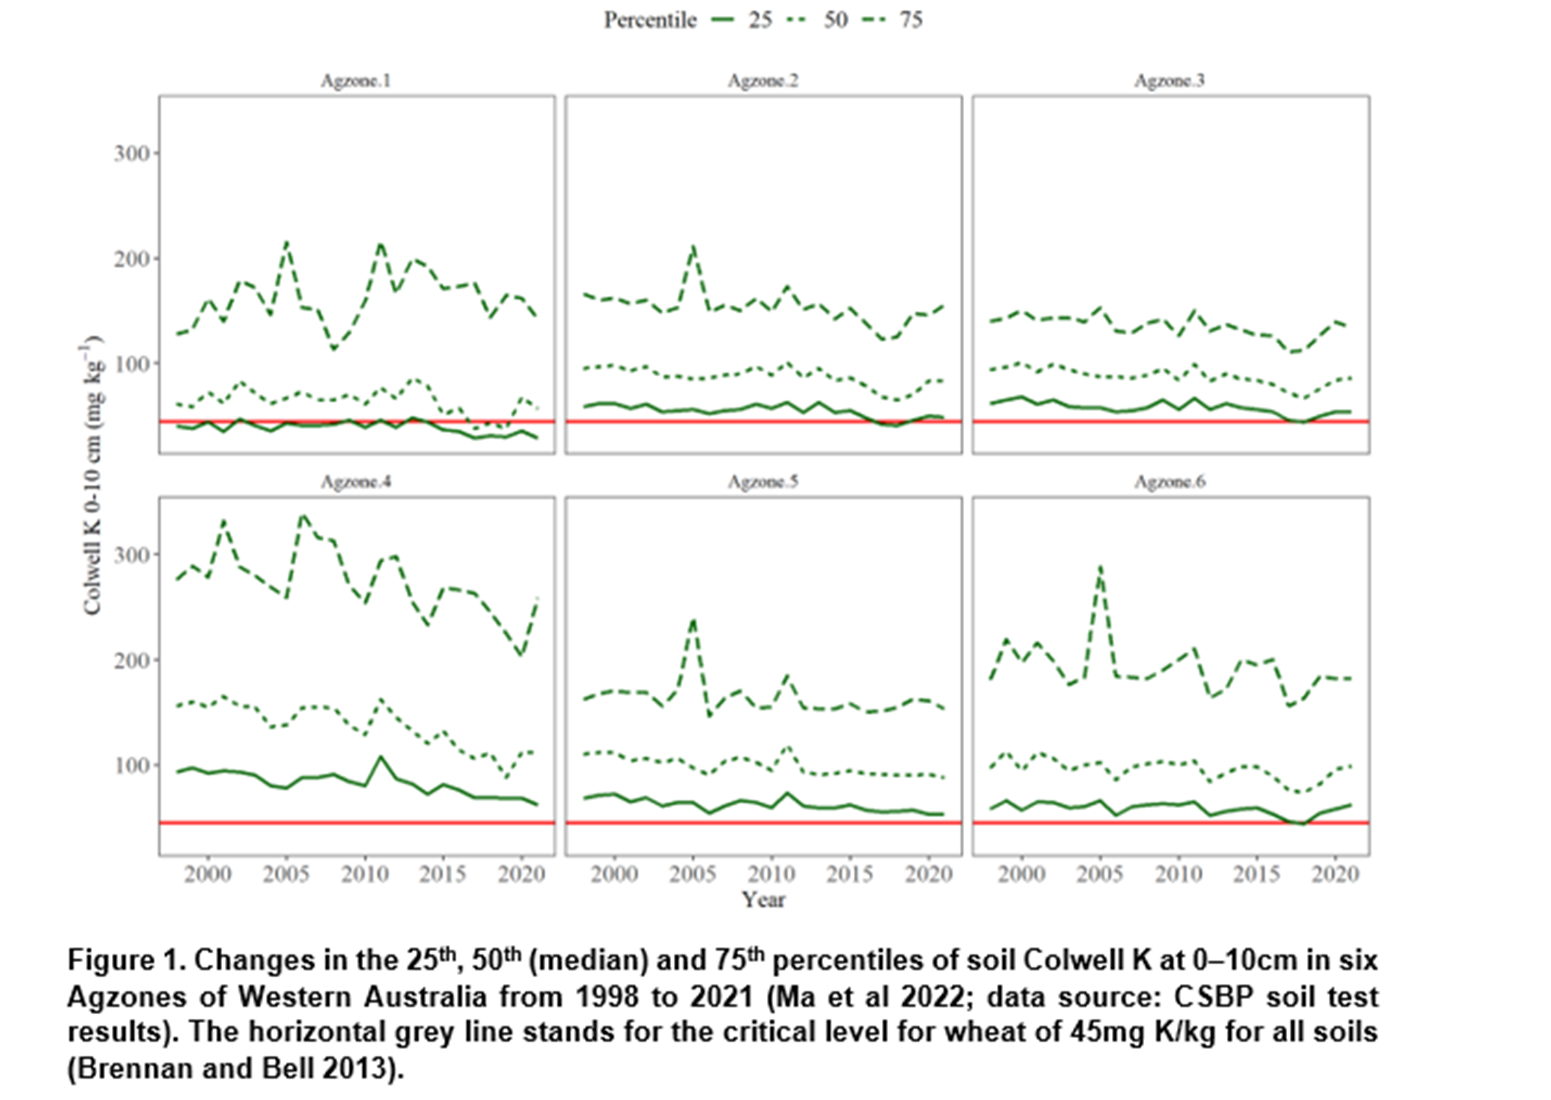
The trends in soil K at 0–10cm of six Agzones from 1998 to 2021 are shown in Figure 1, which summarises 690,000 soil samples. Time-series analysis of median soil K data (the 50th percentile) shows a temporal K decline existed in all Agzones, i.e., median soil K was significantly decreased by 2.6, 0.9, 0.9, 0.9, 0.8 and 0.7 mg/kg Colwell K per year from 1998 to 2021 in Agzones 4, 5, 2, 3, 6 and 1, respectively.
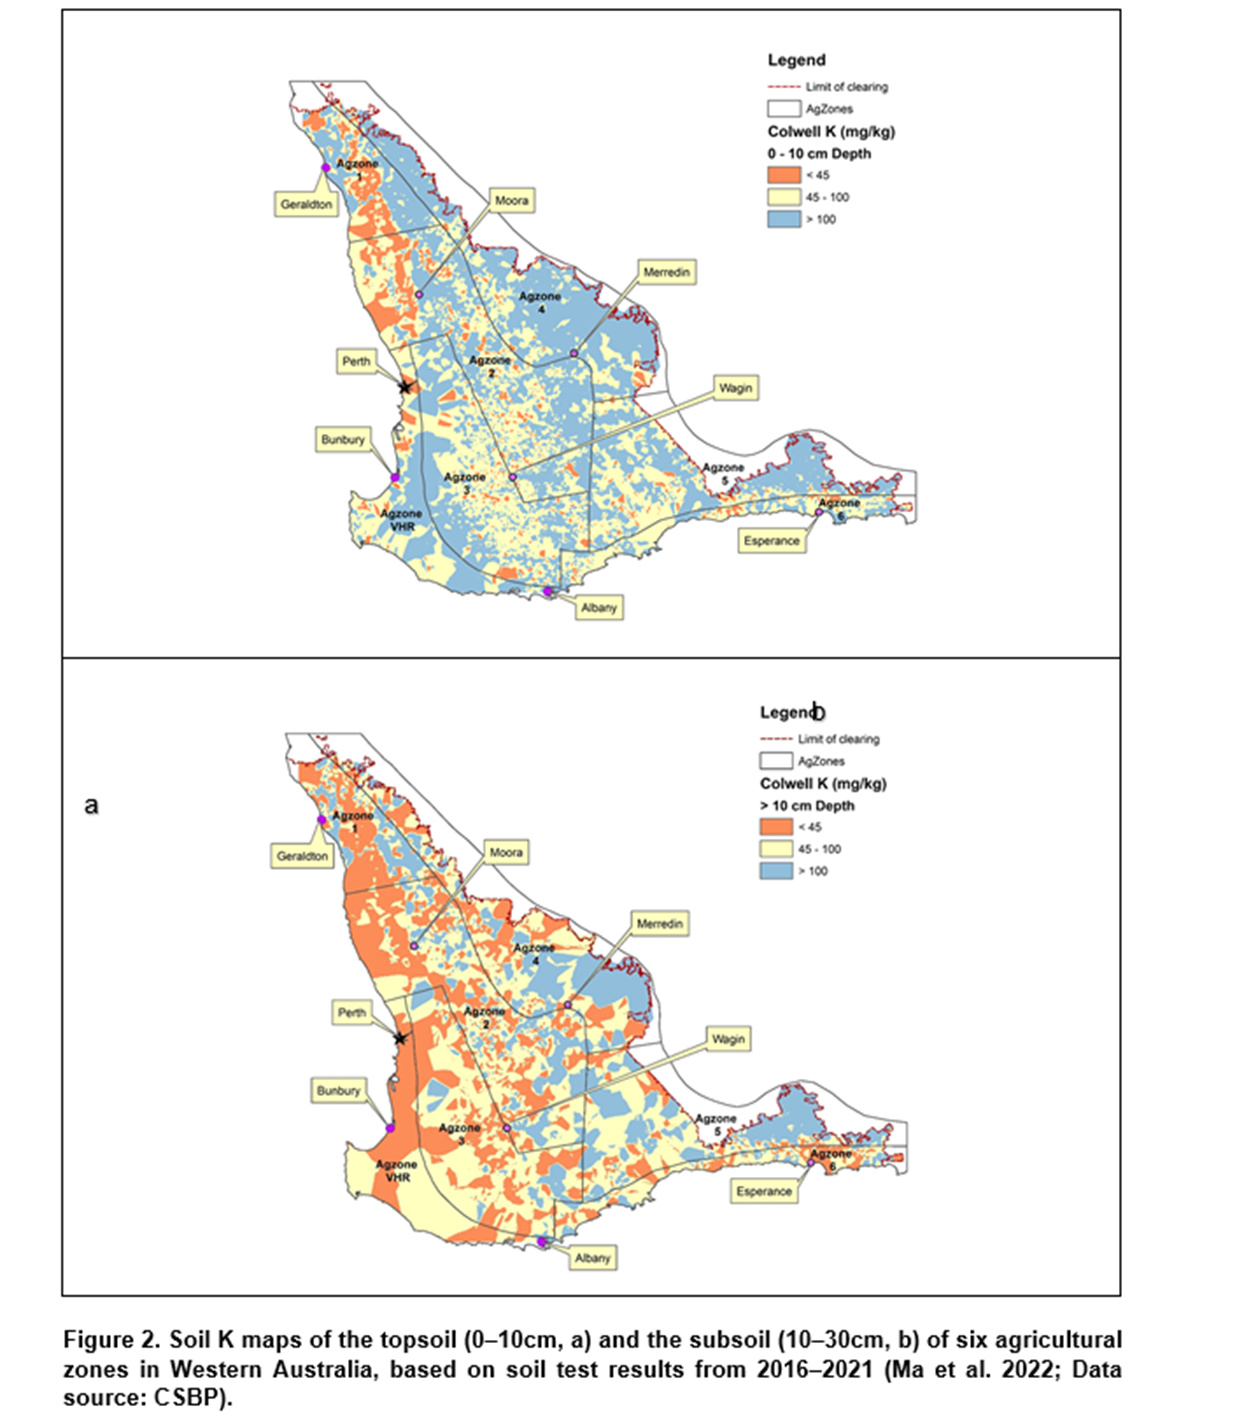
For the last five years, 15% of >195,000 topsoil samples (0–10cm) across the Agzones contained <35mg K/kg and 62% of had <100mg K/kg, with the areas of the lowest K status being in the coastal plain south of Geraldton and the highest K in the drier eastern margins of the cropping zone (Figure 2a) (Bryce and Neuhaus 2020). Of greater concern, 42% of 66,000 subsoil samples (10–30cm) contained <35mg K/kg and 79% of contained <100mg K/kg (Figure 2b) (Bryce and Neuhaus 2020), indicating that soil K deficiency is widespread below 10cm depth.
On-farm K balances
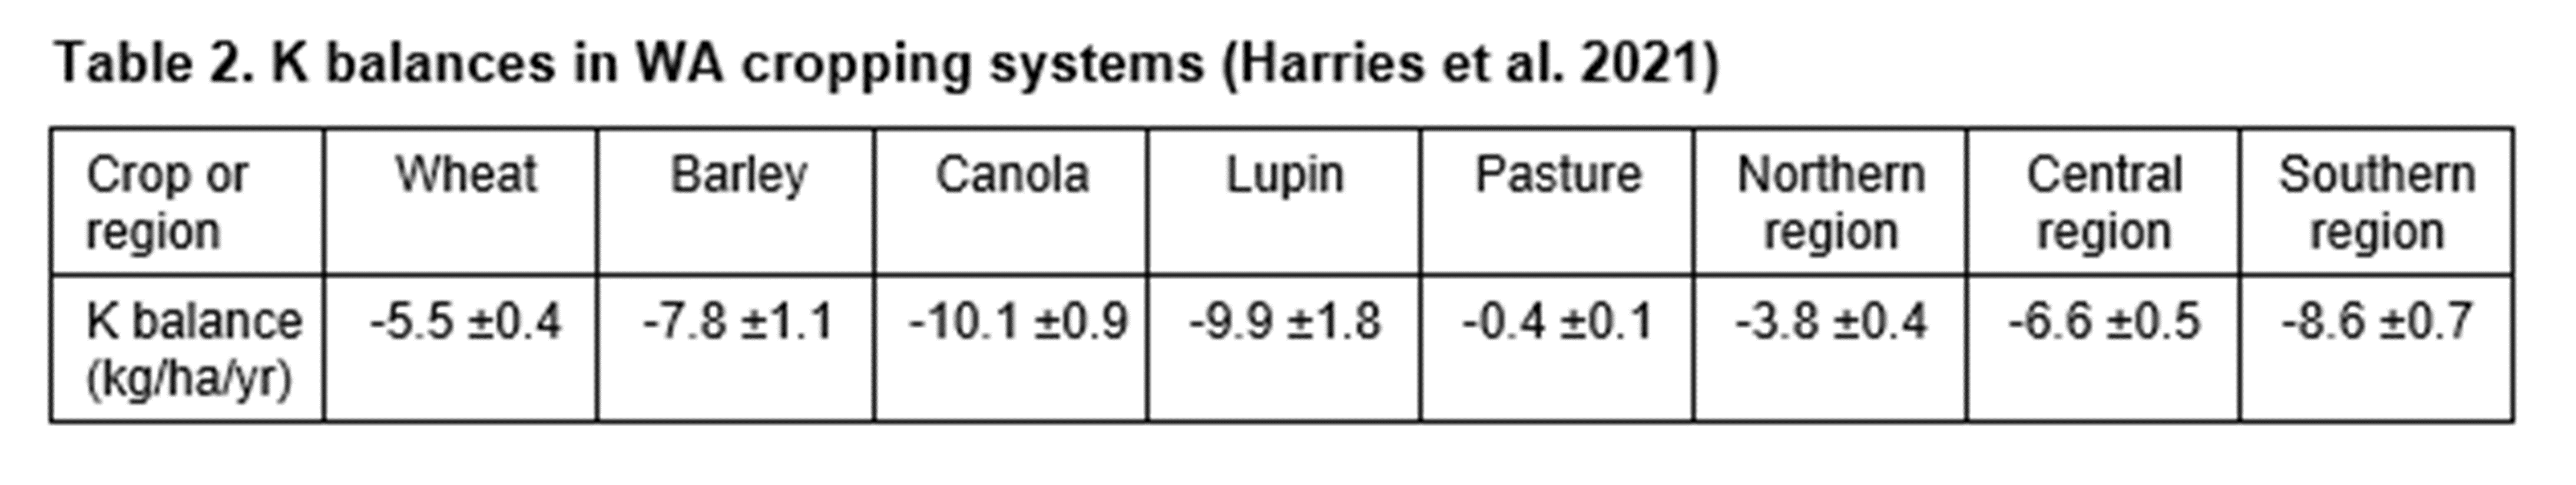
Soil K rundown on cropping farms is largely caused by continuously negative K balances, i.e., K inputs (inorganic, organic) are less than K outputs (crop removals, losses via runoff and leaching etc.). A survey of 184 fields from the WA grainbelt in 2010–2015 showed that average K inputs per paddock-year were 4.6, 4.1 and 4.3kg K/ha in the Northern, Central and Southern agricultural regions, respectively (Harries et al. 2021). By comparison, grain harvest removes 5–10kg K/ha, based on current yields and grain K contents of 4–5kg/t in wheat and barley, 8.8kg/t in lupins and 9.2kg/t in canola (Harries et al 2021). Consequently, K inputs to 90% of the fields were inadequate to balance grain K outputs (Table 2), despite increasing amounts of K fertiliser having been used in recent decades (Harries et al. 2021). Soil K rundown due to cropping can be even more significant under hay production, which removes large amounts of nutrients from the soil, especially K. For example, a hay crop of oat removes up to 150kg K in a yield of 10t/ha in WA (James Easton, personal communication).
K-related windrowing effects
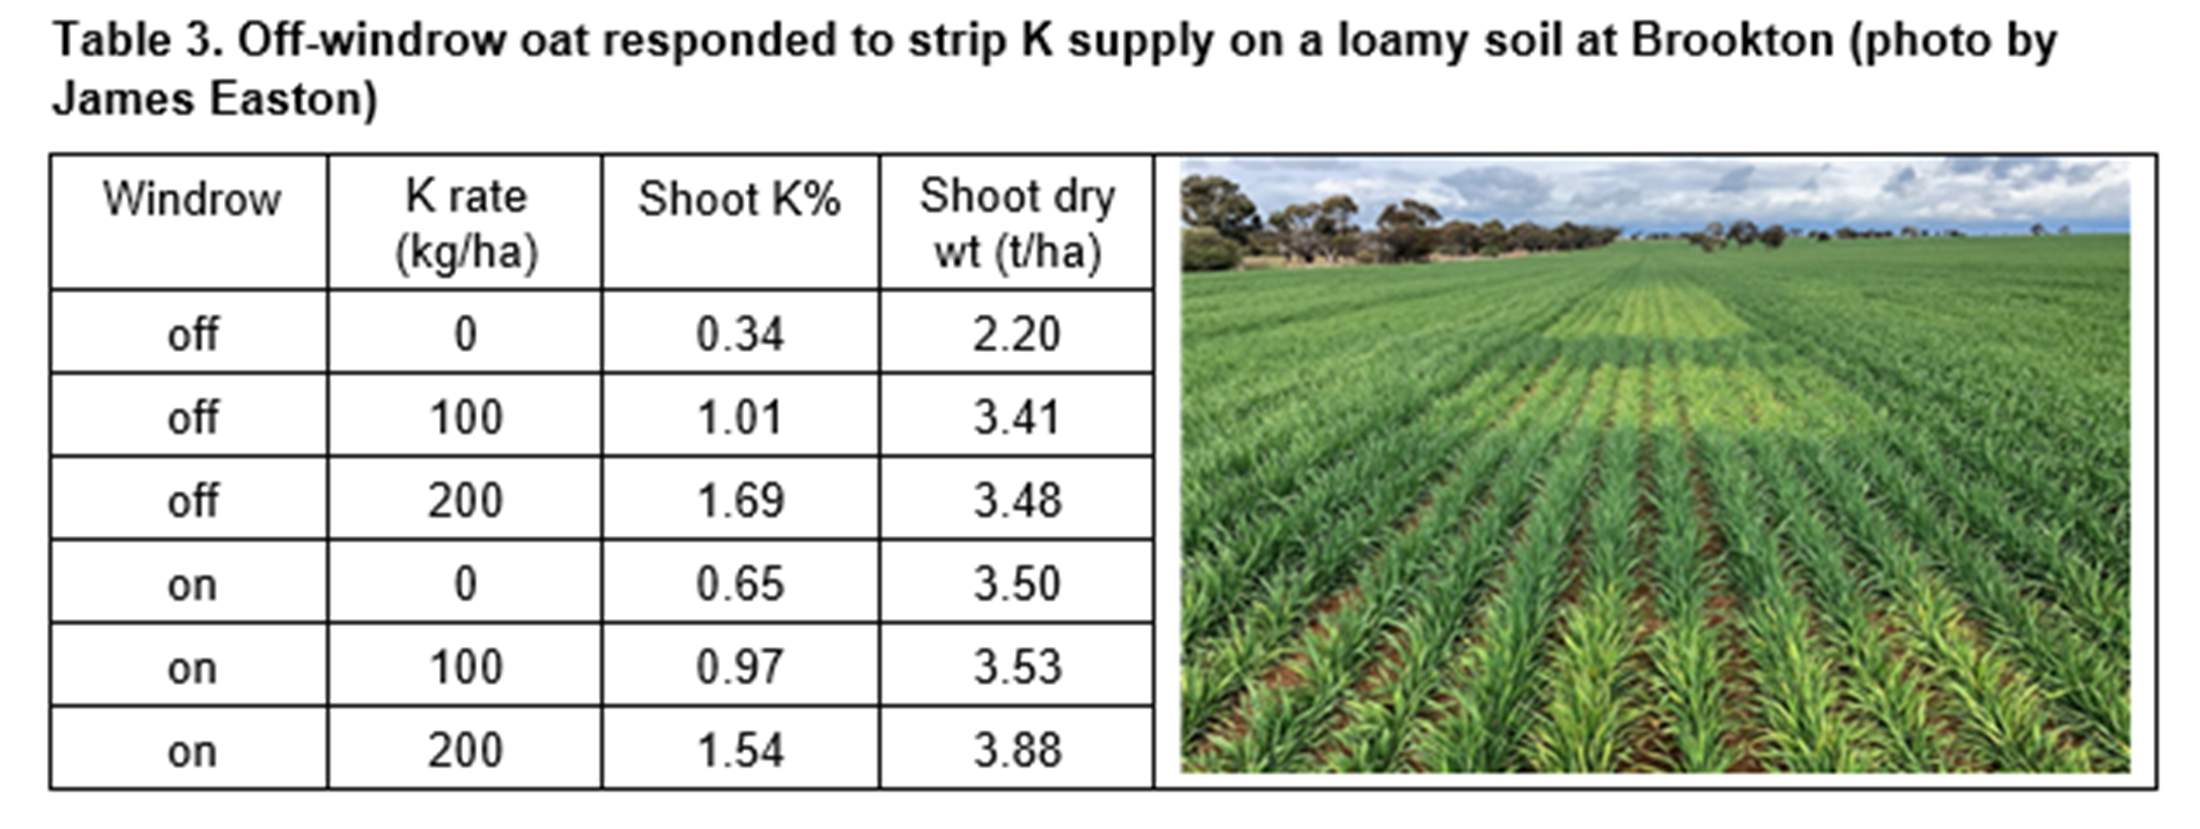
Our earlier results showed windrowing effects on wheat grown on loam soils at York and Meckering in 2019 were attributed to increased K availability in 2/3 cases studied, while poorer crop growth off the windrows was mainly the result of low K levels. However, wheat K response occurred at one site with soil Colwell K above the current critical K concentrations. In the 2020 season, oat was grown on a sandy clay loam at Brookton where Colwell K concentrations off and on the windrows were 40 and 60mg/kg at 0–10cm and 20 and 30mg/kg at 10–30cm, respectively. There was much better growth on the windrows than off the windrows, and application of 100 or 200kg K/ha increased shoot dry weight by 10% on the windrows and by 60% off the windrows (Table 3).
K response on loamy soils
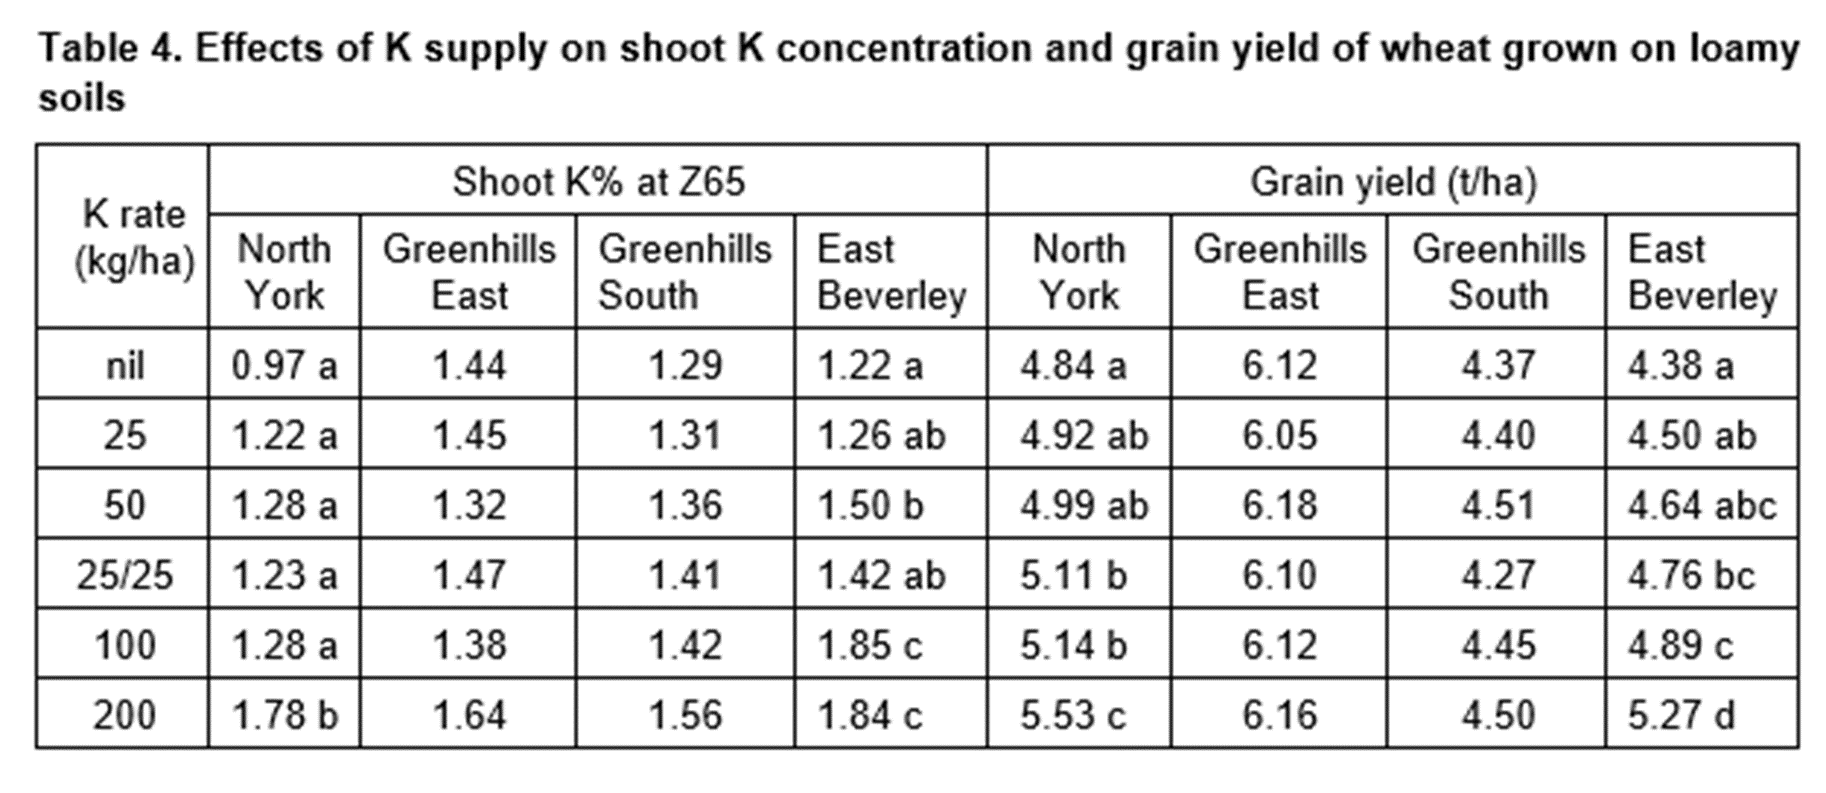
Shoot K% at Z30 was significantly increased by 100 or 200kg K/ha at all sites except for Greenhills East, while the shoot K response at Z65 persisted only at North York and East Beverley (Table 4). Compared with nil-K supply, the treatments of 25/25 split, 100 and 200kg K/ha significantly increased grain yield at North York and East Beverley (Table 4).
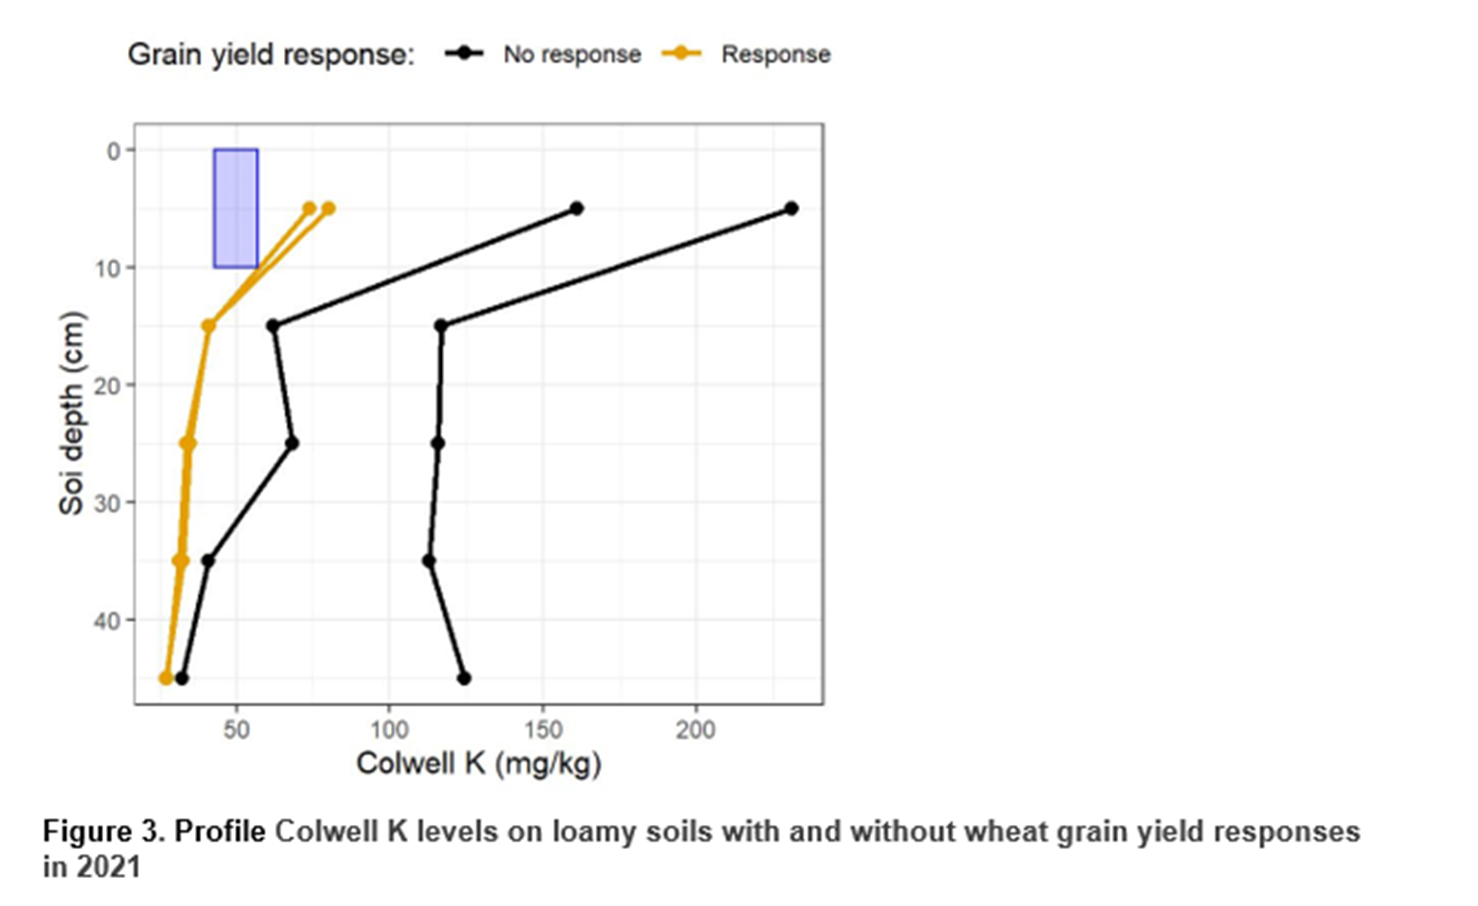
The soils of all four sites, classified as Kandosols or Dermosols, contained >74mg K/kg at 0–10cm, which is above the critical range of 43–57mg/kg for Kandosols (yield >3t/ha; Brennan and Bell 2013). A comparison of the Colwell K profiles for the K responsive and unresponsive sites (Figure 3) show that the Colwell K at 0-10cm at the responsive sites was 74 and 80mg/kg, and subsoil K levels were much lower than the unresponsive sites. Figure 3 also shows that responses to K on these soils were at levels above the current critical range for Kandosols (blue shaded box). Work on determining critical ranges for loamy soils (Kandosols) in WA is ongoing.
Conclusion
Widescale depletion of plant-available K in soils is occurring in WA, with up to half of soil samples falling below the critical K level in the coastal plain south of Geraldton and up to 25% in other regions. There is also emerging evidence of K responses on loamy soils, which was demonstrated by crop responses to K differences caused by crop residue windrows in 2019–20 and to higher K fertiliser rates on loamy soils in 2021. While higher rates of K application are required for sustainable cropping, a more holistic approach to crop K nutrition would improve K-use efficiency and cropping profitability. Besides soil and plant testing, deep or split applications to maximise fertiliser K-use efficiency, the use of deep-rooted crops to recycle leached K from subsoils, and adequate supply of other nutrients, particularly N, are management options available at present.
Acknowledgments
The research undertaken as part of this project is made possible by the significant contributions of growers through both trial cooperation and the investment by GRDC, the authors would like to thank them for their continued support. We acknowledge the advice of Tim Boyes, agVivo and Mark Gherardi, Summit Fertilizers in site selection for 2021 experiments.
References
Brennan RF, Bell MJ (2013) Soil potassium – crop response calibration relationships and criteria for field crops grown in Australia. Crop & Pasture Science 64, 514–522.
Bryce A, Neuhaus A (2020) The health and nutrition of Western Australian soils. CSBP Limited, Kwinana, W. Aust.
Harries M, Flower KC, Scanlan CA (2021) Sustainability of nutrient management in grain production systems of south-west Australia. Crop & Pasture Science 72, 197–212.
Ma Qifu, Bell Richard, Scanlan Craig and Neuhaus Andreas (2022). Long-term rundown of soil K reserves in Western Australia requires a re-evaluation of K management in grain production: a review. Crop and Pasture Science (accepted)
Reuter D, Duncombe-Wall D and Judson J (1997) Potassium balance in Australia’s Broadacre Industries: a contemporary national and regional analysis. In Proceedings of the First Workshop on Potassium in Australian Agriculture, held 3-4 October 1997 at Geraldton, WA. pp.17-24.
Contact details
Richard Bell
SoilsWest, Centre for Sustainable Farming Systems, Food Futures Institute, Murdoch University
90 South St, Murdoch, WA 6150
Ph: 0405131429
Email: R.Bell@murdoch.edu.au
GRDC Project Code: UMU1801-006RTX,
Was this page helpful?
YOUR FEEDBACK