Yes, no, maybe – getting value from herbicide resistance testing
Introduction
The detection of herbicide resistant weed populations generally occurs in the field as a consequence of the failure of a herbicide treatment that was previously effective. If resistance can be confirmed earlier, growers may be able to better anticipate the causes of herbicide failure and have the opportunity to change their weed management for effective control and to reduce the spread of resistance (Perez et al, 2021).
Herbicide resistance testing services allow growers and their agronomy advisers to submit weed seed samples and confirm the resistance status of the sampled population to a range of herbicides. The economic value to the grower from knowing the resistance (or susceptibility) status of weed populations to a range of herbicides is the ability to make a better informed choice of what cost-effective herbicide to use next.
Testing services have been available for over 30 years however there is industry concern that testing services are underutilized. In this study we address the following research questions: i) what are the perceived benefits, extent and reasons for growers and agronomist using herbicide resistance testing? ii) do growers and agronomists correctly assess the status of weed resistance status?
Method
Agronomists collected weed seed samples from 128 paddocks across the Western Region port zone of WA. Paddocks were chosen according to the grower or agronomist’s interests to better understand the herbicide resistance status of annual ryegrass and wild radish. Herbicide resistance tests were conducted on each weed sample using method outlined in Busi et al. (2021).
Herbicide resistance incidence against annual ryegrass and wild radish was determined by using the recommended dosages of stand-alone and two-component mixtures. The ryegrass samples were tested with 28 herbicide treatments and wild radish to 22. In total, 3338 individual tests were conducted on samples from128 paddocks belonging to 25 growers.
Three categories were used to describe the resistance status: Susceptible if plant survival rate is 0-5%; Developing if greater than 5% to less than 20% survival; Resistant if 20% or greater survival.
Each participating grower and agronomist who consented to being contacted by the research team (UWA Human Ethics ET000244) was sent the link to an online survey. Information about their farm characteristics, past testing experience, reasons for testing (or not) and their assessment of resistance status (susceptible, developing or resistance) for each sample (weed species and herbicide) was collected.
A total of 25 farmers reported on their perceived herbicide resistance status for 12 herbicides across each weed seed sample (ryegrass and wild radish) they had tested. 15 agronomists also reported their expectations of resistance status on the farms they sampled.
Differences between two sample proportions were analyzed by using the Pearson's chi-squared test of independence (Pearson, 1900) . Fisher’s exact test (Fisher, 1935) was applied when one or more of the cell counts of categorical variables was less than 5. Further, multiple pairwise comparison were performed to test the equality of proportions across samples.
Results
Sample characteristics
The average farm size consists of 5,843 ha (5077 s.e). Just over half of the sampled farms (52%) are characterized by cereals, break crops (canola/legumes) and pasture system; a cereal and break cropping farming system represents 40% of the farms sampled; and 8% of farms sampled are mostly cereals with chemical fallow.
The farmers reported 60 percent had used herbicide resistance testing in the past (excluding this project) and similarly, the agronomists reported 62 percent of all farmers included in the project had used herbicide resistance testing.
Growers reported a larger number of paddocks on their farm have been tested to ryegrass (7) than radish (3) in the past 10 years. Agronomists reported 12% and 10% of clients paddocks had been tested for ryegrass and radish resistance, respectively, in the past 10 years. A study conducted in 2001 reported similar levels of use; 63% of WA grain growers had used some herbicide resistance testing (ryegrass) and 11% of WA cropping land had been tested (Owen et al 2002). The comparison with the current study supports the argument that there has been no major increase in test use over the past 20 years.
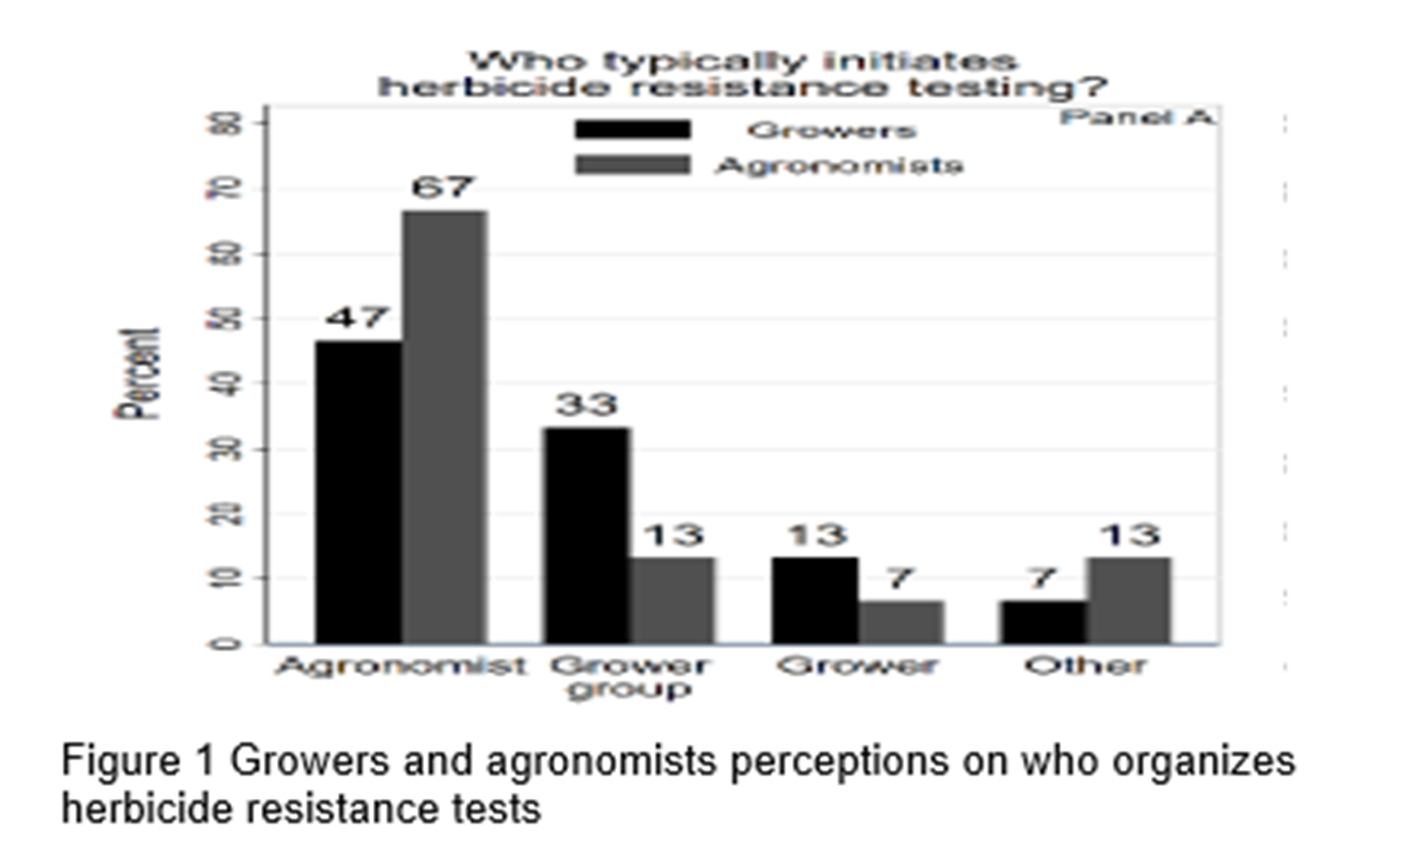
Figure 1 shows that only 13% of growers said they organised their own herbicide resistance testing in the past, with agronomists most commonly organizing testing.
Growers reported that the most common weed management decisions that were made from test results related to herbicide and crop rotations. However, for the majority of growers and agronomists (67 and 53% respectively) the test results were reported to have had minor or no influence on their management decisions.
22 of the 25 farmers reported visual observation (i.e. herbicide treatment failure) as their primary method for identifying a resistance weed population. The most common reasons given for not doing more (or any) testing were related to time required to collect a sufficient sample and the inconvenient (harvest-time) sampling period.
Actual test results
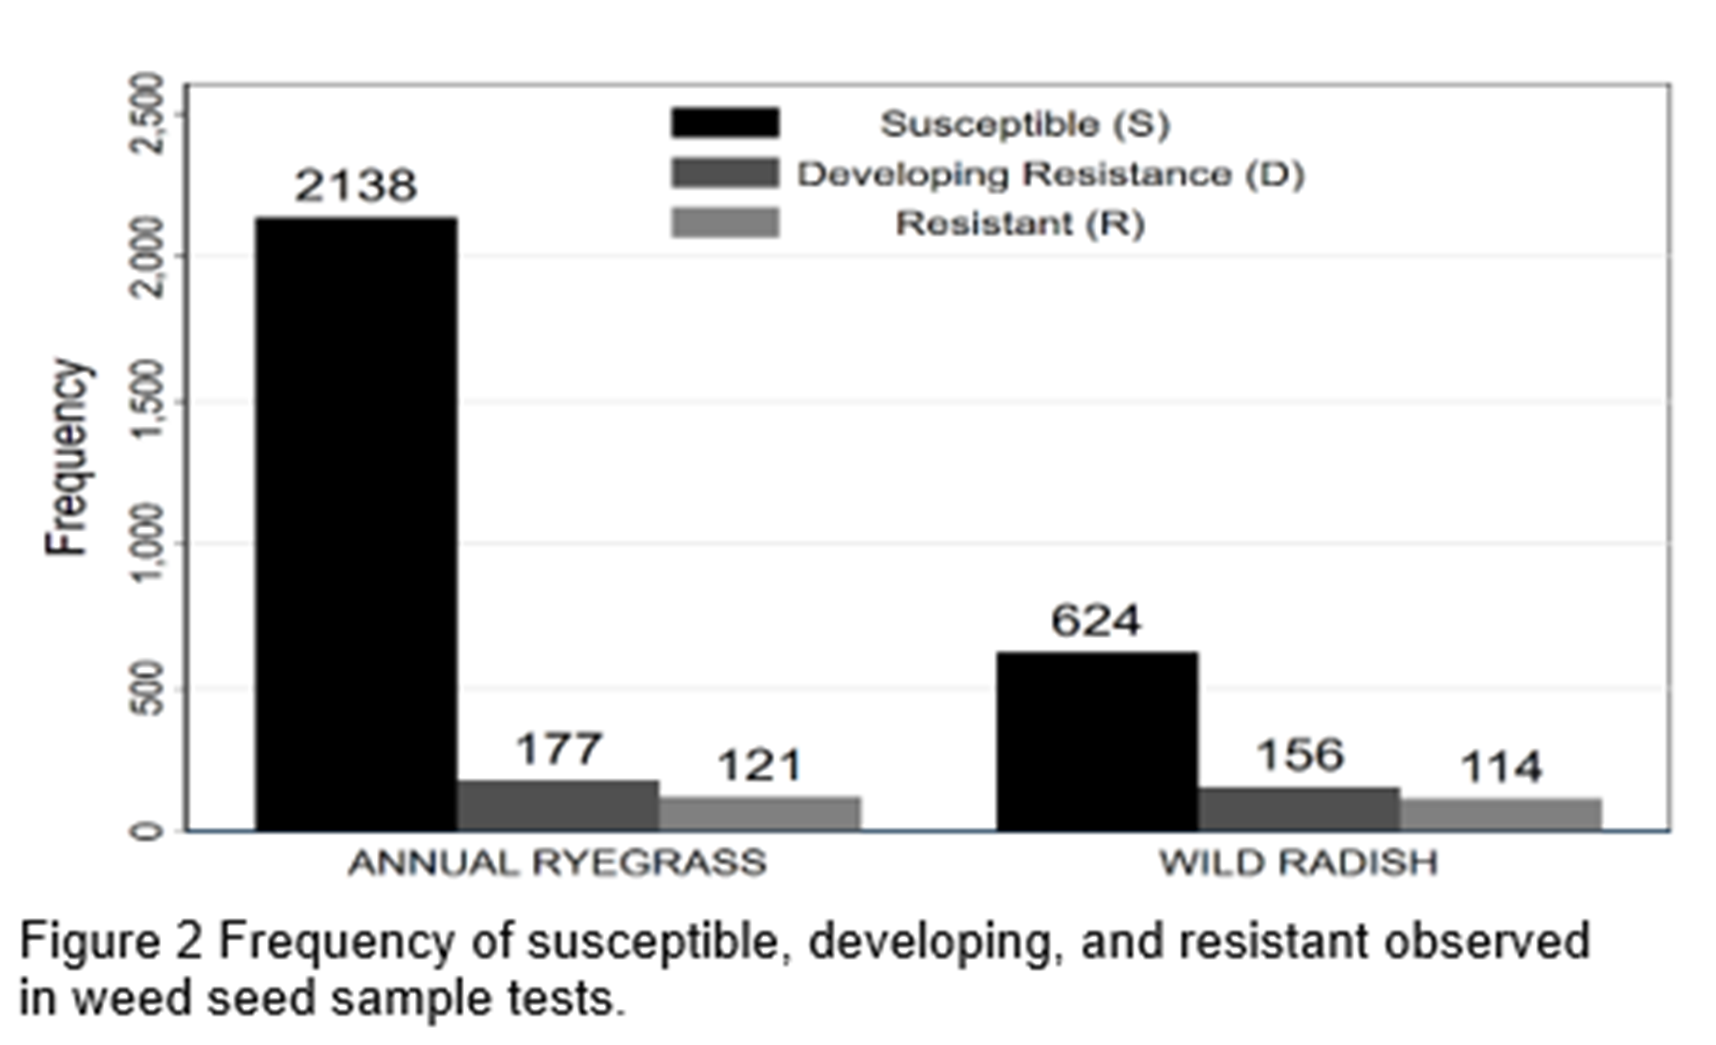
The actual test outcomes for all weed seed samples and herbicide mixes are presented in Figure 2. The high proportion of susceptible results is unusual (Broster et al. 2019), however the sample does include many herbicides where resistance is uncommon (e.g. pyroxasulfone and paraquat).
Actual test vs perception of herbicide resistance status
Figure 3 shows growers and agronomists have a similar pattern of underestimating susceptible weed populations, overestimating developing resistance and are reasonably accurate with their assessment of resistant weed populations.
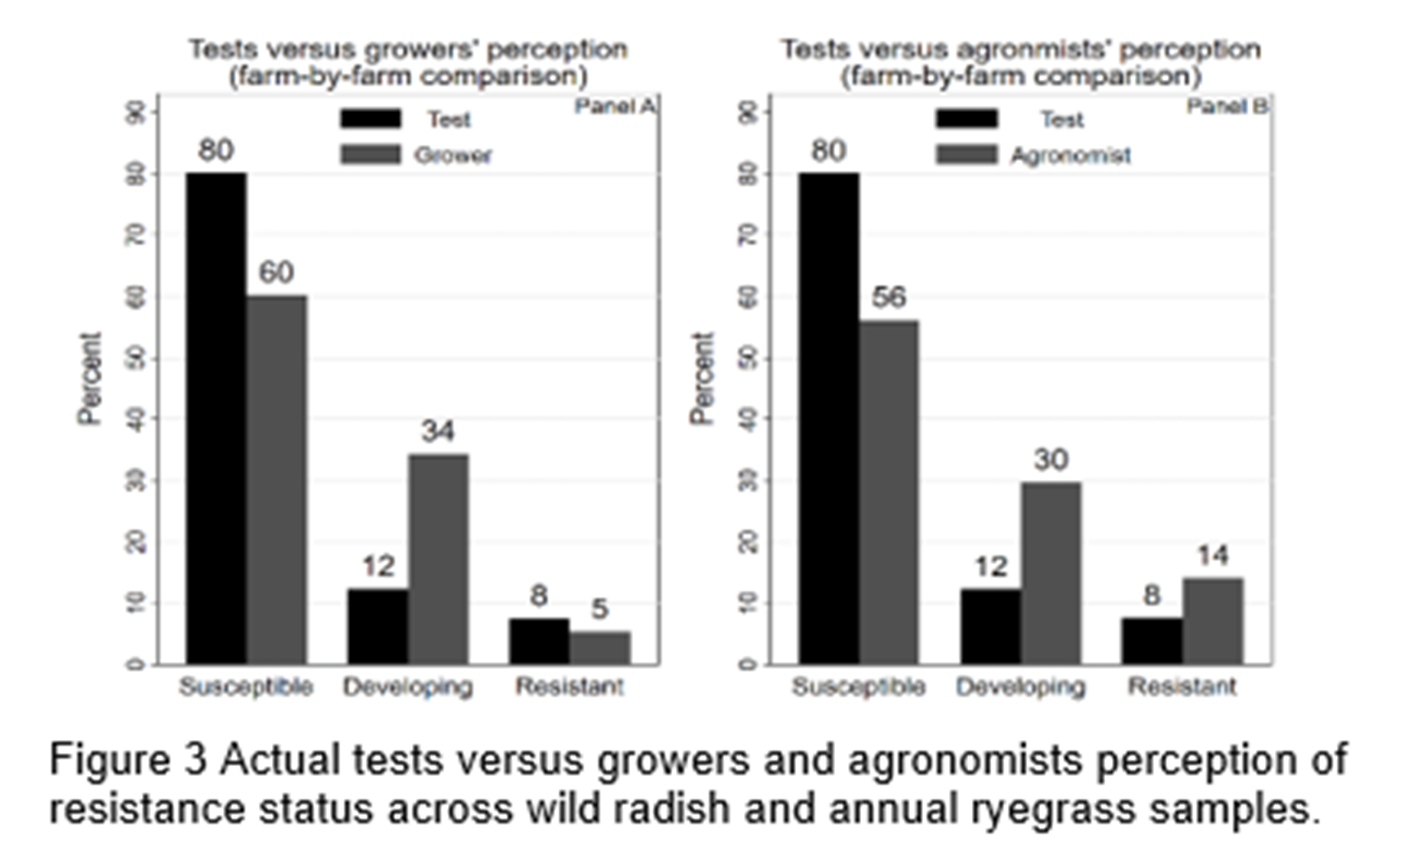
Figure 3 shows a relatively low perceived herbicide susceptibility (60%) and relatively high perception of developing resistance (34%) in the growers’ survey data in comparison to the actual test data. There is no statistically significant difference between the likelihood of the actual test results being resistant and growers’ perception of herbicides being resistant.
Figure 4 shows the extent to which growers’ perception (of R, D or S) and actual test outcome align at paddock level. Alignments are poorer in wild radish as compared to annual ryegrass: 44% of growers’ perception of herbicide resistance status align for radish and 67% for ryegrass.
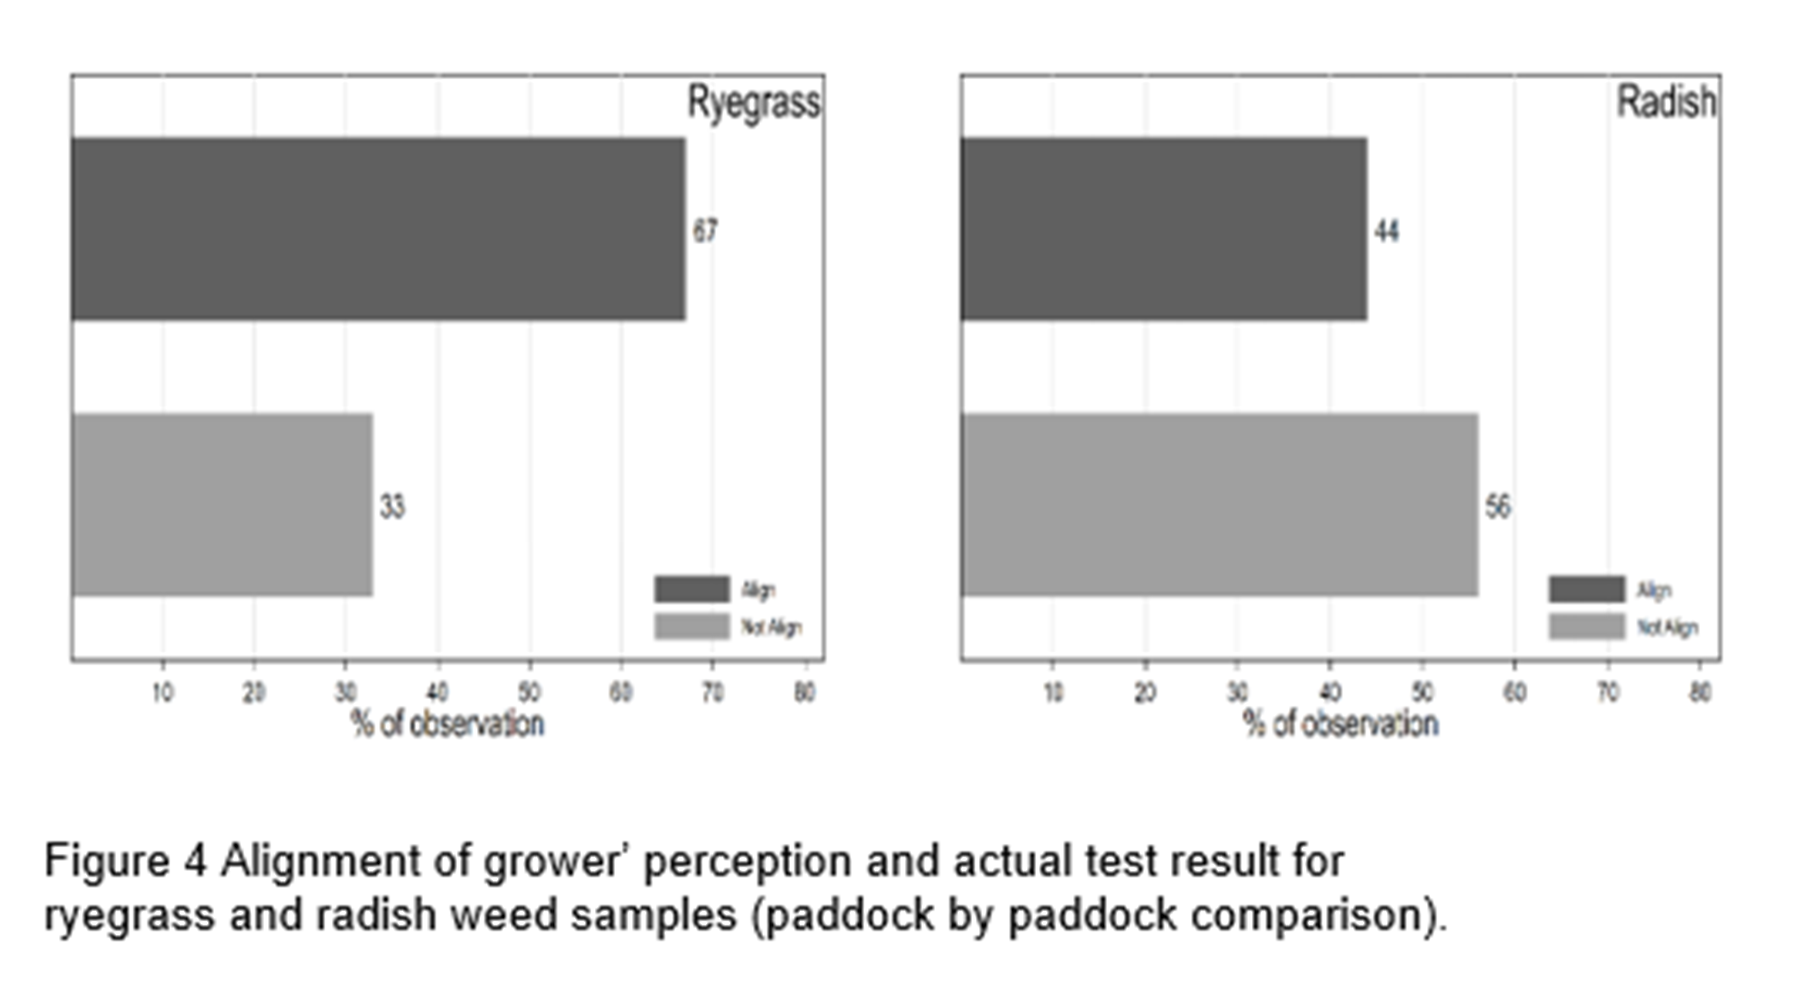
Table 1 provides a disaggregated comparison of the actual test results versus grower’s perceptions by herbicide type. In the case of ryegrass, grower perception of resistance status aligns 90%, 88%, and 93% of the time for Paraquat, Prosulfocarb and Pyraoxasulfone. There is a significant difference in alignment for Trifluralin, with perceptions and test results not aligned for 59% of samples.
In the case of radish, growers are accurate in their resistance assessment for Pyrasulfotole + Bromoxynil 92% of the time. For Diflufenican, Imazamox + Imazapyr, Triasulfuron grower perceptions of resistance status are not aligned in 69%, 82% and 85% of cases, respectively.
Table 1 Paddock-by-paddock: do growers’ perception and actual tests outcome align for different herbicides?
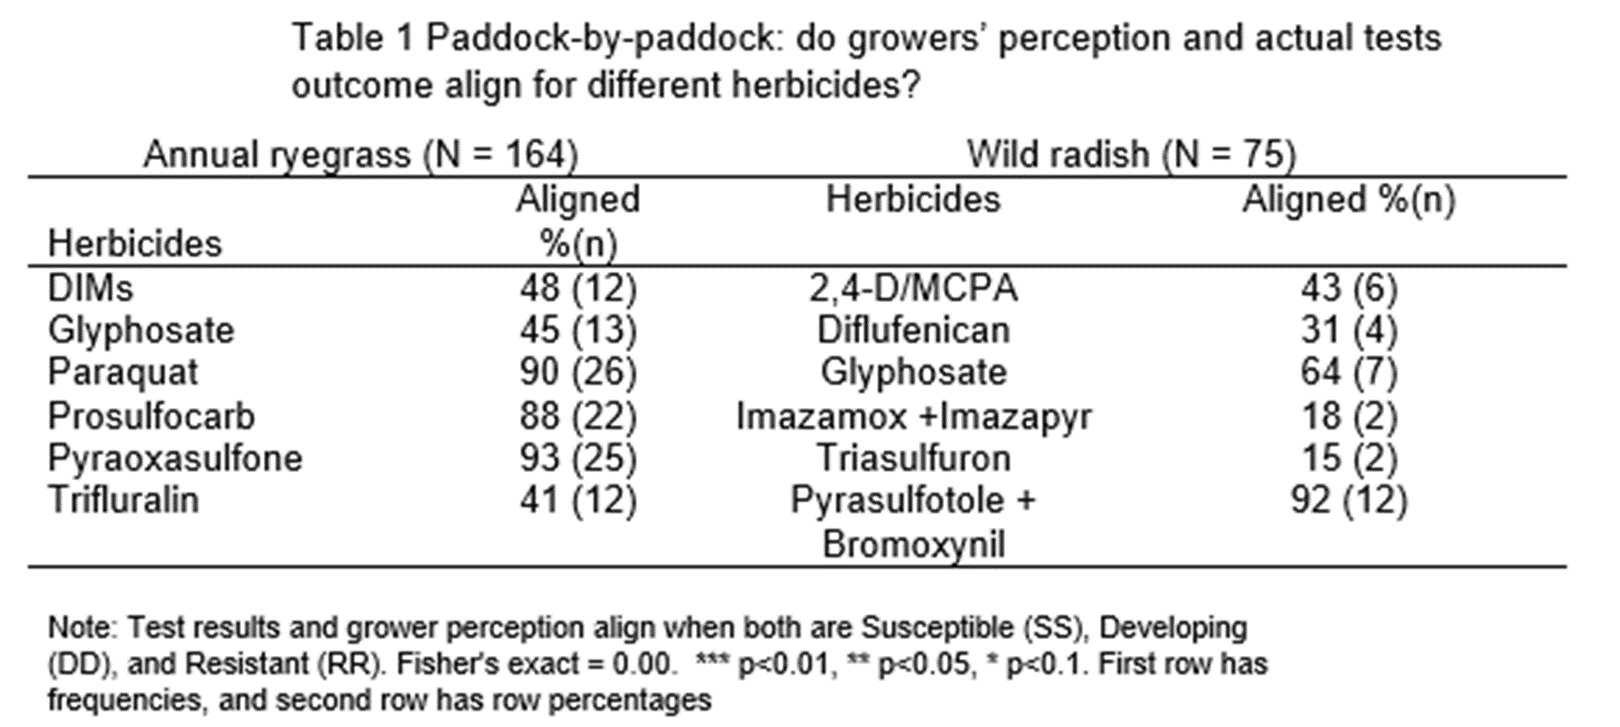
Figure 5 and 6 present all possible scenarios of the actual test outcomes and growers’ perceptions for the radish and ryegrass samples. There is evidence that growers more commonly underestimate the resistance status of wild radish than ryegrass (eg see RS & RD classifications in Figure 5 below). In 19% of cases the test result confirms radish resistance but growers perceive susceptible or developing resistance. In 15% of cases the test result showed it had developing resistance but the grower perceived the weed population was susceptible. There are very few cases of resistant populations being perceived to be susceptible in the annual ryegrass samples.
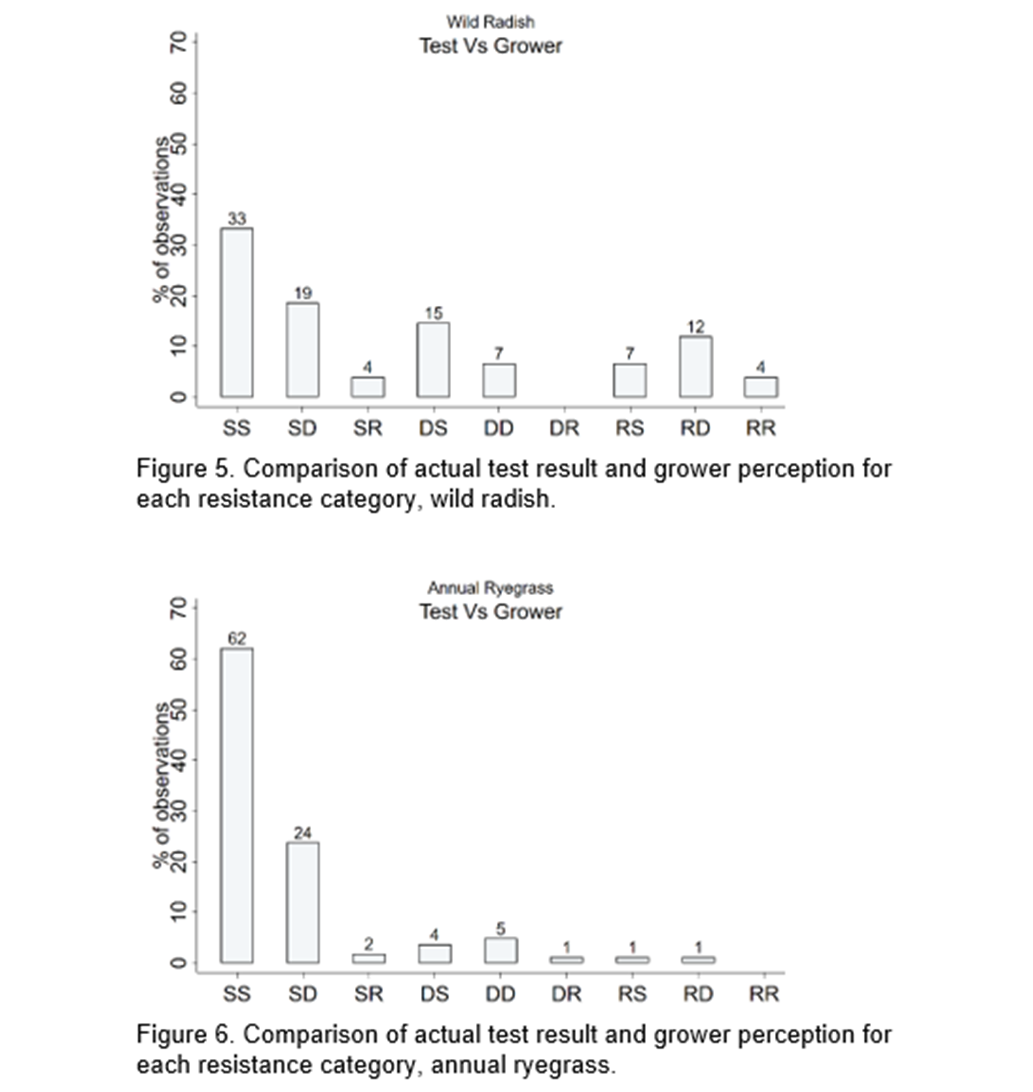
Figure 6 shows some growers are overestimating their resistance status in annual ryegrass. 24% perceived the sample to be developing resistance when the test result showed it is susceptible.
Certainty in perceptions
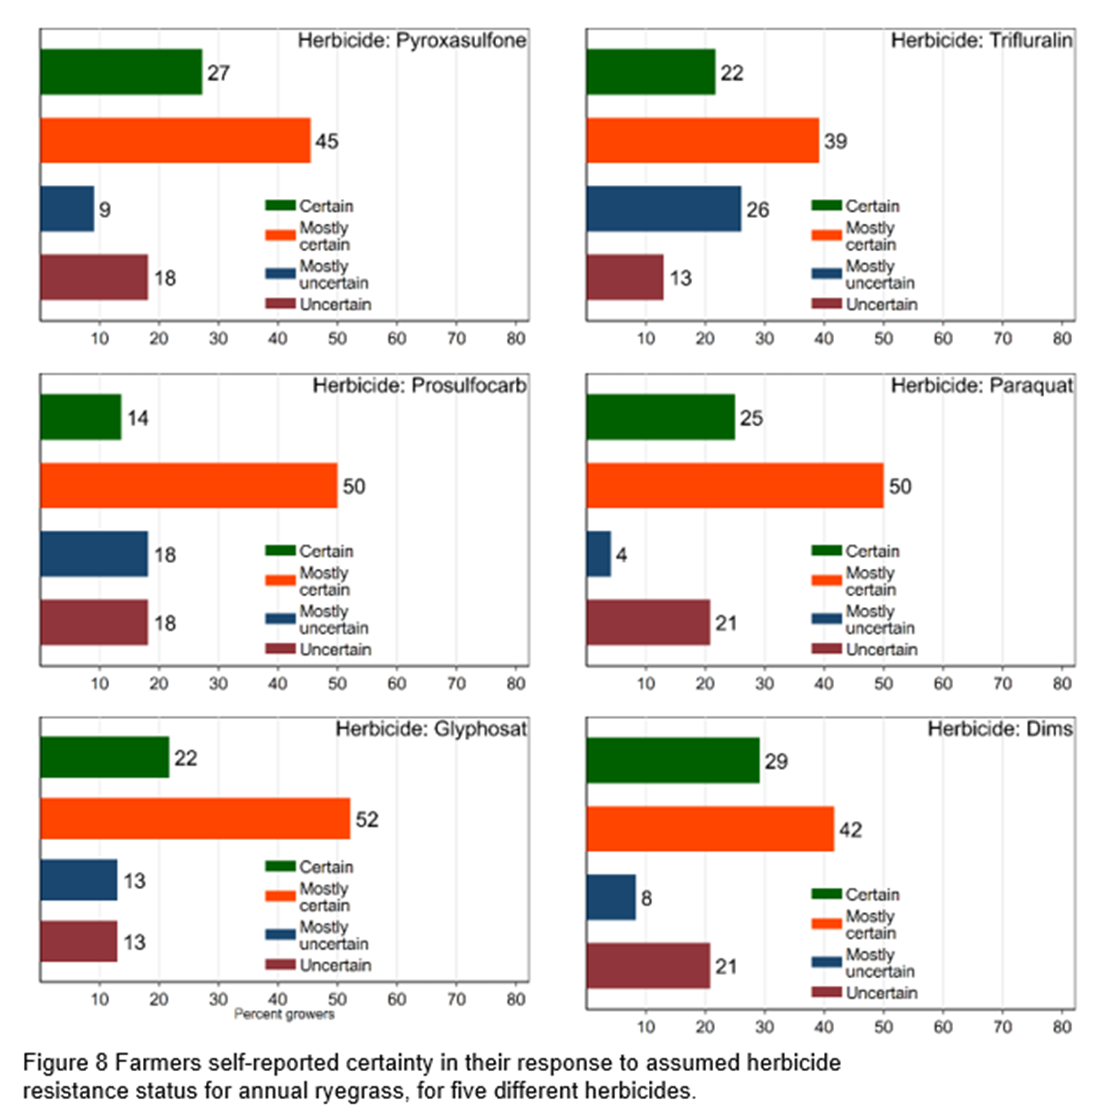
Growers were asked to indicate how certain they were about their own assessments of the herbicide resistance status prior to receiving any resistance test results. Figure 7-8 shows that growers are generally certain or mostly certain of their assessment. For ryegrass, most uncertainty was for the pre-emergence herbicides Trifluralin (39%) and Prosulfocarb (36%) and for wild radish Imazamox + Imazapyr (32%) and Diflufenican (32%).
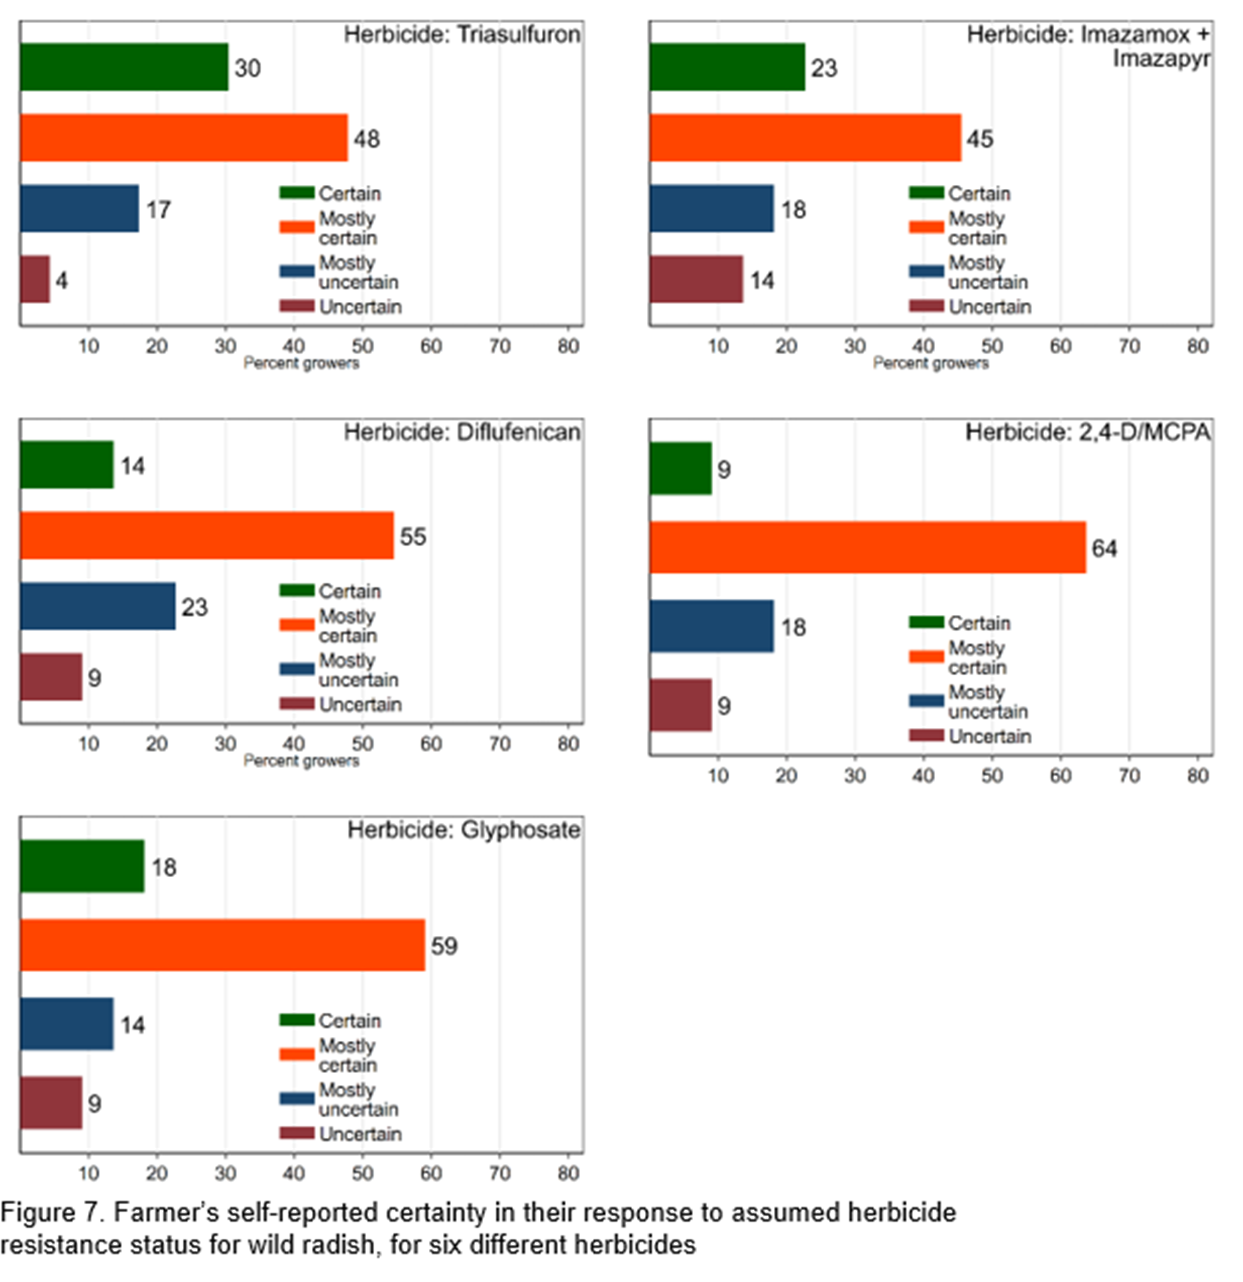
Figure 8 shows growers are at least mostly certain of the resistance status of ryegrass (64-74%). Most uncertainty is shown for pre-emergence herbicides Trifluralin and Prosulfocarb (36-39%).
There are some limitations to our analysis that should be considered. These include the small sample size, challenges in sampling a paddock population and replicating field conditions when testing.
Conclusion
The purpose of the study was to understand the potential information benefits and reasons for growers and agronomists using herbicide resistance testing.
We found growers and agronomists were reasonably accurate in their assessment of populations that are resistant but, overestimating developing resistance and underestimating susceptibility (compared to test results) was more common. This points to the potential for herbicide resistance testing to not only provide early confirmation of evolving resistance but to also be used as a ‘susceptibility test’ so that potentially cost-effective herbicide options are not dismissed.
Grower assessment of herbicide resistance status is much more commonly based on in-paddock observation than testing, so it is no surprise that where in-paddock observation of resistance to a particular herbicide is more difficult (e.g. pre-emergence herbicides and those commonly used in mixes) that there can be less alignment between perceptions and test results.
While it is uncommon for growers to perceive a resistant population to be susceptible, the results show that there are herbicide and weed situations where herbicide resistance testing information can lead to better-informed herbicide management decisions.
Acknowledgements
The project was funded by the GRDC. Thanks to the participating growers and agronomists.
References
Broster, J.C., Pratley, J.A., Ip, R.H.L., Ang, L., Seng, K.P., 2019, A quarter of a century of monitoring herbicide resistance in Loliumrigidum in Australia, Crop and Pasture Science, 70(3): 283-293
Busi, R., Beckie, H.J., Bates, A., Boyes, T., Davey, C., Haskins, B., Mock, S., Newman, P., Porrih, A., Onofri, A., 2021, Herbicide resistance across the Australian Continent, Pest Management Science, 77: 5139–5148
Lacoste, M., & Powles, S. (2015). RIM: Anatomy of a Weed Management Decision Support System for Adaptation and Wider Application [Article]. Weed Science, 63(3), 676-689. https://doi.org/10.1614/WS-D-14-00163.1
Owen, M., Gillam T., Llewellyn, R., Powles, S. 2002. A test for resistance testing. Crop Updates 2002 - Weeds. Department of Agriculture, Perth. Conference Proceedings. https://researchlibrary.agric.wa.gov.au/crop_up/19/
Perez, M.B., Beckie, H.J., Cawthray, G.R., Goggin, D.E., Busi, R., 2021, Rapid On-Farm Testing of Resistance in Lolium rigidum to Key Pre- and Post-Emergence Herbicides, Plants, 10, 1879.
GRDC Project Code: UWA2006-006SAX,
Was this page helpful?
YOUR FEEDBACK