Practical processes for better soil water management
Practical processes for better soil water management
Author: Neal Dalgliesh, CSIRO | Date: 28 Feb 2014
Author
Neal Dalgliesh, CSIRO
GRDC code: CSP00170
Take home message
Understanding the processes involved in the capture and storage of rainfall for future crop production, and knowing the status of current soil water using the tools currently available for its monitoring, can result in improved crop productivity. Research is showing that it is the compounding effects of a number of aspects of fallow management that result in improved fallow efficiencies and subsequent, closer to optimal, production and economic returns. Tools are now available to better define soils in terms of their productive capacity and for the routine seasonal monitoring of the water resource as it is captured and utilised by crops (or weeds if allowed). The level of sophistication at which the grower invests in soil monitoring and management is at their discretion, however it should be remembered that while the use of higher level technologies can provide easier and more accurate real-time access to soil water information and to risk management tools such as simulation modelling, value can also be found in the more thoughtful use of simple devices such as the push-probe.
How important is soil water to crop productivity?
Those growing crops in the northern cropping region of Australia are well aware of the potential benefits of stored soil water to subsequent crop production. However, research is showing that more can still be done to improve both the efficiency of rainfall capture and the management of soil water to optimise its use in dryland cropping systems. Research, undertaken as part of the GRDC Water Use Efficiency Initiative, has shown that pre-crop management is more important than in-crop management in lifting the water use efficiency (WUE) and yield of wheat cropping systems (Kirkegaard and Hunt, 2013). It is the pre-crop practices of fallow weed management, rotation choice, long-term stubble retention and reduced tillage which are likely to have the most impact on fallow water storage and hence WUE and crop yield. In other words, it is the combining of ‘best’ practices that will contribute to the more efficient storage and use of available water. Underpinning the push to improve water use efficiency is the need for farmers and their advisors to have a good understanding of how soils work in relation to water capture and storage and why some soils have the ability to hold more water for crop use than others. Such baseline information, in conjunction with the seasonal monitoring of soil water, using tools that can range from something as simple as a push probe to simulation modelling, allows the setting of realistic decisions/goals on crop choice and inputs and yield potential.
So what needs to happen to enable producers to gain a better understanding on water holding capacity and an appreciation of what might be done to improve water capture and hence overall water use efficiency? Tools for the characterisation of plant available water capacity (PAWC) and the monitoring of soil water have been available for many years although there are changes occurring which will impact on how water is measured and decisions made.
But first the underpinning concepts....
1. Plant available water capacity (PAWC)
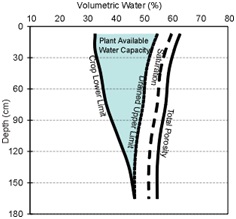
PAWC is a measure of the ability of a soil to store water for later crop production. Figure 1 shows the water states that are measured to determine a soil’s PAWC, or as it is often called, the size of its water bucket. The two most important are the drained upper limit (DUL) which is related solely to the physical properties of the soil, and the crop lower limit (CLL) which is related both to soil physical properties and to the ability of the particular crop to extract water from the soil.
Figure 1. A typical storage profile for a heavy-textured clay soil showing the potential water storage of the soil, PAWC, as defined by the drained upper limit (DUL-blue shading), crop lower limit (CLL), saturation (SAT) and total porosity (PO).
What physical properties affect PAWC the most?
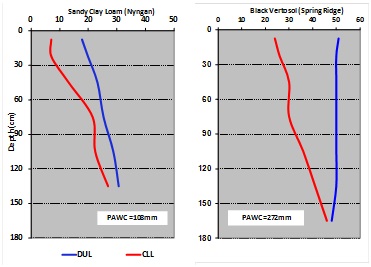
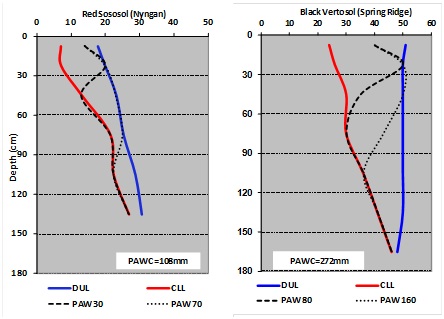
Texture, which is a measure of the proportion of sand, silt and clay present in a soil, is the most important physical parameter affecting soil water holding. In the example shown in Figure 2, the PAWC of a Sandy Clay Loam (Red Calcareous) from Nyngan is compared to that of a heavy clay (Black Vertosol) from Spring Ridge. While wheat is able to root to a depth of 150-180 cm in both soils, the clay soil has the ability to store more water. This is a result of clay soil particles (with particles <2 microns in size) having between 10 and 1000 times more surface area than those of sands (particles of 20-2000 microns). This is important because water is held by electrical charge around the surface of individual soil particles, the more surface area the more potential to hold water.
Figure 2. The effect of texture on the PAWC of soils-comparing a Red Calcareous (PAWC=108mm) (Nyngan) to a Black Vertosol (PAWC=272mm) (Spring Ridge).
While fine textured soils have the ability to hold larger quantities of water than sandier soils, there are some drawbacks. As a result of their smaller particle size, pore space (space between particles) is also finer which reduces water infiltration rate and can increase run-off, a particular problem in high-intensity rainfall events or after prolonged periods of rainfall. The ability to hold more water also puts clay soils at a disadvantage in situations where rain falls as a single, isolated event. Because of theie higher PAWC, water from small events is stored close to the soil surface, and unless follow up rain occurs soon after, is often lost to evaporation. This contrasts with lighter textured sandy soils where, due to the lower water holding capacity, water moves deeper into the profile, making the water less susceptible to evaporative loss. Of course, if the rain continues on a sandy soil it is likely that drainage will become a major loss factor.
Other physical soil attributes such as soil depth also impact on water holding capacity as do chemical constraints.
What soil chemical attributes affect PAWC?
Sub-soil constraints (SSC), particularly salinity and sodicity, but also nutrient deficiency/toxicity resulting from high/low pH, are common in northern cropping soils and do impact on a plant’s efficiency to access/extract soil water.
While both sodicity and salinity impact on PAWC, their mode of impact differs. While sodicity is a soil chemical imbalance (higher proportion of sodium ions relative to other cations) the effect on the plant is physical. High levels of sodium cause dispersion of the fine soil particles resulting in the blockage of soil pore space which not only slows root extension and consequent access to soil water, but when present in the soil surface, also impairs water infiltration with subsequent impacts on run-off and erosion. Sodicity is measured as the Exchangeable Sodium Percentage (ESP) of the soil.
In contrast, salinity has a direct chemical effect on the plant’s ability to extract water from the soil. First and foremost, high levels of salt reduce the efficiency of water uptake by roots. This results in a diminished plant water supply (in other words, a reduction in soil water bucket size) even though soil water measurement e.g. with a push probe, may indicate the presence of available water. Also, in soils high in salt, its continuing absorption by a plant may result in unthrifty growth and death. It should be remembered however, that not all plants are treated equal, some species being more salt tolerant than others. Salinity is commonly measured as Electrical Conductivity (EC) which is a measure of total salts. This measure should be used with care in northern vertosols, due to the common presence of gypsum, a salt that is benign in terms of plant productivity but included in the EC measurement. The preferred method is to analyse for Chloride which provides an estimate of the particular salt deleterious to plant growth.
pH impacts on nutrient availability and hence on the efficiency of the plant to extract soil resources. The vertosols of the northern cropping region are typically alkaline (pH >8) making them prone to deficiencies in zinc and phosphorus. In acid soils, at pH <5.5, aluminium and manganese become more soluble and more toxic as their concentration in the soil water rises. Aluminium inhibits root growth in most plants and induces calcium, phosphorus and molybdenum deficiencies (Qld NRW, 2007).
Chemical analysis is the typical means of developing understanding of the potential impacts of SSCs on crop production. It should be remembered that even when armed with such information it may still not be economically or practically feasible to ameliorate some conditions, particularly those at depth. However, such testing does provide the grower with the basis for being realistic about yield potential and the matching of crop inputs to suit that potential.
A surrogate for chemical analysis is the field measurement of crop lower limit (CLL). Assuming that the characterisation site is representative of the local soil type, the measurement of water extraction by a well grown crop (not water or nutritionally deficient) integrates all of the physical and chemical attributes of the soil into the data, providing the grower with a holistic view of rooting depth and extraction capability.
How deep do plant roots grow?
Given the above discussion on soil chemical and physical constraints, the depth of potential crop rooting will vary considerably between soils and environments. Therefore, rooting depth should be determined through perusal of physical and chemical data and the physical observation of roots and water extraction through soil coring and/or electronic monitoring. Rooting depth (and hence PAWC) varies between soil types due to physical and chemical differences, and also varies between crop types grown on the same soil, a result of physiological differences, including crop season length, ability to extract water from the soil matrix and to handle SSCs. As a general rule of thumb, longer season crops including wheat, maize, cotton and sorghum tend to root deeper than the shorter duration legume crops such as mungbean. Table 1 provides an estimate of rooting depth for crop species commonly grown in northern NSW.
|
Crop |
Rooting Depth (cm) |
Duration |
|---|---|---|
|
Mungbean |
90 |
3 months |
|
Chickpea |
150 |
5-6 months |
|
Wheat |
150 |
5-6 months |
|
Cotton |
180 |
6 months |
|
Sorghum |
180 |
4 months |
|
WF Millet |
180 |
3 months |
|
Sunflower |
>200 |
4-5 months |
|
Lucerne |
>300 |
perennial |
While a discussion about rooting depth is important to the overall understanding of soil water management, it should be remembered that many soils do not wet to their full potential (wet to potential rooting depth) in every season. Taking the grey and black vertosols of the northern region as an example, it is likely that they will not regularly wet deeper than around 1 m, unless preceded by a long fallow or high intensity rainfall coincides with severe soil cracking. While the lighter soils of this region may potentially wet deeper than the vertosols, infiltration may be constrained by surface sealing which will slow infiltration and exacerbate run-off.
While an understanding of the water dynamics in the top 1 m of the profile may be more useful for the routine monitoring and management of soil water, it is still important to know when conditions conducive to filling the profile have occurred so that the additional water resources can be exploited e.g. through the planting of a deeper rooting crop, or the planting of a longer season variety or changes in management such as the application of additional fertiliser. Remember that it is difficult to exploit a resource if you don’t know it exists. It should also be understood that where crop simulation (Yield Prophet, APSIM) forms part of the crop management tool-kit, knowing the soil water to the potential crop rooting depth is an important input.
2. Obtaining information on PAWC
What tools are available off the shelf?
Twenty years of collaboration between CSIRO, the state departments, consultants, industry groups and individual farmers, with support from GRDC, has resulted in approximately 1000 Australian cropping soils being characterised for PAWC. These data are provided to users through the APSoil database and its Google Earth derivative, and ‘SoilMapp’, an IPad application which is available from the Apple On-line Store. These data also form the basis for crop decision support using APSIM and Yield Prophet. APSoil data, accessed by one of the above tools should be the first option for those seeking soil water information. If suitable data are not available for local soils, measurement of PAWC is required.
Measuring PAWC-Field based characterisation
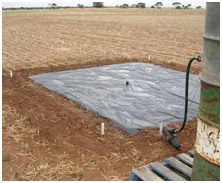
Field-based soil characterisation has traditionally been a collaborative effort between researchers, local farmers and consultants which has allowed the selection and characterisation of soils seen as being regionally important. Water is applied to the site (using drip irrigation) until it is considered to be fully wet to the depth of rooting (Figure 3). This may take a number of months in the heavier clay soils, although can be as short as a few days on sands. After drainage has ceased, measurement of soil moisture at drained upper limit (DUL) and the bulk density (BD) are undertaken.
An estimate of the lower limit of crop extraction (CLL) for a particular species, grown on the soil of interest, is then done. At around crop flowering, a rain-exclusion tent is erected over a healthy area of the crop (either on, or adjacent to the DUL site) which is then allowed to grow through to maturity or until senescence (Figure 4). Monitoring of soil moisture is then undertaken to determine CLL. It is recommended that CLL be measured for the range of local crops (possibly over a number of seasons) to determine differences in ability to extract water and hence differences in PAWC.
With the collection of the above data PAWC is able to be calculated. The step-by-step soil characterisation process is described in the technical manual Estimating Plant Available Water Capacity (Burk and Dalgliesh, 2008) which is available from GRDC.
|
Figure 3. Typical field setup for the measurement of DUL and BD using trickle irrigation, a plastic cover and water supplied from a header tank.
|
Figure 4. A rain exclusion shelter used to protect the crop from late season rainfall prior to the measurement of CLL.
|

Measuring PAWC-Lab based characterisation
The lab based measurement of soil water content at potentials of -10 kPa (drained upper limit) and –1500 kPa (lower limit) are arguably a more accurate means of determining a soil’s PAWC but do require specialist expertise and equipment normally found only in a soils laboratory. The lower limit of extraction determined using this methodology represents an arbitrary theoretical limit of plant extraction (1500 kPa), which in the paddock situation varies with crop type, extraction ability, and soil depth (at depth root density decreases and water extraction is generally lower). Traditional 1500 kPa lab-based measurements have, for many years, been obtained from grinding then re-wetting and drying soil samples. This has led to errors due to the grinding and wetting process with effects on soil porosity and bound water. Newer methods using soil psychrometry and intact core samples are increasingly being used and yield accurate results across a range of lower soil water potentials.
Measuring PAWC-Other options and opportunities
The above methods are expensive in both time and equipment. Other opportunities currently exist, or are currently under development.
Wettest and driest soil profile: One of the simplest methods for a consultant or farmer to determine PAWC is to make judgement calls on when a soil profile is fully wet to depth, and when it is dry after the growing of a particular crop. Measurement of soil water content at these 2 points will give a reasonable estimate of the upper and lower limits of extraction and will allow a calculation of PAWC which will suffice for most uses. This method of determining PAWC is particularly appropriate for electronic soil water monitoring systems e.g. capacitance probes such as the EnviroSMART, where soil moisture is monitored through time and the wet and dry points are able to be easily identified. The catch with this type of device is that data is generally outputted in millivolts or similar which is a measure that many would have difficulty in relating to water availability. The Soil Water Express tool (Burk and Dalgliesh, 2012) has been developed to assist in this process allowing the user to create estimates of DUL and CLL, based on the device’s electronic output, in units of meaningful measurement i.e. mm of available water. A beta version of this tool is available on request from the APSIM Initiative.
Infrared spectrometry: Visible–near infrared (vis NIR) spectroscopy shows potential for the rapid, accurate and inexpensive estimation of soil water, and potentially, PAWC. Models to accurately estimate water contents across the moisture characteristic curve (from wet to dry) have been developed, with the next phase being the development of methodology for the field estimation of soil water content and determination of PAWC. While the vision is to develop a field-based device for the rapid estimation of these parameters, the research is currently on hold.
Soil and Landscape Grid of Australia Facility: This activity, being led by CSIRO and in collaboration with government, state departments and universities aims to produce a comprehensive fine-resolution grid of soil attributes and important land surface parameters for the country (at a spatial resolution of 90 m). Information will be consistent with the developing Global Soils Map which has similar aims internationally and with the Australian Soil Resource Information System (ASRIS) which is the national repository for soil information. Outputs will include a coherent set of fine spatial resolution soil property maps for parameters including soil texture, carbon, bulk density and PAWC. While valuable across a range of industries, these data will be particularly useful in farm and crop management, particularly as input to simulation using Yield Prophet and APSIM. The first maps from this initiative are expected in 2014.
Future characterisation of soils in Australian cropping regions
Recent GRDC funding has allowed field-based soil characterisation to be continued. Opportunities exist for consultants and farmers from this region to engage with researchers to characterise locally important soils for PAWC and to participate in locally relevant analysis of crop production risk using simulation. Interest from consultants and farmer groups is invited. Information is available from Christian Roth (07 3833 5732; Christian.Roth@csiro.au) and Brett Cocks (07 4688 1580; Brett.Cocks@csiro.au).
3. Estimating seasonal water availability
The process described above (in 2.) allows the user to develop understanding on the capability of a soil to hold water for crop production (how large is the bucket). Armed with this information, it is now time to look at the options available to determine the amount of water in the bucket at a particular point in the season (described as the plant available water (PAW)).
It's horses for courses
A range of soil water monitoring devices was recently tested for their practical applicability in dryland systems on both the cracking clay soils (Vertosols) and the southern rigid soils (GRDC project, CSA00023-Doing it better, doing it smarter-measuring soil water in Australian agriculture). This study found that it really was horses for courses, with no one device or field based technology appropriate to all situations. In-situ capacitance or time-domain reflectometry (TDR) sensor probes were likely to provide a reasonable estimate of soil water in rigid soils, whereas in the shrink/swell clays, these faced difficulties because of soil cracking. The surface based, EM38 (Electromagnetic induction) mobile device was a more practical and accurate option for these soils. Soil water modelling (APSIM model) was also shown to adequately predict soil water levels when compared against the outputs of the above in-situ technologies and is recommended as an alternative to field based monitoring. It should be noted that sensor/device calibration is required with all of the electronic monitoring devices to ensure data sensibility and accuracy over the longer term.
When discussing soil monitoring technologies it is common to look towards the hi-tech end of the spectrum and to dismiss older technologies such as soil coring and push probing. Even with electronic technologies, the requirement for in-situ sensor calibration usually means that some form of soil coring is required. Also, routine coring for soil nutrient status provides the opportunity to develop knowledge of soil water status. This may range from the simple ‘touch and feel’ of soil moisture while soil coring for nutrients, to the calculation of gravimetric water content.
The value of information gained through the use of a push probe should also not be underestimated. While in its most basic mode it provides a simple estimate of the depth of wet soil (which may be sufficient information for many), there is the opportunity, through increased understanding of PAWC, to add value to the use of this tool. For example, characterisation of a soil for PAWC may indicate that a particular sand is able to hold 0.5 mm of water/cm of profile depth, while a clay is shown to hold 2mm/cm of depth. If push probing indicates that both soils are fully wet to 50cm, the sand contains 25mm of PAW while the clay holds 100mm, an important difference in terms of crop decision making.
How accurate is soil water monitoring?
There is a perception that it is possible to monitor field-scale soil water at high levels of accuracy. However, this is difficult to achieve using the currently available point scale technologies because of the inefficiencies associated with the monitoring process and the variable nature of Australian soils. One should also consider whether an absolute measure of soil moisture is necessary. Is knowing the PAW to an accuracy of +/-5 mm likely to change a management decision at the start of the season, or is it more likely that decisions will be based on differences in PAW of +/- 25 or even 50 mm?
In many ways this decision is taken out of the hands of the operator anyway. The level of spatial variability in soil moisture content, indicated during the field testing of monitoring devices (described above), was a major learning. Whilst it is understood that soils vary in texture and hence water holding, it came as a surprise to find high levels of spatial variability in gravimetric water content in what would generally be considered as homogenous soils i.e. Black Vertosol. Analysis of gravimetric sampling data (from an area of 420 m2) showed variability around the true mean of +/-15 mm water to a depth of 90 cm (at a confidence level of 95%). Whilst the mechanisms of such high variability are not fully understood, they are thought to relate to, a) the regular cracking of soils and the redistribution of surface soil through the profile as part of the shrink/swell process, b) the biasing of gravimetric sampling to particular parts of the soil landscape due to the necessity of sampling within soil peds, and c) random soil cracking around in-situ monitoring devices resulting in inaccurate measurement and high inter-device variability.
These findings have important implications for the placement of in-situ monitoring devices and the necessity for device replication if high levels of accuracy are required. In cracking soils, these findings lend support to the use of mobile, point scale devices such as the EM38 which allow rapid, multiple replications to be undertaken. However, this device in its current configuration, is not able to continuously log soil water nor operate effectively in saline soils.
Summarising the challenges
There are positives and negatives associated with all of the tested devices with no one likely to meet all requirements. By their very nature, in-situ devices or those that rely on an access tube, can only be located at one geographic point and yet are expected to adequately represent the moisture environment of a much larger area. If a high level of accuracy is required then the solution is to increase replication, but this brings additional capital and maintenance costs. Many in-situ devices provide the capacity for continuous logging, which to some will be the most important consideration. Others will see expediency in mobility and portability and an absence of physically located in-situ devices as being more important than continuous logging and could stick with the very simple e.g. push probe, or invest in a technology such as EM. Others will consider the simulation of water availability as being sufficiently accurate to make cropping decisions. The final decision will be up to the individual and will be based on their views on accuracy, the frequency and timeliness of information delivery, soil type and salinity level and the investment and continuing commitment required.
4. Management options to improve PAW and Water Use Efficiency
Summer weed management
Research undertaken by Central West Farming Systems and the NSW DPI, as part of the national WUE Initiative, unequivocally shows that summer weeds are costing growers dearly in terms of available soil water and nitrogen for subsequent crop production. An average increase of 60% in seasonal water use efficiency was found (across 21 trial sites-SA, Vic, NSW) where weeds were controlled during the summer fallow, a result of the improved efficiency of storage of summer rainfall and increased nitrogen supply to the subsequent crop. This resulted in an average return on investment of $5.57 for every dollar invested in summer weed control (Hunt, 2013).
|
Site (NSW) |
Year |
Subsequent crop |
Summer fallow rainfall (mm) |
Additional PAW pre-sowing (mm) |
Additional mineral N pre-sowing (kg/ha) |
Additional yield (t/ha) |
Yield of complete weed control (t/ha) |
Return on investment in weed control ($ received from $ invested) |
|---|---|---|---|---|---|---|---|---|
|
Waroo |
2008 |
Wheat |
358 |
56 |
25 |
1.0 |
2.6 |
12.00 |
|
Gunningbland |
2010 |
Wheat |
270 |
53 |
57 |
1.7 |
3.7 |
5.67 |
|
Gunningbland |
2011 |
Canola |
488 |
98 |
85 |
1.0 |
2.2 |
17.67 |
|
Tottenham |
2010 |
Wheat |
417 |
21 |
32 |
1.4 |
2.4 |
4.67 |
|
Rankin Springs |
2010 |
Wheat |
304 |
0 |
57 |
1.0 |
3.7 |
3.18 |
|
Rankin Springs |
2011 |
Wheat |
384 |
- |
- |
0.7 |
1.7 |
9.91 |
|
Rankin Springs |
2012 |
Wheat |
476 |
62 |
88 |
1.2 |
3.5 |
4.58 |
|
Condobolin |
2011 |
Wheat |
290 |
NA |
36 |
1.1 |
2.2 |
3.33 |
|
Condobolin |
2012 |
Wheat |
461 |
55 |
62 |
0.5 |
1.7 |
2.61 |
The impact of stubble cover on fallow efficiency
While the retention of stubble has significant benefits in the control of wind and water erosion and in improving water infiltration (particularly in high intensity rainfall events), WUE Initiative research indicates that stubble retention does not reduce seasonal evaporation levels when present in the quantities normally seen in dryland agriculture, and as a consequence, does not affect the quantity of water stored during the fallow nor on crop yield (Hunt, 2013). Northern region research supports these findings. Freebairn et al. (1987) showed that while stubble cover slowed evaporation for around 3 weeks following rainfall, there was no longer term benefit to soil moisture levels. It is important to remember however, that while stubble retention had no long term impact on soil water storage, slower evaporation rates under stubble, in the days immediately after a rainfall event, do provide a longer window of opportunity for crop planting, or where follow-up rainfall occurs, may result in an overall increase in stored soil water as the water is moved deeper into the profile.
The benefits of controlled traffic (CT)
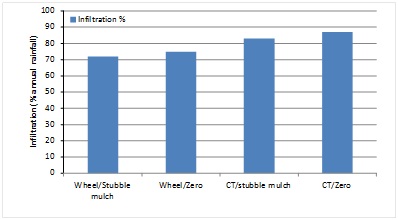
Operational efficiencies are generally the first reason that farmers give for converting to permanent traffic ways for broadacre crop production. However, the more subtle, longer term impacts of controlled traffic farming should not be overlooked. The benefits of CT in reducing soil compaction and the flow-on effects of increased infiltration and improved fallow efficiency are important benefits to the cropping system. Research undertaken by Tullberg et al. (2007) on the vertosol soils of the northern cropping region shows the impact of both stubble and CT on rates of run-off. The mean annual runoff where implements were not constrained to specific traffic ways was 44% higher than where CT was practiced. This equated to an additional 63mm of water being captured annually in a system where soil structure had not been affected by compaction. This study also showed the positive effects of zero tillage with a reduction in annual runoff of 38 mm under a zero till system compared to conventional stubble mulching. Infiltration efficiency, as a percentage of annual rainfall, varied between ~70% where tillage was not constrained to specific traffic ways, to almost 90% where CT and zero till were implemented (Figure 5).
Figure 5. Cumulative effect of wheeling and tillage on infiltration (as a % of annual rainfall) in southern Queensland (adapted from Tullberg et al.2007). Data are the mean of 6 years of annual infiltration/annual rainfall.
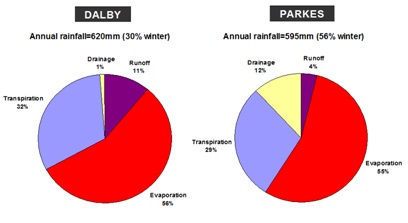
What is not considered in the above analysis is the impact of evaporation, which in Australian cropping regions, accounts for between 50 and 60% of annual precipitation (Keating et al. 2006; Freebairn et al. 2006). Figure 6 shows that after accounting for runoff, evaporation and drainage, the remaining section of the water balance pie, available to support crop production, is relatively low. There are no magic bullets to increasing the percentage of the pie available to drive crop production, however, the adoption of the range of management strategies discussed earlier will all contribute to improved water capture and retention.
Figure 6. Water balance for Parkes, NSW, (lighter textured soil with more winter dominant rainfall) and Dalby (clay textured soil with summer dominant rainfall). The Parkes soil could be considered to represent the lighter soils of central NSW and Dalby, the heavy clays (Keating et al 2006; Freebairn et al. 2006).
5. What is the relevance of better soil water knowledge for management
Using the NSW soils shown in Figure 2, what amount of soil water is likely to be stored during either a short or a long fallow and what impact might that have on farmer cropping and input decisions. Figure 7 shows soil water scenarios for the Nyngan Red Calcareous and the Spring Ridge Black Vertosol soils. Push probing on the 14th April indicated wet soil to either 30-40cm (Scenario 1) or 90 cm depth (Scenario 2) for both soils. These data were then converted to millimetres of available water using local soil characterisation information which showed that the Black Vertosol had more than double the water reserves of the Red Calcareous (Table 3). The growing of Baxter wheat was simulated (APSIM) with planting date triggered by the receipt of 15mm of rainfall over 3 days, between the 15th April and the 15th May. Simulations were run using the met records for Spring Ridge (1900-2012) and Nyngan (1900-2006![]() ).
).
|
Soil |
Depth of moist soil (cm) |
PAW (mm) |
|---|---|---|
|
Black Vertosol |
30-40 |
80 |
|
Black Vertosol |
90 |
160 |
|
Red Calcareous |
30-40 |
30 |
|
Red Calcareous |
90 |
70 |
Figure 7. Plant available water at time of sowing (April) for (a) a Red Calcareous at Nyngan holding 30 or 70 mm PAW and (b) a Black Vertosol at Spring Ridge holding 80 or 160mm PAW.
How likely is it to have these quantities of water in April?
Water storage depends on the length of the preceding fallow, seasonal rainfall and soil type. Simulation of water storage using the >100 year climate record shows that a short fallow from wheat (assuming a dry soil profile at harvest in November of the previous year) results in a 50% chance of at least 110mm (range of 0-300mm) of water being available for an April planting at Spring Ridge and 80mm (range of 0-180mm) at Nyngan (Figure 8). A long fallow, following a summer crop harvested in the preceding May (12 months to re-charge the profile), results in a 50% chance of having at least 160mm (range of 40-300mm) of planting water available at Spring Ridge and 90mm (range of 0-180mm) at Nyngan. This analysis indicates that a longer fallow on the Calcareous soil at Nyngan is more beneficial in drier years. In wetter years, as a result of the relatively small size of the water bucket, it is highly likely that the profile will recharge to near-capacity, even where a short fallow is practiced. In this case, deep drainage may be an issue. The Spring Ridge vertosol shows an obvious soil moisture advantage from long fallowing and it is likely that the wetting of this soil to depths >100 cm will only happen through long fallowing or through recharge from heavy rainfall while the soil is extensively cracked.
Soil water, stored as a result of early summer rainfall, which is surplus to the requirements of a maturing winter crop, may also contribute to subsequent fallow water storage. This resource has not been considered in this analysis and as a result water storage data should be considered as a conservative estimate.
Figure 8. Fallow water storage for a (a) Red Calcareous soil at Nyngan and a (b) Black Vertosol at Spring Ridge. Differences in median water storage are shown (dotted lines) for short (December to April) and long fallows (May to April).
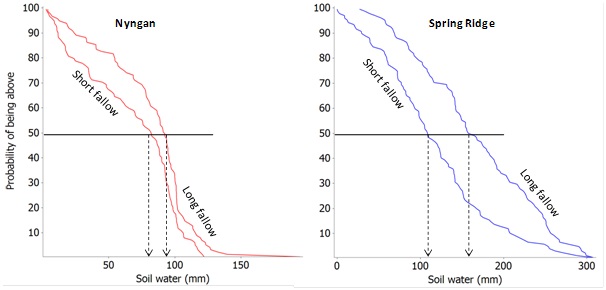
Figure 8 text description
Graph 1: Nyngan shows a decrease in short fallow probability of 100 to zero as the soil water increases from zero to approximately 125mm. Soil water is approximately 75mm when the probability is 50. The long fallow probability decreases from 100 to zero as the soil water increases from zero to approximately 150mm. Soil water is approximately 95mm when the probability is 50.
Graph 2: Spring Ridge shows a decrease in short fallow probability from 100 to zero as the soil water increases from zero to approximately 300mm. Soil water is approximately 110mm when the probability is 50. The long fallow probability decreases from 100 to zero as the soil water increases from zero to approximately 300mm. Soil water is approximately 160mm when the probability is 50.
How might the amount of stored water affect decision making?
The above simulation shows that by knowing something about a soil’s ability to store water can have impact on management. For example, knowing the storage capacity of a Red Calcareous soil may change thinking on fallow length, or knowing the capacity of a soil to hold water may change thinking on crop input investment e.g. fertiliser. This can be taken further through the use of Yield Prophet which provides the manager with a means of exploring the riskiness of cropping options (both production and economic) based on knowledge of the soil resources present (water and nutrients) and the long term climate information.
Figure 9. Simulation of the impact of rate of N application (N25 to 150) on wheat yield grown on a Red Calcareous soil at Nyngan with 30 mm (a) or 70 mm (b) PAW at the time of sowing in April.
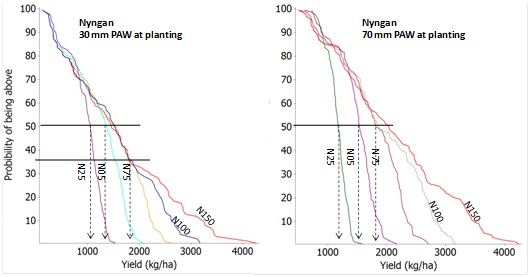
Figure 9 text description
Graph 1: Approximate results for 30mm PAW at planting are; for N25 the probability is 50 for a yield of 1000 kg/ha, for N50 the probability is 50 for a yeild of 1300 kg/ha, and for N75, N100 and N150 the probability is 50 for a yeild of 1800 kg/ha.
Graph 2: Approximate results for 70mm PAW at planting are; for N25 the probability is 50 for a yield of 1100 kg/ha, for N50 the probability is 50 for a yeild of 1500 kg/ha, and for N75 and N100 the probability is 50 for a yeild of almost 1800 kg/ha. For N150 the probability is 50 for a yield of 2000 kg/ha.
Figures 9 and 10 provide examples of the type of information available to managers to assess the riskiness of a particular decision. Soil characterisation shows that the Red Calcareous soil at Nyngan is unable to hold as much water as the vertosol at Spring Ridge; as a consequence yield potential is lower and the nitrogen fertiliser requirement less. Figure 9 (a) shows that the addition of more than 50 kg/ha of N (as urea) would be a waste of resources in 50-60% of years, where PAW at planting is low (30mm). However, even where starting soil water is low, there is still potential in the wettest 30% of years to improve yields through fertiliser application, although the economics of such a move would need to be evaluated. Figure 9 (b) shows that where 70mm PAW is present at planting, the potential for N fertiliser to impact on crop yield is greater. Simulation indicates that a rate of 75 kg/ha would contribute to increased yield in around 70% of years, and rates in excess of 75kg/ha are likely to continue to have impact on yield in the 50% of wetter seasons.
Figure 10. Simulation of the impact of rate of N application (N25 to 150) on wheat yield grown on a Black Vertosol soil at Spring Ridge with 80 mm (a) or 160 mm (b) PAW at the time of sowing in April.
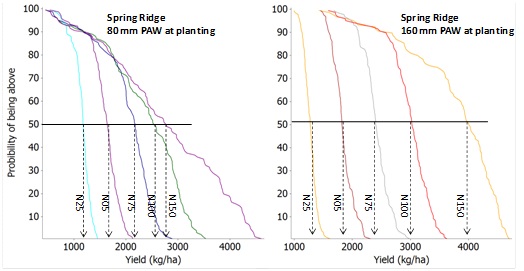
Figure 10 text description
Graph 1: Approximate results for 80mm PAW at planting are; for N25 the probability is 50 for a yield of 1100 kg/ha, for N50 the probability is 50 for a yeild of 1600 kg/ha, and for N75 the probability is 50 for a yield of 2100 kg/ha, for N100 the probability is 50 for a yield of 2600 kg/ha and for N150 the probability is 50 for a yield of almost 2800 kg/ha.
Graph 2: Approximate results for 1600mm PAW at planting are; for N25 the probability is 50 for a yield of 1400 kg/ha, for N50 the probability is 50 for a yeild of 1900 kg/ha, and for N75 the probability is 50 for a yield of 2400 kg/ha, for N100 the probability is 50 for a yield of 3000 kg/ha and for N150 the probability is 50 for a yield of almost 4000 kg/ha.
For the Black Vertosol at Spring Ridge, even in years where starting soil moisture is relatively low (80 mm) (Figure 10 (a)), the application of fertiliser at higher rates is likely to be beneficial. Rates of 75 kg/ha and higher will impact on yield in around 80% of years, with rates of 100 or even 150 kg/ha required to optimise yield in wetter years. Where the profile was wet to depth at planting (160 mm PAW) it can be seen from Figure 10 (b) that yields continue to increase in the majority of years as a response to better moisture conditions and to increasing rates of N fertiliser.
These analyses compare yield potential in response to PAWC, PAW, seasonal conditions and N application rate but do not compare the economics of production. It is highly probable that many of the discussed scenarios would not be economically feasible. It is up to the individual to decide the economics of any system based on their own circumstances but Yield Prophet is well placed to assist in the exploration of productive potential and the underlying economics.
6. Tying it all together
The above simulations of a single crop provide an example of the type of information available to assist farmers in navigating the complexity and riskiness of the dryland cropping system that they manage. However, to utilise this information to its maximum requires that a farmer knows the soil water status at critical seasonal decision points, particularly at crop planting and at fertiliser application or other important in-crop decision points. As can be seen, there are opportunities in wetter years to increase inputs to optimise available water resources, just as there are opportunities in drier years to ease off on inputs, but these decisions are only available to those who have access to the necessary information on which to make the decision. However, we have also seen that soil monitoring is only part of the story, best practice dictates an understanding of the characteristics of the soil and its limitations to enable the development of a realistic yield potential. It also means the optimising of water storage through good fallow management, leading to increased water use efficiency. It is not going to be the adoption of one or other of the technologies that will lead to reduced risk and improved economic sustainability but a more thoughtful approach to all of these aspects of crop production at whatever level of investment thought appropriate by the individual.
Contact details
Neal Dalgliesh
Ph: 0427 725955
Email: Neal.Dalgliesh@csiro.au
Christian Roth
Ph: 07 3833 5732
Email: Christian.Roth@csiro.au
CSIRO Ecosystem Sciences, Queensland.
Reviewed by
Yash Dang (DSITIA Qld)
Jeremy Whish (CSIRO)
References
Burk L. and Dalgliesh N. (2008) Estimating plant available water capacity. Grains Research and Development Corporation, Canberra. ISBN 978-1-875477-84-5.
Burk L. and Dalgliesh N. (2012) Soil Water Express – a system to generate approximate soil water characterisations and current soil water estimates from minimal input data. Proceedings of the 16th Australian Agronomy Conference 2012, October 14-18, 2012. University of New England, Armidale, NSW, Australia.
Freebairn, D.M., Hancock, N.H. and Lott, S.C. (1987), Soil evaporation studies using shallow weighing lysimeters: Techniques and preliminary results, Trans. Mech. Engn., Inst. Engn. Australia, Vol. ME12. pp 67-72.
Freebairn, D.M., Cornish, P.S., Anderson, W.K., Walker, S.R., Robinson, J.B. and Beswick, A.R. (2006) Management Systems in Climate Regions of the World – Australia. In ‘Dryland Agriculture’ 2nd edition, Agronomy Monograph 23. (American Society of Agronomy, Crop Science Society of America, Soil Science Society of America: Madison, Wisconsin USA.) Chapter 20: 837-878.
Hunt, J. (2013) Control summer weeds to reap yield benefits. Ground Cover Supplement-Water Use Efficiency, edited by J Paterson. Grains Research and Development Corporation, Canberra. March-April 2013. ISBN 1039-6217.
Keating, B.A., Gaydon, D., Huta, N.I., Probert, M.E., Verburg, K., Smith, C.J., Bond W. (2002) Use of modelling to explore the water balance of dryland farming systems in the Murray-Darling Basin, Australia European Journal of Agronomy 18 (2002) 159-169.
Kirkegaard, J. and Hunt, J. (2013) Short and long-term focus needed to lift WUE. Ground Cover Supplement-Water Use Efficiency, edited by J Paterson. Grains Research and Development Corporation, Canberra. March-April 2013. ISBN 1039-6217.
The State of Queensland (Department of Natural Resources and Water) (2007) Constraints to cropping soils in the northern grains region-a decision tree. (Qld NR&W publication)
Tullberg, J.N., Yule D.F. and McGarry D. (2007). Controlled traffic farming—from research to adoption in Australia. Soil and Tillage Research, Volume 97, Issue 2, December 2007, Pages 272–281
GRDC Project Code: CSP00170,