Victorian farmland values 2015 report
Author: Ag Answers (Rural Finance) | Date: 07 Sep 2016
Introduction
The value of land underpins farming businesses and rural communities. Understanding farmland values is important to everyone in agribusiness, especially Australia’s farmers.
The Ag Answers Australian Farmland Values 2015 report is based on actual farm sales since 1995 using data collected by the official government agency in each state and territory, which is then compiled by APM PriceFinder.
The analysis draws on more than 220,000 transactions over 20 years, accounting for 264 million hectares of land with a combined value of $124 billion.
The national median* farmland price increased by 5.3 per cent in 2015. This follows a 6.8 per cent increase in 2014 and a 2.2 per cent decrease in 2013.
The performance of farmland prices in different states was mixed in 2015. The median farmland price increased in Tasmania (+12.8%), Queensland (+3.3%), New South Wales (+10.2%) and Western Australia (+10.6%), but fell in Victoria (-2.3%), South Australia (-1.9%) and the Northern Territory (-6.4%) compared to the previous year.
In all states, the median price has trended higher over the past decade with average annual growth exceeding three per cent in most states. As inflation has run at 2.8% over the same period, this indicates real growth in farmland values. Although the median price has remained high over the past decade, the number of transactions** has trended lower.
Extend the investment horizon to 20 years and the farmland value growth picture becomes better still, with the median price in most states recording average annual growth above 5.5 per cent (Figure 1).
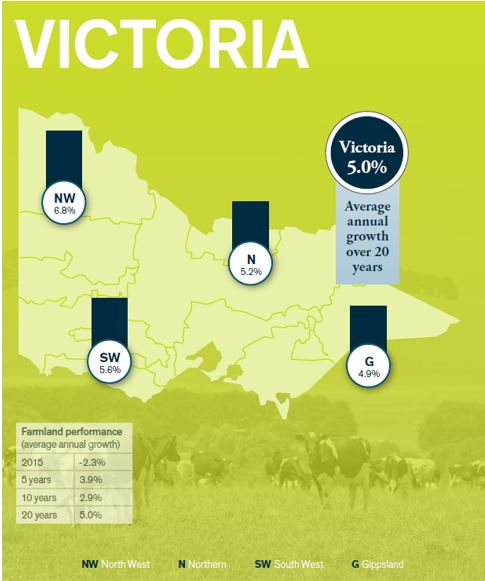
Figure 1: Farmland performance measured as growth in farmland prices for the different regions in Victoria.
About the research
Farmland prices are a function of many variables including, but not limited to rainfall, location, agricultural industry, productivity, land quality, sentiment, interest rates, commodity prices and the performance of the wider economy. To isolate the reason for a particular movement in the median price for a region is complex. Therefore, the focus of the report is to describe regional and state trends more so than the drivers behind the observed trends.
The report is a guide to the market value trends of commercial farming property and is not intended for use as a valuation tool. A qualified professional is required to assess the value of a property.
This analysis tracks the median price of commercial farmland in dollars per hectare by eliminating, where possible, metropolitan and small block sales, as well as sales where one party has compulsory powers. Further, small farms are excluded to limit the impact of ‘lifestyle farming’ on the results.
As property settlement periods vary, some 2015 sales will not be captured in this report at the time of publication. The median price for the most recent year is a preliminary one and will be revised at least annually.
The prices used in the report are based on the total sale price and therefore include the value of capital improvements. Growth in values may reflect an element of capital improvement on properties. Similarly, if water entitlements are attached to a land title and sold with the property the value of the water will be included in the sale price. If water entitlements are sold separately from the land, this value will not be captured in the sale price.
*The report uses medians to provide a measure of the mid-point of farmland prices as a guide to market activity. Compared with an average, the median is not as readily distorted by unusually high or low prices. Even so, in areas where there have been very few sales, the results should be viewed with caution as the year-on-year change in median price may not be indicative of an actual change in farmland value. A higher proportion of lower-priced sales can result in a lower median and vice-versa.
**Farmland sales volume is reported as the estimated number of transactions. Farms are sold as single or multiple lots, which obscures the view of the number of farms sold, particularly in cases where one farm is sold as multiple lots to multiple buyers. Accordingly, the ‘number of transactions’ should not be interpreted as the number of farms sold and should only be used as a guide to market activity.
State performance
In 2015, the median price of Victorian farmland decreased by 2.3 per cent. This comes after three consecutive years of positive growth.
There have been four distinct periods since 1995 in the median farmland price in Victoria (Figure 2 and Figure 3):
-
Values grew at an average of 2.4 per cent per year between 1995 and 2001.
-
A period of strong positive growth followed between 2002 and 2007, averaging 12.8 per cent per year.
-
2008 to 2011 saw a period of negative growth, averaging -2.9 per cent.
-
Between 2012 and 2015, average annual growth has been 5.7 per cent.
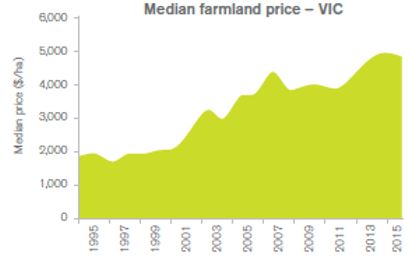
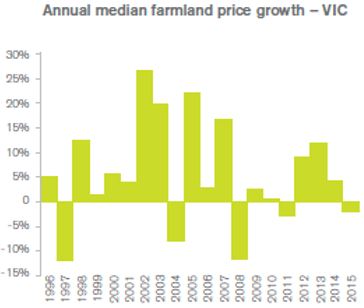
Figure 3: Annual median farmland price growth (%) for Victorian farmland from 1995 to 2015.
The number of transactions per year since 1995 can be grouped into three periods. 1995 to 1999 was a flat period, averaging 1,500 per year. 2000 to 2008 was a high activity period averaging 2,340 transactions per year. The current period from 2009 to 2015 was variable from year-to-year, averaging 1,810 (Figure 4).
The area of farmland traded in 2015 was 309,000 hectares, which is equivalent to approximately three per cent of farmland in Victoria.
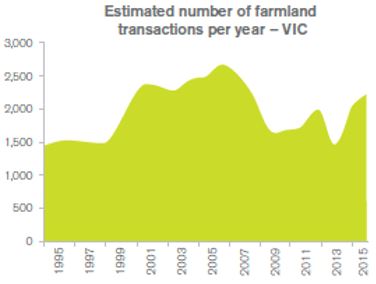
Figure 4: Estimated number of farmland transactions for Victorian farmland from 1995 to 2015.
The South West region of the state performed best in 2015 with a 1.5 per cent increase in median price compared to 2014. The region has also experienced an increasing trend in the number of transactions since 2013. In other regions of the state, performance was mixed; Northern Victoria (+0.4%), Gippsland (-3.1%) and North West Victoria (-4.2%) (Figure 5 and Table 1).
Farmland values are based on all farmland (including improvements), not just arable land.
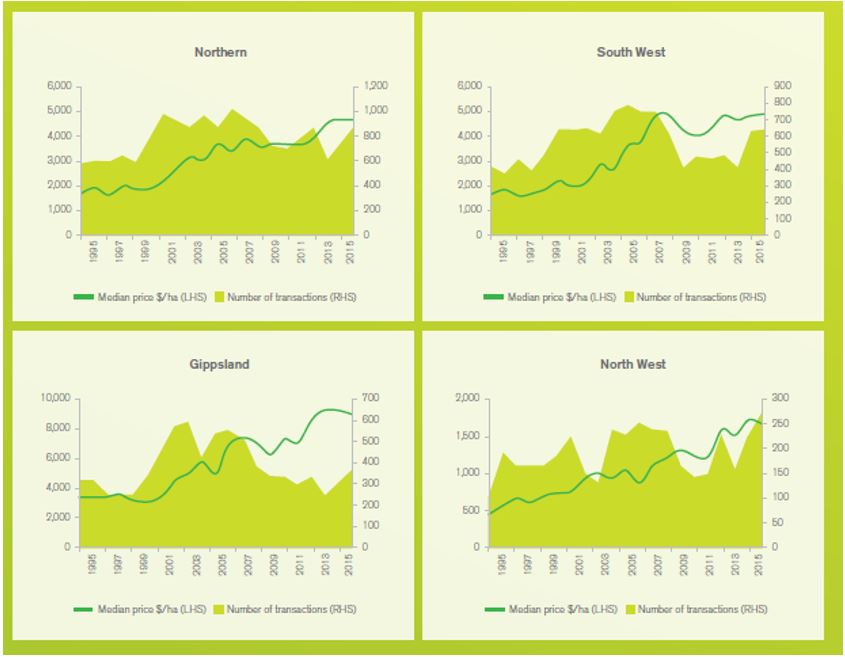
Figure 5: Farmland performance values for regions within Victoria.
Table 1: Farmland sales by municipality – Victoria.
| Municipality | Region | Median $/ha | Est. # of transactions 2015b | |
|---|---|---|---|---|
| 2015a | 3yr average | |||
| Alpine | Northern | 6,607 | 6,839 | 18 |
| Ararat | South West | 4,942 | 4,268 | 37 |
| Ballarat | South West | 7,241 | 4 | |
| Bass Coast | Gippsland | 10,826 | 11,432 | 15 |
| Baw | Gippsland | 14,650 | 13,230 | 50 |
| Benalla | Northern | 5,797 | 5,528 | 47 |
| Bendigo | Northern | 4,416 | 4,127 | 42 |
| Buloke | North West | 1,393 | 1,414 | 74 |
| Campaspe | Northern | 4,694 | 4,352 | 111 |
| Cardinia | Gippsland | 18,017 | 18,273 | 23 |
| Central Goldfields | South West | 1,800 | 2,562 | 11 |
| Colac - Otway | South West | 9,035 | 7,619 | 50 |
| Corangamite | South West | 8,613 | 7,643 | 72 |
| East Gippsland | Gippsland | 3,621 | 4,089 | 77 |
| Gannawarra | Northern | 1,976 | 2,091 | 64 |
| Glenelg | South West | 4,424 | 4,701 | 57 |
| Golden Plains | South West | 6,477 | 5,621 | 32 |
| Hepburn | South West | 7,399 | 7,843 | 24 |
| Hindmarsh | North West | 2,242 | 2,807 | 37 |
| Horsham | North West | 3,000 | 2,807 | 37 |
| Indigo | Northern | 6,393 | 6,289 | 45 |
| La Trobe | Gippsland | 8,754 | 8,142 | 19 |
| Loddon | Northern | 2,286 | 2,054 | 96 |
| Macedon Ranges | South West | 4,462 | 5,931 | 12 |
| Mansfield | Northern | 7,529 | 7,595 | 34 |
| Mildura | North West | 963 | 997 | 49 |
| Mitchell | Northern | 3,709 | 4,673 | 27 |
| Moira | Northern | 5,217 | 4,905 | 109 |
| Moorabool | South West | 8,384 | 8,050 | 27 |
| Mount Alexander | Northern | 6,379 | 5,632 | 16 |
| Moyne | South West | 6,407 | 7,377 | 88 |
| Murindindi | Northern | 6,911 | 6,042 | 42 |
| Northern Grampians | South West | 2,305 | 2,362 | 68 |
| Pyrenees | South West | 3,073 | 3,908 | 50 |
| Shepparton | Northern | 5,718 | 5,426 | 77 |
| South Gippsland | Gippsland | 11,884 | 11,245 | 99 |
| South Grampians | South West | 4,092 | 3,997 | 70 |
| Strathbogie | Northern | 4,543 | 4,632 | 74 |
| Surf Coast | South West | 9,621 | 7,808 | 7 |
| Swan Hill | North West | 1,469 | 1,393 | 22 |
| Towong | Northern | 2,791 | 4,299 | 32 |
| Wangaratta | Northern | 5,269 | 5,273 | 51 |
| Wellington | Gippsland | 7,647 | 8,403 | 97 |
| West Wimmera | South West | 2,474 | 2,260 | 59 |
| Wodonga | Northern | 10,201 | 2 | |
| Yarriambiack | North West | 2,253 | 2,100 | 43 |
| South West | 4,950 | 4,853 | 649 | |
| Gippsland | 9,138 | 9,325 | 379 | |
| Northern | 4,766 | 4,704 | 901 | |
| North West | 1,669 | 1,648 | 281 | |
aUse price information with a small volume of transactions with caution. The median price for municipalities with less than fiver sales in 2015 is notreported. bRefer ‘About the research’ section.
Conclusion
Victorian farmland has followed a positive growth trend since 1995. Farmland values continue to be resilient despite being subject to a range of factors, such as widespread drought, commodity prices and other external influences. At a local level, different factors came into play such as managed investment schemes in the South West, government intervention around water in irrigation areas, multiple industries competing for land in high rainfall zones and extreme localised weather events. Overall, farmland in Victoria has proved to be a solid investment achieving average annual growth of 5 per cent since 1995.
Contact details
Greg Kuchel
greg.kuchel@ruralfinance.com.au
Was this page helpful?
YOUR FEEDBACK