Paddock Practices: How does the price of phosphorus fertiliser influence net return in wheat?
Paddock Practices: How does the price of phosphorus fertiliser influence net return in wheat?
Date: 01 Dec 2021
Key messages for growers
- The level of yield response has a greater impact on economic returns than the cost of mono-ammonium phosphate (MAP).
- A wide range of P rates will achieve the same net return at most of the case studies here.
With global phosphorus (P) supply chain issues continuing and prices for fertiliser expected to stay high in 2022, decisions around P fertiliser application rate will have greater influence on the budgets of grain-producing businesses than usual next season.
Higher prices for P fertilisers have prompted growers to question whether they should reduce rates to maximise economic returns from applying P. The answer depends on the level of yield response to P per hectare that is expected.
A current Grains Research and Development Corporation (GRDC) investment is assessing how soil properties and climate can influence yield response to P fertiliser in wheat. This research is in progress, however, completed field trials provide an opportunity to examine some economic case studies.
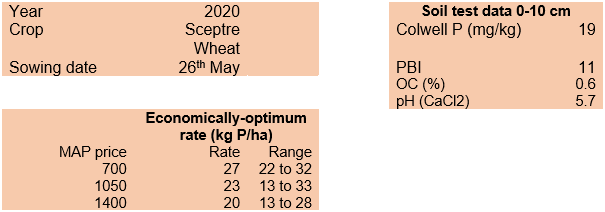
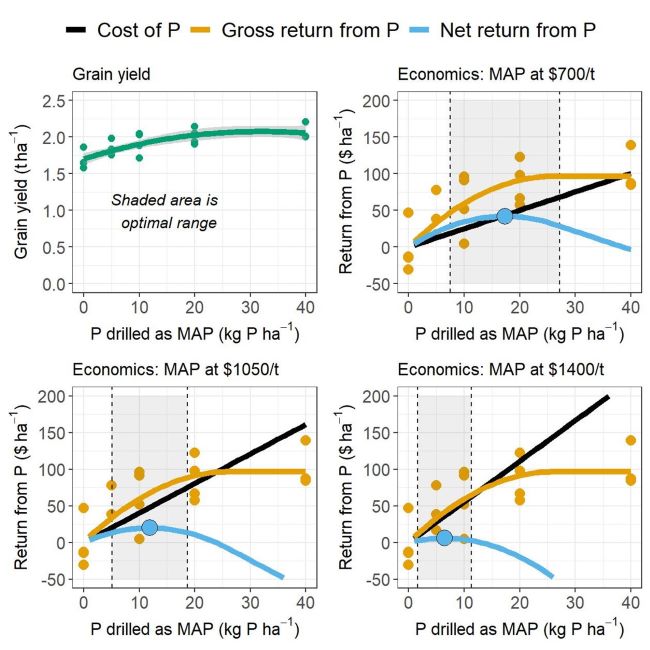
As part of this research, researchers are investigating what precision in P rates is required to maximise economic returns from P fertiliser. The calculations show the range of rates that maximise net return, referred to as the optimal range, shown below in Table 1
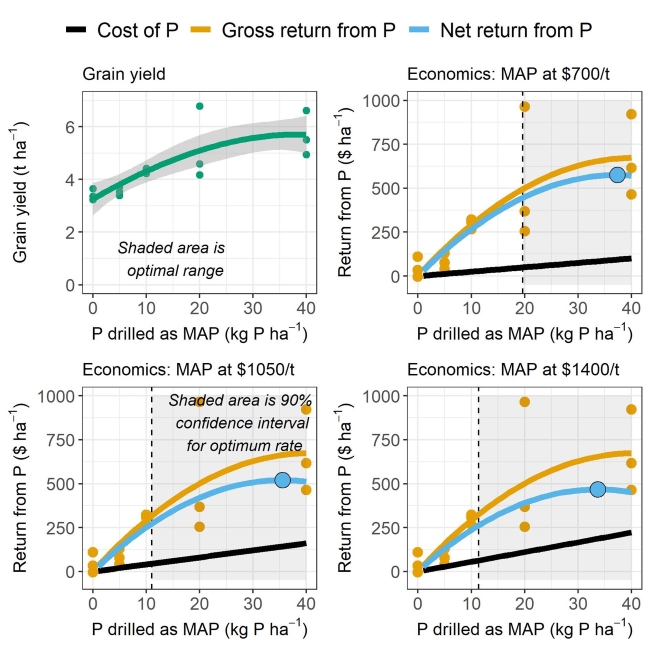
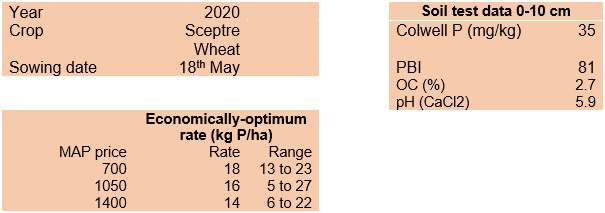
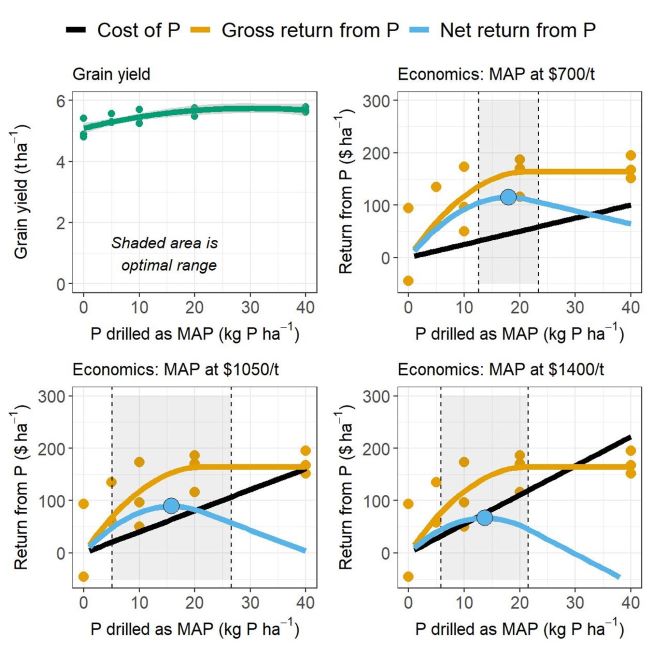
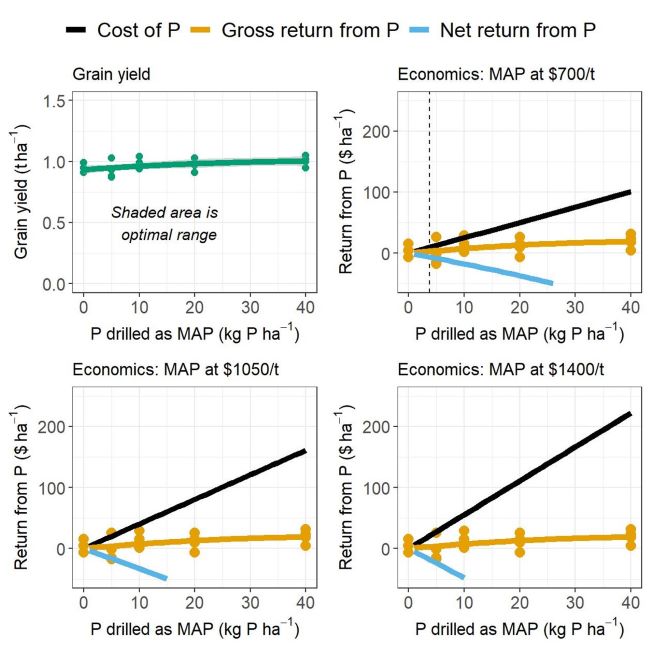
The impact of an increase in price for P fertiliser was assessed using three price scenarios for MAP: $700 per tonne (close to the five-year average), $1050 per tonne (1.5 x average) and $1400 per tonne (2 x average). The economic analysis was done for five sites that represent the range of responses observed, from very low to very high yield response to P. The price for wheat (allowing for delivery and levies) was set at its five-year average of $273/t.
The results show that the level of yield response to P has a greater influence on the optimal range than fertiliser price. For example, doubling the MAP price from $700/t to $1400/t shifted the optimal range from 20-55kg P/ha, to 11-56kg P/ha at Boyup Brook where a yield response of 2.27t/ha occurred. At Wandering, where a yield response to P of 0.65 t/ha occurred, the same increase in price shifted the optimal rate from 13-23kg P/ha to 6-22kg P/ha. The greatest shift in optimal range occurred at the Northam site, where a response to P of 0.38t/ha occurred; it decreased from 7-27kg P/ha to 2-11kg P/ha. At Tammin, where there was no significant yield response to P, the optimum rate was 0kg P/ha under all price scenarios.

The optimal range is quite wide in these cases studies as the rate-return relationship is flat across a wide range (see link for full details below). In fact, there is overlap in the optimal range for the three price scenarios. For example, at the Wandering site a P rate between 13 and 22 would fall within the optimal range for each price scenario.
The wide range of rates within the optimal range demonstrates that growers have flexibility to reduce financial risk without reducing profit. The optimal range at Boyup Brook and Brookton are above rates typically used in those areas – we’ll know more about how current practice compares to economic optimum when this research is complete. The optimal range at Tammin is unlikely to be used by growers; it’s more likely that growers will apply P at replacement rates in this scenario to maintain soil P fertility.
For more detail on the reduction in net return by applying P rates below the optimum range click here.
The field trials used as case studies here are from a series of trials where nitrogen, potassium and sulphur are applied to ensure only P is limiting. Adequate supply of nutrients other than P is important to capture economic benefit of applying P in your crops.
While these case studies provide an assessment of the sensitivity of the optimal range of rates to increases in MAP prices, they are not intended to provide recommendations. Soil testing for nutrients, in combination with assessing different price and yield scenarios are the best approach for determining the rate required for individual paddocks.
To see the full detail of the economic analysis for the case studies, click here.
This article was produced by the GRDC project ‘Increasing profit from N, P and K fertiliser inputs into the evolving cropping sequences in the Western Region’ (GRDC Project code: UWA1801-002RTX).
Field trials used for this work were established, funded and maintained by Summit Fertilizers and CSBP.
What do I lose by applying P rates below the optimum range?
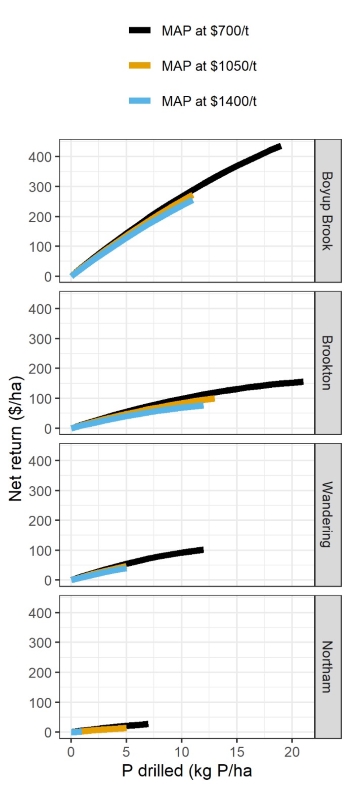
The economic impact of applying P rates below the optimum range is dependent on the yield response to P (Figure 1). The potential for lost income is greatest at the Boyup Brook site, followed by Brookton, Wandering and Northam.
At Boyup Brook, the average reduction in net return between 10 and 19 kg P ha is $19/ha per kg of P. At Brookton, the average reduction between 10 and 21 kg P/ha is $5/ha per kg of P. At Wandering, the average reduction between 0 and 12 kg P / ha is approximately $8/ha per kg of P. At Northam, the average reduction between 0 and 7 kg P / ha is approximately $4/ha per kg of P.
Case studies
Case study 1: Boyup Brook

Case Study 2: Brookton
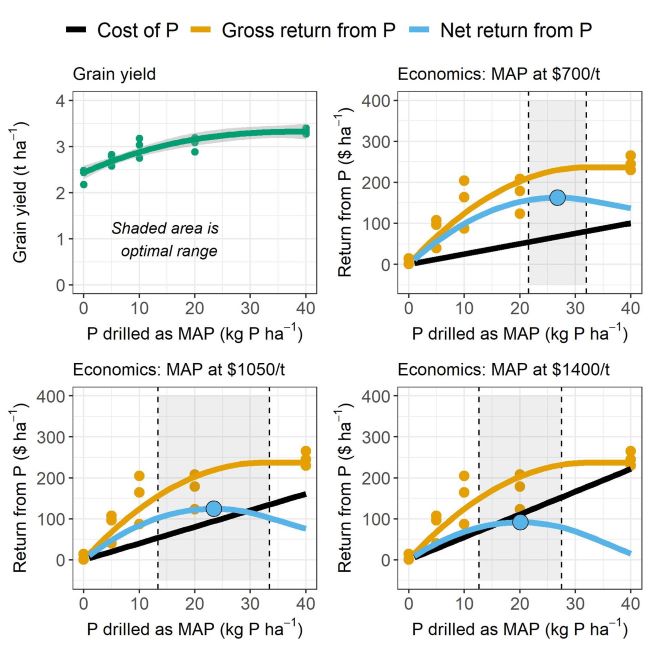
Case study 3: Wandering
Case study 4: Northam

Case study: Tammin
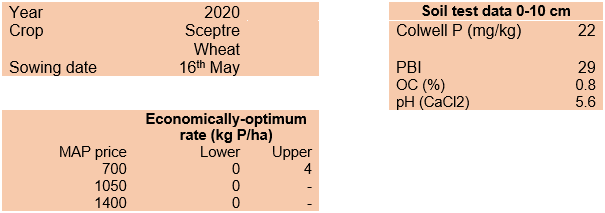
GRDC Project Code: UWA1801-002RTX,