The science of phosphorus nutrition: forms in the soil, plant uptake, and plant response
The science of phosphorus nutrition: forms in the soil, plant uptake, and plant response
| Date: 18 Feb 2009
THE SCIENCE OF PHOSPHORUS NUTRITION:
FORMS IN THE SOIL, PLANT UPTAKE, AND PLANT RESPONSE.
Neal Menzies, The University of Queensland, St Lucia
Key words
· You can not escape the theory, and you would not want to – it can provide you with a clear view through the mist of misleading claims unscrupulous salesmen may make.
This paper is intended to provide some of the background understanding of phosphorus (P) behaviour in soils and plants, that the following papers will assume that you understand. This material may look a lot like undergraduate soil science lecture notes – not surprising really as that is exactly where it comes from. Nevertheless, it is the basic understanding that our manipulation of P supply to crops depends on, and hence appropriate for undergraduate students, and as a refresher for more “established” agricultural scientists.
1.0 Phosphorus forms in soil
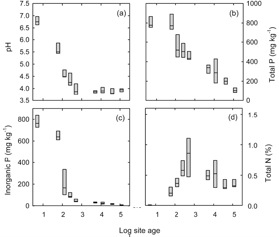
The P content of rocks is commonly between 500 and 1400 µg P/g, depending on the parent rock type. Of the igneous rocks basalts are usually at the upper end of this range, while granites and most sedimentary rocks are at the lower end. Above this range are rock phosphates, some limestones, and some basic volcanic lavas. Typical total P contents in soils range from 150 to 700 µg P/g (Wild 1988). Soils from very old landmasses, such as Australia and Africa, often contain low total P contents (see age relationship in Figure 1.1). In general, soils contain less P than the lithosphere as a whole. A reduction in the concentration of P occurs as rocks weather, probably because apatite dissolves and the P is lost, before the formation of Al and Fe oxide minerals which would adsorb the P.
Figure 1.1. The relationship between mineral soil properties and site age (years). Note that the total P in the soil, and the available fraction decrease with time. In contrast, the soil nitrogen store builds up initially, and is then is maintained through time (from Richardson et al 2004).
In soil profiles the P is usually concentrated near the soil surface. In undisturbed systems this is a result of cycling of P through the vegetation and its deposition on the soil surface, while in cultivated soils surface accumulation also results from the application of fertiliser.
In the following sections we will consider the P in soil as falling into one of three pools which differ in their availability to plants. These pools are the readily available P (soil solution), the pool of P that is rapidly released from the soil to replenish the soil solution (labile pool), and the relatively slowly available P (non-labile) (Figure 1.2)
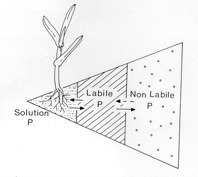
Figure 1.2. Schematic representation of the forms of phosphorus present in soil.
1.1 Soil solution P
Plants obtain their P from the soil solution in the form of H2PO4- and HPO42-, although plant uptake of HPO42- appears to be slower than uptake of H2PO4-. The ratio of these two forms is dictated by the pH (Figure 1.3), with H2PO4- dominant in acid solutions (pH < 7), and HPO42- dominant in alkaline solutions. It is important to note that these ions are negatively charged (anions), so the plant will need a different mechanism to take up P, than the one used for cations uptake. In addition to inorganic phosphate ions, in most soils a substantial proportion of the soil solution P is present as soluble organic-P compounds. However, it is unclear whether these forms contribute significantly to plant nutrition.
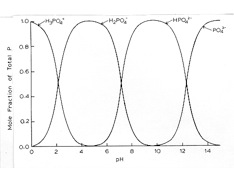
Figure 1.3 (right) The effect of pH on the form of orthophosphate present in solution.
The concentration of P in soil solution is typically low. In unfertilized soils from northern Australia the concentration is typically below 2 µM (Menzies et al1994), while even in highly fertilized soils the P concentration is typically below 20 µM. At any instant, the amount of P in soil solution is only a small fraction of an ecosystem or crops annual requirement. Thus an important aspect of a soils P status is its ability to replenish the soil solution following plant P uptake. This short term replenishment is generally the result of the desorption of specifically adsorbed P, though dissolution of P minerals may be a contributor in young soils and in soils that have been highly fertilised.
In surface horizons of most soils, P also occurs in organic forms in amounts that can vary widely (from 20% to 90% of the total P). Mineralisation / immobilisation processes occur with organic P in a manner generally analogous to nitrogen (N) and sulphur (S) but have been much less studied. A difficulty in the measurement of mineralised P is that it immediately reacts with inorganic soil constituents (i.e. PO4 released during mineralisation will be adsorbed by the soil rather than remaining in solution as mineralised N would. Thus, it is difficult to determine how much P has been released). Incubation experiments have shown that as the organic P decreases it is matched by an equivalent increase in acid extractable P (adsorbed and soluble P).
The microbial biomass represents a small but labile pool of soil P, mainly in the form of RNA and DNA, polyphosphates and phospholipids, with minor amounts of other P containing cell biochemicals like adenosine phosphates. Measurement of the microbial biomass P is an essential prerequisite for assessing its role in the P cycle, and its effect on plant nutrition. Until very recently, estimates of microbial P have had to be made from measurements of microbial biomass and literature values for P contents of laboratory cultured microorganisms. However, the P content of organisms can vary widely depending on growth conditions. New methods of measuring microbial P have been developed, based on the widely used chloroform-fumigation procedure for measuring soil microbial biomass; the P released from microbial cells following lysis with chloroform is extracted from the soil with NaHCO3.
Although difficult to measure, estimates of the comparative efficiencies of P uptake from soil by microorganisms and plant roots have indicated that microorganisms, and in particular bacteria, have very efficient P uptake mechanisms (Table 1.1). Competition for the small amounts of P in the soil solution is most intense in the rhizosphere, where substrates from root exudates, sloughed off root cells, tissues and mucigels sustain a larger and more active microbial population than in the bulk soil.
|
|
Estimated fresh weight of biomass in the surface 10cma (g/m2)
|
Calculated Pi uptake rate at background conc of 10 µMb (µmol P/min)
|
Ratio of uptake relative to plant roots |
|
Bacteria
|
103
|
359
|
9.0
|
|
Fungi
|
260
|
71
|
1.8
|
|
Plant roots
|
5000
|
40
|
1.0
|
|
a Bacterial and fungal biomass based on Clark and Paul assuming a dw/fw ratio of 0.2. Root biomass based on a value of 50 cm-2 for root length per unit volume and a conversion foacto of I mg fw cm-1 root length. |
|||
|
b Calculated assuming all fungi behave like A. nidulans, bacteria like E. coli, and plant roots like millet. |
|||
While organic P may be taken up directly by plants (e.g. as phospholipids or nucleic acids; McKercher and Tollefson 1978, Can. J. Soil Sci. 58, 103-105), there is general agreement that organic P must first bemineralised, through the action of extracellular phosphatases, prior to uptake. Phosphatase activity is usually highest when soil solution P concentration is low, because phosphatases are adaptive enzymes produced in response to a need for P by soil microorganisms and plant roots. Higher phosphatase activities are also usually found in the rhizosphere compared to non-rhizosphere soil because of the higher microbial populations and the presence of plant root phosphatases. As well as production of extracellular phosphatases, plants have developed other strategies, such as root branching, root hairs, and symbiotic relationships with mycorrhizal fungi to enable a large volume of soil to be exploited. Mycorrhizal fungi in particular perform an important function in improving the P nutrition of plants by taking up P from a larger volume of soil than is possible for uninfected plants. Mycorrhizal fungi can also mineralize organic P.
The rate of mineralisation of organic P, rather than its total amount, is the main factor determining the availability of organic P to plants. Measurements of mineralisation rates have been made by monitoring the change with time of inorganic P or organic P in soil after incubation; generally only net effects are measured unless radio-isotopes are used. The balance between mineralisation and immobilisation is controlled by the population dynamics and activities of microorganisms, thus environmental factors have been shown to affect M/I processes. This also occurs for N and S.
Temperature: The balance between mineralisation and immobilisation of P in soil is strongly influenced by temperature. High organic P mineralisation rates ore observed above 30°C, coinciding with optimum temperatures for growth of many bacteria. However, soil phosphatases apparently have optimum temperatures around 45°C, so the extracellular phosphatases may make a contribution to mineralization processes at higher soil temperatures. At temperatures below 30°C, immobilisation is increasingly favoured, with cold-tolerant species like yeasts playing a more important role.
Moisture: Effects mineralisation in the same way as is well recognised for N, with processes slowing as water becomes limiting. Desiccation of soil results in the release of significant amounts of both inorganic and organic P from dead microbial cells and plant tissues, as well as organic P leaked from still viable microbial cells. When soil is rewetted after desiccation, P in the assortment of cell debris and root tissues, and discrete inorganic and organic P, should rapidly re-enter the P cycle to be utilised by microorganisms and plants, and adsorbed by soil colloids. Peaks in bacterial populations occur soon after rainfall, indicating that the available substrates that accumulated during the preceding dry period are rapidly being utilised, and P and other plant nutrients immobilised in fresh microbial tissue. Wetting and drying cycles greatly stimulate the mineralisation of organic matter; the effect on organic P is greater than that on carbon (C) or N. In laboratory incubation experiments, repetition of cycles eventually lead to the complete mineralisation of organic P, but only partial mineralisation of organic C and N.
pH: As for organic matter in general, soil organic P is less stable in neutral and alkaline than in acid soils because the diversity and activities of soil organisms decline with increasing acidity. Addition of lime to acid soils usually, but not invariably, enhances the release of P from organic matter, by encouraging microbial activity and increasing rates of C, N and S mineralization. Soil pH may not be a reliable index of the availability to plants of the organic P in the rhizosphere, as pH at the root surface can differ from that in the bulk soil by as much as 1 or 2 pH units. For example, Hedley et al. (1982, New Phytologist 91, 45-56) demonstrated that no P was supplied by hydrolysis of organic matter in the rhizosphere of rape plants growing in a P deficient soil, despite a marked increase in activity of soil phosphatase. Instead, the H+ released by roots caused a sharp pH drop of 2.4 units, this caused dissolution of inorganic P meeting the plants demands. Soil pH then, provides only a rough guide to the likelihood of P being released to plants from mineralization of organic matter.
The C, N and S contents of organic matter in most soils are correlated, whereas the P content can vary widely. Consequently, the various attempts at using critical C:P ratios of organic matter and plant material to indicate the balance point between net mineralization and net immobilization have, with few exceptions, been unsuccessful. Critical C:P ratios can range from <100 for soils well supplied with P to over 200 for P deficient soils. Although ratios of over 300 usually indicate net immobilization, these can vary from site to site. A very wide range of C:P ratios, from <1 to >1000 is theoretically possible for soil organic matter, depending on its chemical composition and the amount of inorganic P associated through cation bridging with humic substances. Phosphorus concentration in plant organic material of about 0.2%.
The long term decline in organic P resulting from cultivation may be less than that for organic matter as a whole. Thus, Williams and Lipsett (1961) found that 50-60 years of wheat cultivation in NSW resulted in a loss of 30% of organic C but only 17% organic P. In natural soils the extent of net immobilization of P in organic matter and probably soil organic matter levels may often be set by the P supply in the parent material.
Apatite is the most commonly occurring primary P mineral in the sand fraction of soils, especially in fairly young soils that are not acidic. However, because of its relatively low solubility, and low rate of dissolution it has little importance in terms P supply to plants in these soils (note that apatite minerals, rock phosphate, can be an effective fertiliser material in acidic soils). Plumbogummite minerals, which are aluminium-phosphate minerals containing Pb, Sr, Ca, Ba and Ce occur in the fine silt and clay fractions of soil Australian soils, but they are of low solubility and hence of no direct significance to plant nutrition. Phosphate can also be present as Al and Fe phosphate minerals, either as pure phases, or more commonly co-precipitated with Al and Fe oxy-hydroxide minerals. All of these forms are considered non-labile, and in the short to medium term make no substantive contribution to plant nutrition. In recently fertilized, or very highly fertilized soils, secondary precipitates of metasTable mineral may be present. These are considered in a subsequent section.
The labile inorganic P in soils is predominantly present as specifically adsorbed orthophosphate. This P is in equilibrium with the soil solution, and acts to buffer the soil solution against concentration change. Thus P is desorbed into solution in response to plant P uptake, or adsorbed from solution when the P concentration is raised by mineralization or the addition of a fertiliser material.
The main forms used are the superphosphates (ordinary 9% P, double 16% P, triple 19% P) and where N and P are required MAP (NH4H2PO4) and DAP (NH4)2HPO4 with 26 and 21% P.
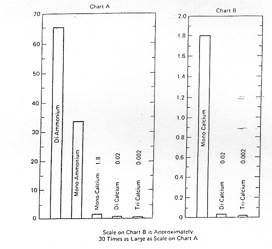
Figure 1.4 The relative solubility of commonly used phosphorus fertiliser materials.
A feature of the commonly used P fertiliser forms is the wide range of solubility as shown in Figure 1.4. These forms have been developed to provide adequate solubility and hence plant availability, MCP being quite adequate in this regard. Rock phosphate, even when finely ground, typically does not supply P fast enough for the needs of intensive agriculture. Its solubility is markedly affected by soil pH (Figure 1.5) so that in alkaline soils its availability is very low. It has value as a slow-release form in acidic soils e.g. for pastures but its effectiveness is slowed unless the climate is relatively wet. This low solubility / availability is in part offset by its lower cost. Note that the solubility of rock phosphates varies widely depending on the extent of CO3 substitution within the mineral.
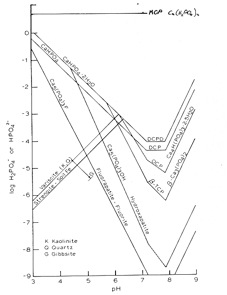
Figure 1.5 The solubility of a range of phosphorus minerals occurring in soils (and of the fertiliser material mono calcium phosphate ) (after Lindsay 1979). In graphs of this type, the lowest line represents the mineral of the lowest solubility. Note that the y-axis scale is a log scale – each unit change represents an order of magnitude change.
When soluble P fertiliser is added to the soil (note how high on the graph the MCP line is) the P concentration is increased, then drops quickly due mainly to a variety of reactions with inorganic soil components and to biological uptake.
When a water-soluble P compound such as MCP contacts moist soil, water vapour moves into the fertiliser from the soil and forms an almost saturated solution. For MCP the pH may be 1-2 (alkaline for DAP) with very high solution concentrations e.g. Ca 1.08 M, P 4.03 M, Fe 187 mM, Al 395 mM and Mn 12.7 mM in one study. As the solution becomes supersaturated a range of phosphates will form, especially those of FeAl and Ca. The particular crystalline phosphates formed are relatively soluble and mostly unsTable under normal soil conditions. As the P concentration in the soil solution decreases due to diffusion of the soluble P outward into the surrounding soil, the crystalline phosphates formed initially will either dissolve or alter to less soluble, more sTable forms. The P diffusing outward will react with virtually all the common colloidal soil mineral constituents except quartz. The soil components involved and the nature of the reactions are summarized in the notes from Norrish and Rosser (1983). In acid soils they suggest that the Al reaction may be more important than that with Fe whereas `native' secondary P is more closely associated with Fe.

Figure 1.6 Changes in the solubilities of iron and phosphate in six acid soils during an 18 month period following the addition of 220 mg/g of phosphorus as monocalcium phosphate (MCP) relative to known minerals. Note that immediate following fertiliser addition the system has a soil solution phosphate concentration comparable to that supported by the dissolution of strengite. Over time the concentration of phosphate in solution decreases, such that at 18 months the soil solution is undersaturated with respect to strengite. This data suggests that the initial reaction product of fertiliser addition was the mineral strengite, but that over a period of 18 months all of this mineral has redissolved.
There are major problems in the identification of the sTable crystalline products formed (mainly Ca Al and Fe phosphates) or even of deciding if P is held by adsorption or precipitation. Although initial crystalline products formed may be relatively soluble and hence available there is doubt as to the significance of crystalline products with long-term stability as contributors to the labile P pool. On the other hand they are thought to make a major contribution to the less available `native' P and to the `fixed' P.
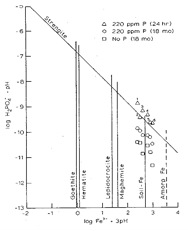
Figure 1.7 Changes in the solubilities of aluminium and phosphate in soil following the addition of 220 mg/g of monocalcium phosphate (MCP) relative to known minerals. Note that immediately following the addition of the fertiliser, the system is over saturated with respect to variscite (the data points represent higher concentrations than are supported by the dissolution of the mineral). Over time the concentration in solution drops to values close to the mineral solubility.
In combination, the data in these two figures implies that the fertiliser P initially dissolves and reprecipitates as strengite, but that this mineral is more soluble than variscite and so dissolves while variscite precipitates. Note that this sequence will not occur in all soils, but will depend on the relative concentrations of Fe and Al in solution.
Adsorption of P onto mineral colloid surfaces seems to be the main reaction responsible for the removal of P at low concentration from the soil solution after P fertiliser addition and desorption the main reaction responsible for soil solution replenishment following plant uptake i.e. the labile P following P fertilisation is mostly adsorbed P.
The soil reaction is initially fast but there is a later slower reaction with little evidence for equilibrium even with long times (years). The nature of the slower reaction is not clear. A stronger double bonding reaction may occur but some workers e.g. Barrow (1984) postulate a slow diffusion of the adsorbed P into the surface of the adsorbing material, others argue that this movement into the mineral is a result of P moving further into cracks and voids in the mineral.. With time the depth of penetration increases and return to the soil surface for possible desorption is slowed and availability hence reduced. Thus the slow reaction may in time be part of the fixation reaction along with precipitation and occlusion. Together these reaction result in a gradual decrease in the availability of P to plants (Figure 1.8)
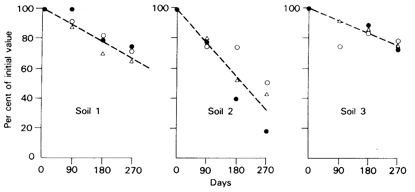
Figure 1.8 Decrease in labile phosphate in three soils from Brazil after reaction periods of 90, 180, and 270 days. Labile P is expressed as a proportion of the value found after a reaction period of o days, measured as P uptake by sorghum plants (●), P extracted by anion exchange resin (○), and as isotopically exchangeable P (△).
Biological uptake and release may be a significant process affecting availability as discussed earlier. Organic matter may have a significant effect on mineral adsorption since soluble humic material may block inorganic adsorption sites. Thus in the surface of soils where inorganic adsorption is very strong the reaction is reduced and P availability may be significantly higher than in the subsoil.
Often characterised by sorption isotherms e.g. Freundlich, Langmuir etc in which P in solution is plotted against that sorbed, adsorption being not necessarily the only reaction. Such isotherms are useful for predicting solution P values e.g. for modelling P movement in soils.
Single value comparisons between soils can be made by comparing sorption up to values in solution thought critical for plants e.g. 0.2 mg/L in Table 1.2 and Table 1.3, to the adsorption maxima (Table 1.2) or by calculating the phosphate buffer capacity (PBC) as in Table 1.3, a typical Q/l relationship. Note the very wide range in values for different soils and the much higher values for more highly weathered soils due to the presence of active Al and Fe. The surface-subsoil contrast is very clear in Table 1.2 presumably due to lower organic matter in the subsoil and in some cases more acidity and more inorganic material with reactive features.
There is not as much data on desorption as there is for sorption. Desorption typically shows hysteresis effects due to the variety of reactions involved with varying reversibility. It would seem preferable to use desorption for estimation of PBC and sometimes this is done (see Peaslee and Phillips 1970).

Table 1.2 Phosphorus fixation and the amount needed to maintain 0.2 mg P/L in soil solution on a “weathering transect” in Oahu, Hawaii (Sanchez 1976).
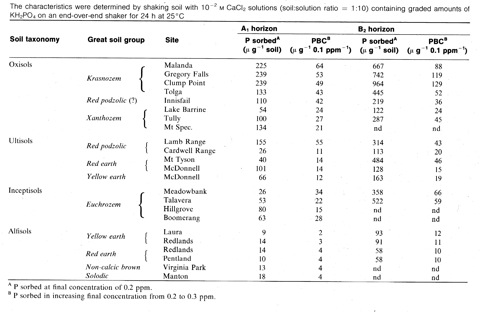
Table 1.3 Phosphate sorption characteristics for some tropical Queensland soils (Probert 1983)
Crop uptake of fertiliser P is usually only a small fraction of that applied to the soil (10-20% in the first year) due to the various soil reactions affecting availability. Thus the subsequent availability of the unused fertiliser P is an important question in determining later fertiliser needs. For example Devine et al. (1968) found on 4 soils after 1 year the mean availability of residual fertiliser P was 58% of fresh fertiliser P (superphosphate) and after 3 years 20%. See also Figure 1.9 where at 2 and 3 years relative effectiveness at 1 year was 40% and at 4-6 years 20%. Clearly there will be major differences here between soils depending on their reactivity with P.
Modelling of this decline is important since it allows prediction of maintenance fertiliser needs e.g. the DECIDE model of Bowden and Bennett (1974) in W.A. Barrow (1980) found for non-calcareous soils the relationship
x = acb1 tb2
where x is the P sorbed (mg P g-1 soil), c is the solution concentration (mg P ml-1), t the time in days and a b1 and b2 coefficients. This is a modified Freundlich relationship in which the value of b2 gives information on the slow reaction. A low b2 means that the reaction slows quickly and the residual value tends to be high whereas a high b2 means that the reaction persists without much slowing (at a value of 1 the rate would be linear) and the residual value tends to be low. The b2 value and initial sorption may not be related.

Figure 1.9 The relative availability of superphosphate and a low solubility P fertiliser (QRP) over several years. Availability is expresses relative to freshly applied superphosphate (RE = relative availability).
Phosphorus fertiliser is normally applied to Australian soils either to the surface or in the top 15 cm. In this region levels of organic and mineral colloid, Al Fe Ca and pH are usually such that the initial sorption reaction is low to moderate e.g. for red brown earths, grey and brown clays etc. Residual availability is also moderate, although variable depending on b2 values. Leaching is usually very low and even if leached from the soil surface subsoil retention will occur because of higher sorption (Table 1.3). Where P fertiliser has been applied each year for a long period residual P may build up to a level where the soil is no longer responsive. For cereal crops in some south Australian soils this situation may be reached after adding 200-300 kg P ha-1 usually as superphosphate.
In a few Australian soils, mainly the podzols, sandy podzolics and siliceous sands, initial sorption is very low and b2 also low giving high residual availability. Toxicity may occur and also leaching so that regular low inputs may be best. In another small group of soils especially the krasnozems, xanthozems and some podzolic subsoils (Table 1.3) active Al and Fe is high and pH low giving high initial sorption, high b2 values and low residual availability i.e. significant fixation. In such soils P may need to be applied at a higher rate and more often, usually for each crop. The most common management practice to alleviate this problem is that of banding (Uehara and Gillman 1981 discuss this and other alternatives). In the band the solution P level may rise above that needed for the species whereas if broadcast it will not. After harvest the soil is usually cultivated which spreads the band through the soil mass and a further banded application is needed for the next crop. If enough P is added sorption will decrease due to P occupying the sites of strongest reaction. Restriction of rooting volume with banding (roots staying in the high P zone) can sometimes be a problem. Liming and calcium silicate (cement) can also alleviate the problem.

Figure 1.10 The effect of sequential applications of P fertiliser on the relative yield of crops. Note that the yield with no fertiliser P added (intercept value) decreases with each sequential crop – P is being removed form the soil leaving less for the subsequent crop. The application required to achieve the maximum yield decreases with increasing crop number. This is the result of the cumulative residual effect of previous fertiliser applications.
2.1 Plant Nutrient Acquisition
Plants take up nutrients almost entirely as inorganic forms via the roots. The limited exceptions are foliar uptake of carbon dioxide, oxygen and sulphur dioxide – foliar uptake of other nutrients is limited (except in the instance of foliar fertilisation). As most plant nutrients enter the plant through the root, its worth us spending a little time considering the morphology of roots, and the nutrient uptake processes.
First, a refresher in basic root morphology! Viewed as a cross section, roots can be subdivided into an epidermis, cortex, endodermis and stele (Figure 2.1 and 2.2). The stele contains the xylem through which ions are translocated to the shoots, and the phloem through which photosynthate is supplied to the roots. Nutrient moving through the root pass through the epidermis, cortex and endodermis into the xylem of the stele. Each plant cell has a cell wall (composed largely of cellulose and hemicellulose) which is permeable to water and ions. Inside the cell wall is the plasma membrane, and this acts as a barrier to the passive movement of water and nutrients into the cell.
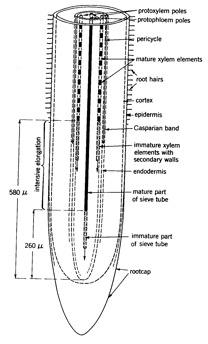
Figure 2.1. Schematic representation of the internal structure of the root tip of pea (from Tinker and Nye 2000).
Roots elongate through the soil through continued cell division in the meristematic zone, and elongation of cells immediately behind this region (figure 2.1). In the elongation zone, the cells are immature, and the root structure incomplete. In this zone, it is possible for water (soil solution), and the elements that it contains, to freely diffuse to the centre of the root and enter the transpiration stream of the xylem. Thus in this section of the root, it is possible for nutrients to enter the transpiration stream readily without passing through the plasma membrane – movement occurring in the plant cell walls. Water uptake rate is high in this zone (Figure 2.3). The cell walls are referred to as the apoplast, and route of movement is referred to as apoplastic pathway. This pathway is the primary means by which calcium is taken up by plants.
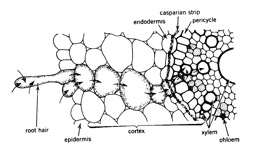
Figure 2.2 Cross section of cells and tissues involved in ion adsorption. Arrows indicate the direction of ion movement through a selected series of cells. (from Barber 1995)
As the root matures, the casparian strip develops – this is a suberised band around the endodermal cells which acts as a barrier to movement through the cell wall. Once developed, the Casperian strip ensures that water and ions moving into the root must pass through the plasma membrane, bring nutrient uptake under the metabolic control of the plant. Once within the cell, movement of nutrients between the cytoplasm of adjoining cells is facilitated by plasmadesmata. The cytoplasm and plasmodesmata which form a route by which nutrients move though the root are called the symplasmic pathway. Symplastic uptake is the primary means of potassium and phosphorus supply to plants.
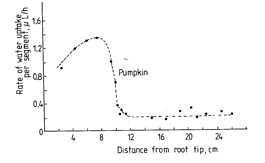
Figure 2.3. The rate of water uptake at various distances behind the root apex of pumpkin (from Mengel and Kirkby 2001).

Figure 2.4. Schematic representation of water movement toward the xylem in (A) unsuberized root tip where apoplastic, and symplastic are possible and (B) following the development of the casparian strip where only symplastic uptake is possible.
The root systems of plants vary widely with environment and species. Differences include the pattern of rooting (spatial arrangement), the size of individual roots (diameter, length), and the extent of root hair formation. Root hairs are extensions of the epidermal cells arising in the zone of root behind (older than) the meristem and elongation zone. Root hairs may persist for days or weeks, so they are present along much of the root. We will consider the importance of root hairs in nutrient uptake in some detail for phosphorus in a later lecture.
The movement of ions into roots has been researched in considerable detail, and is well covered in Marschner (1995). For this paper we will briefly review the main aspects of ion-influx kinetics. Three types of ion-influx kinetics have been recognised:
- passive ion movement into the plant (independent of respiration energy)
- passive uptake along an electrochemical gradient (charge) dependent on respiration energy
- active ion uptake against an electrochemical gradient requiring respiration energy.
The importance of respiration energy can readily be investigated at low temperature, or using a chemical respiration inhibitor.
An important aspect of active uptake is that it is selective – ions are not simply absorbed according to their ratios in solution. Plants actively absorb P ions from the soil solution; this is clearly demonstrated by the concentration gradient of 100 to 1000 fold which exists from the low levels in soil solution to the high concentrations in the root cells and xylem sap. Active uptake rate typically does not increase as a simple response to increase in concentration in solution.
Mass flow is the movement of nutrients through the soil to the root in the convective flow of water caused by plant water absorption to meet transpiration demand. The amount of nutrient reaching the root by mass flow is related to the volume of water transpired by the plant per unit growth, and the concentration of the nutrient in the soil solution. The significance of mass flow as a supply mechanism varies widely with crop, climate, and soil moisture conditions, since each of these affects water use. The concentration of nutrients in the soil solution also varies widely among soils (Table 2.1).
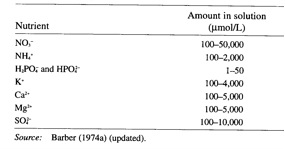
Table 2.1 The range of concentrations of major nutrients in the soil solution (from Barber 1995),
In a relatively fertile soil, mass flow can supply all of a plants nutrient supply, with the exception of N, phosphorus and potassium (Table 2.2). Clearly, supply will decrease as the fertility of the soil decreases, and in natural environments (unfertilised), a wider range of nutrients will be undersupplied if the only means by which nutrients moved to the plant root was by mass flow.
Where the mass flow of nutrients toward the plant root in the transpiration stream is insufficient to replace nutrients being actively taken up by the plant root, the concentration of the nutrient in the soil solution adjacent to the root will be decreased. This depletion of nutrient in the soil solution results in the creation of a concentration gradient toward the plant root, and additional nutrient will move toward the root by diffusion as a result of the existence of this gradient. This diffusion effect is well demonstrated in the autoradiograph of P depletion (plate 2.1).

Table 2.2. Relative significance of root interception, mass flow and diffusion in supplying maize with its nutrient requirements in a fertile silt loam soil. Units are kg/ha. (from Barber 1995).

Plate 2.1 (left) Autoradiograph illustrating the depletion zone for P created around a plant root as a result of uptake. This depletion of P will result in diffusion of P toward the root. Accumulation of P in the plant tops is shown by the dark (highly exposed) leaves. (from Barber SA, Walker JM and Vasey EH, 1963 J. Agric. Food Chem. 11:204-207)
The distance the concentration gradient extends from the plant root depends on the rate of diffusion. The distance for diffusive nutrient movement is in the range of 0.1 to 15 mm depending on the nutrient of interest. Diffusion of nutrients through soil is typically several of orders of magnitude slower than in water (Table 2.3). Since diffusion of nutrients in soil is primarily through the soil water (note very low value for diffusion through mineral), the rate if diffusion will vary with the water content of the soil. Furthermore, diffusion in soil is limited by the tortuous path through soil pores. When ions which are retained by the soil surface (exchangeable cations and adsorbed P) are considered, the diffusion rate is reduced further because of the successive equilibrations of the ion with the solid phase.
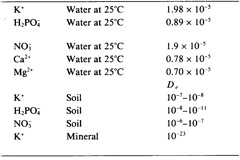
Table 2.3. Diffusion coefficients for ions in solutions, soils and minerals.
On the basis of the soil diffusion values presented in Table 2.3, it is clear that nitrate will diffuse the greatest distance to roots, while phosphate will diffuse the least distance (two to four order of magnitude difference in diffusion coefficients).
Plant roots with a high absorbing power (the capacity to reduce nutrient concentrations in the soil solution to low levels) can create a higher concentration gradient, thus increasing nutrient movement toward the root. This indicates that the root itself and its metabolism influence nutrient availability. These differences are reflected in the relative ability of different species to grow under nutrient limited conditions.
A small amount of nutrient also becomes available to the plant as roots grow through the soil – the root literally occupies the pore space that previously held soil solution. This nutrient supply process is termed interception. As the root volume of plants is typically small (<1% of the soil volume), the amount of nutrient supplied by this means is small. Barber in defining root interception included all of the available nutrient in this 1% soil volume, rather than just the nutrient in soil solution. Thus for nutrients for which the soil solid phase represents a reservoir (e.g. exchangeable cation nutrients such as Ca), the amount of nutrient supplied by interception can be substantial. However, it is important to remember that this solid phase nutrient will enter the soil solution prior to plant uptake – direct contact exchange between the soil surface and the plasma membrane is not possible. Thus, many authors only consider supply to occur by mass flow and diffusion (the interception component in Table 2.2 is combined with the diffusion component).
On the basis of the soil diffusion values presented in Table 4, it is clear that nitrate will diffuse the greatest distance to roots, while phosphate will diffuse the least distance (two to four order of magnitude difference in diffusion coefficients). For a plant to acquire P, it must be able to place an uptake surface (root, root hair, or mycorrhizal hyphae) close to the soil surface on which the P is adsorbed – the plant can then deplete P from the soil solution, causing desorption of P from the soil surface, which can then diffuse to the root. Thus, plants can increase their access to P by increasing the volume of soil close to roots. This is achieved by growing a larger root system, a response apparent in the higher root:shoot ratio in P stressed plants (Figure 2.5). The plant allocates a greater proportion of its resources to root growth, and a smaller proportion to shoot growth. Plants can also access a greater soil volume by increasing the production of root hairs – note that for P we are only considering the soil within a few mm of the root as having been accessed. Root hairs can dramatically increase the root surface area (and hence the volume of soil accessed) at a low cost in photosynthate, relative to growing more roots (Table 2.4). Finally, plants can access a greater volume of soil through the formation of a mycorrhizal symbiosis. Per unit of photosynthate invested, mycorrhizal fungi are even more efficient than root hair growth.

Figure 2.5 (above). The root to shoot ratio of wheat cultivars exposed to differing levels of P nutrition.
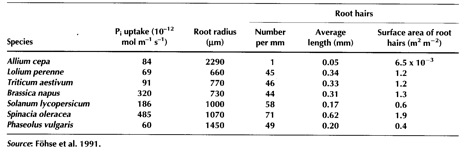
Table 2.4 Phosphorus uptake by seven plant species in relation to root morphology.
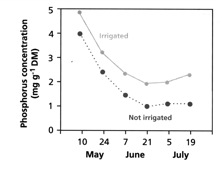
Nutrient supply to the plant root is strongly dependent on the supply of water in the soil. There are two easily recognised components to this. Firstly, as water becomes limiting in the soil, the plant experiences water stress and responds by closing its stomates in order to reduce transpiration. This in turn reduces water uptake by the root, reducing the supply of nutrients to the root by mass flow. The second effect that lower soil water content has, is to increase the tortuosity of the pathway along which nutrients need to diffuse in order to reach the plant root (the diffusion coefficients will become smaller), reducing nutrient supply. The effects of soil water content on stomatal conductance (how open the stomates are), and the rate of ion diffusion are illustrated in Figure 2.6, while the net effect of these processes on P uptake is demonstrated in Figure 2.7 by the effect of irrigation on P uptake by barley. For P, the increased uptake which is seen with irrigation will primarily result from higher rates of P diffusion in the moist soil, as P is primarily supplied to the root by diffusion (Table 2.2). The effect of increased mass flow would be small.
|
 |
 |
|
Figure 2.6 The rate of ion diffusion (deduced from the diffusion impedance factor for Cl-) and leaf conductance to water vapour as dependent on soil moisture for oleander grown in a sandy loam soil (from Lambers et al 2008) |
Figure 2.7 Phosphorus concentration in shoots of barley grown with and without irrigation (from Lambers et al 2008) |
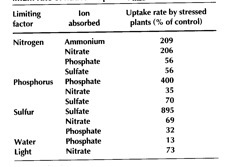
Plants can also deal with nutrient shortage by increasing the rate at which they take up the nutrient. This will have the effect of lowering soil solution concentration, increasing the concentration gradient between the bulk soil solution and the root surface, and thus increasing the movement of nutrient to the root surface by diffusion. The effect of nutrient shortage on the maximum rate of nutrient uptake is highly specific to the deficient nutrient. For example, N deficiency increases the maximum uptake rate for both nitrate and ammonium; but it decreases the uptake of the non-limiting nutrients (Table 2.4). In this way the plant is using its resources most efficiently – effectively spending its energy obtaining the most limiting nutrient. Increasing the rate of nutrient uptake can also be advantageous in situations where part of the root system is exposed to a higher concentration of nutrient – for example in fertiliser bands, urine patches, or where residue is breaking down.
|
Table 2.4 Effect of shortage of one nutrient or of water and exposure to low irradiance on the maximum rate of nutrient uptake |
 |
|
|
 |
||
|
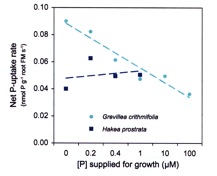
Figure 2.8 The effect of phosphorus supply on net P uptake for Grevillea crithmifolia and Hakea prostrata. Note the down regulation of uptake in G. crithmifolia. |
The converse of plants ability to increase (up regulate) nutrient uptake under conditions of limited supply, is the ability to decrease (down regulate) uptake when the plant is well supplied. This effect is demonstrated by Grevillea crithmifolia (Figure 2.8). In the experiment reported in Figure 2.8, plants were grown in nutrient solutions which contained differing amounts of P, with all other nutrients supplied at adequate levels. Plants were taken from these growth solutions and placed in a complete nutrient solution which contained P at 5 µM; thus all uptake measurements were made from a constant solution concentration. As the supply of P available to G. crithmifolia increases, the uptake rate of the root is decreased (reflected in this data by a lower rate of uptake from the 5 µM solution), ensuring an adequate, but not excessive supply of P. In contrast, Hakea prostrata is not able to alter its P uptake rate, and if fertilized with P, will readily show P toxicity. A low capacity to down regulate P uptake is associated with species growing on P impoverished soils – presumably the ability to slow P uptake has never been an evolutionary advantage.
In addition to the physiological response of increasing uptake in response to the presence of a concentrated zone of nutrient, plants can also respond by altering their morphology. This is well demonstrated in Figure 2.9.

Figure 2.9 (right) The root distribution of a barley plant grown with part of its root exposed to an elevated concentration of nitrate, while the remainder was exposed to a low concentration. The proliferation of roots in the high nutrient zone allows the plant to exploit the conditions of nutrient heterogeneity typically encountered in soils.
In this experiment a barley plant has been grown with the majority of the root system exposed to a low concentration of nitrate (0.1 mM), but a narrow section was exposed to 1.0 mM nitrate. All other nutrients were supplied in adequate amounts throughout the root system. The plant has responded by proliferating roots within the zone of high nutrient concentration. Plants are capable of responding to N and P supply by proliferation of roots, but do not appear to respond (or at least to a much smaller extent) to potassium (K). These two plant responses, the ability to grow additional roots, and to increase the rate that roots take up N and P, to higher concentrations of certain nutrients, underpin the successful practice of banding fertiliser.
Before leaving the subject of plant P uptake, its worth considering how the plant acts to alter the availability of P in the soil. These processes are summarised in Figure 2.10, and I will provide a very brief coverage here – if you are interested Hinsinger 1998 provides a great coverage of the topic. Plants act to alter P availablilty in the following ways:
lowering the soil pH (H+-ATPase in Figure 2.10). At lower pH, a range of P containing minerals are more soluble – in particular the calcium phosphate minerals (see Figure 1.5). By lowering the pH, the concentration of orthophosphate in solution can be increased (Figure 2.11).
Production and efflux of organic acids (e.g. citric, malic, tartaric) (carboxylate channel in Figure 2.10). These organic acids can compete with orthophosphate for adsorption sites on aluminium (Al) and iron (Fe) mineral in the soil, releasing P into soil solution. The organic acids can also enhance the dissolution of calcium minerals releasing P – either calcium phosphate minerals which contain P, or calcium carbonate to which P is adsorbed. Citrate is especially effective in this role.
Production and release of extra-cellular phosphatases. These enzymes break down organic-P, releasing inorganic P into solution for uptake. Remember that micro-organisms and mycorrhizas also do this.
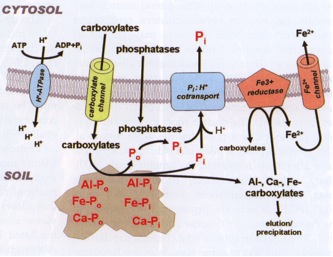
Figure 2.10 Schematic representation of the processes by which plants increase P availability in soil. The upper part of the diagram represents the interior of a cell, the broad line through the middle represents the cell membrane, while the bottom part of the diagram is the soil / soil solution (from Lambers et al 2008).
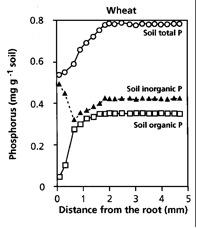
Figure 2.11 (right) The effect of root action on the concentration of total P, organic P, and inorganic P. This data shows the depletion of inorganic P anticipated through plant P uptake, but also a reduction of organic P. As plants can not access organic-P directly, this is attributed to the activity of phosphatases (either produced by the plant, or by micro-organisms in the rhizosphere).
The tissue P concentration required for good growth of crops is about 0.2 %; this is comparable to the demand for S, and about one teneth the demand for N and K (Table 2.5). The minimum concentration of P required in the soil solution for adequate plant growth varies between species, but in agricultural plants may range from <1 to 32 mM (Table 2.6). Plant roots are capable of extracting P from solution at concentrations as low as 1 to 0.01 μM.
Table 2.5 Nutrient content of crop, pasture and tree species. Concentrations represent the recently matured leaves of plants at the flowering stage, or in full vegetative growth (Reuter and Robinson 1997)
|
Nutrient Content (%) |
Nitrogen
|
Potassium
|
Phosphorus
|
Sulphur
|
|
Cereals
|
|
|
|
|
|
Maize (Zea mays) |
3.0-3.5
|
1.7-3.0
|
0.2-0.3
|
0.15-0.22
|
|
Rice (Oryza sativa) |
2.9-4.2
|
1.0-2.5
|
0.1-0.2
|
|
|
Sorghum (Sorghum vulgare) |
3.0-5.0
|
1.5-3.0
|
0.2-0.6
|
>0.16
|
|
Wheat (Triticum aestivum) |
2.0-3.5
|
2.0-3.5
|
0.2-0.5
|
0.2
|
|
|
|
|
|
|
|
Legumes
|
|
|
|
|
|
Field bean (Vicia faba) |
4.8-5.3
|
2.2-3.2
|
0.3-0.4
|
|
|
Field pea (Pisum sativum) |
4.0-5.5
|
2-3.5
|
0.25-0.5
|
0.2-0.4
|
|
Navy bean (Phaseolus vulgaris) |
3-6
|
2-3
|
0.25-0.50
|
|
|
Peanut (Arachis hypogaea) |
3.5-4.5
|
1.6-3.0
|
0.25-0.5
|
0.20-0.35
|
|
|
|
|
|
|
|
Industrial crops
|
|
|
|
|
|
Cotton (Gossypium hirsutum) |
3.6-4.7
|
1.7-3.5
|
0.3-0.5
|
0.6-1.0
|
|
Sugarcane (Saccharum sp.) (4 months) |
1.5-2.0
|
1.2-1.25
|
0.24-0.3
|
0.25-0.3
|
|
Oil palm (Elaeis guineensis) (Frond 3) |
2.8-3.0
|
1.5-1.8
|
0.19-0.21
|
|
|
|
|
|
|
|
|
Trees
|
|
|
|
|
|
Acacia mangium
|
2.0-3.0
|
0.65-1.0
|
0.11-0.15
|
|
|
Casuarina glauca
|
1.1-1.45
|
0.4-0.6
|
0.11-0.16
|
0.1-0.12
|
|
Eucalyptus camaldulensis
|
1.5-2.1
|
0.6-0.8
|
0.18-0.22
|
0.11-0.16
|
|
E. dunnii
|
1.8-2.8
|
0.8-1.5
|
0.11-0.22
|
|
|
Grevillea robusta
|
1.3
|
0.6
|
0.08
|
|
Table 2.6. Phosphorus concentrations in solution required for adequate plant growth (adapted from Asher and Loneragan, 1967)
|
Plant
|
P concentration (μM) |
|
Potato
|
>16
|
|
Cotton
|
4-32
|
|
Pea
|
32
|
|
Tomato
|
3-32
|
|
Lettuce
|
4-10
|
|
Wheat
|
1-11
|
|
Soybean
|
3-5
|
|
Maize
|
1-5
|
|
Clover
|
0.2-5
|
Phosphorus is required by plants to export energy out of the chloroplast. This is clearly one of the most fundamental processes in plant growth. Inadequate P nutrition also interferes with protein systhesis, and the synthesis of nucleic acids. Plants suffering from P deficiency are thus retarded in their growth. The formation of fruits and seeds is especially depressed in plants suffering P deficiency. Thus, not only low yields, but also poor quality fruits and seeds are obtained from P deficient crops.
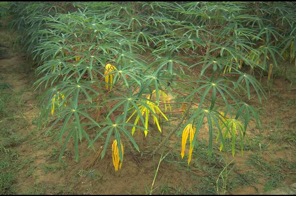
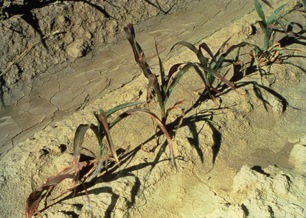
Generally symptoms of P deficiency appear first on the older leaves of the plant, as P can be moved within the plant, and is continually redistributed toward the growing tip, and ultimately the grain/fruit. Older leaves are often darkish green colour, then chlorotic (yellow) as they are stripped of nutrients before falling prematurely (this is shown clearly by cassava in Plate 2.2. The stems of many annual plant species suffering P deficiency are characterized by a reddish colouration originating from the enhanced formation of anthocyanins. This red colouration can also be apparent in the leaves of some cereal crops (see barley in Plate 2.2)
 |
|
|
 |
|
|
 |
|
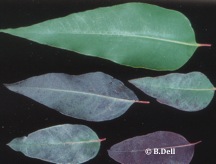
|
Plate 2.4.1 Foliar symptoms of P deficiency. (Top-left). Reduced leaf size and a purple colour indicate P deficiency in Eucalyptus urophylla. A normal leaf can be seen at the top of the photograph (Dell et al., 1995). (Top-right). Coloration of barley leaves. (Top right) Yellowing and loss of older leaves by P deficient cassava. (Bottom) Phosphorus deficiency in sorghum (Grundon 1987). |
|
Asher, C.J., and Loneragan.J.F. 1967. Response of Plants to Phosphate Concentration in Solution Culture .I. Growth and Phosphorus Content. Soil Sci 103:225-&.
Barber, S.A. 1995. Soil Nutrient Bioavailability: A mechanistic approach. 2nd ed. John Wiley and Sons, New York.
Barber, S.A., J.M. Walker, and E.H. Vasey. 1963. Mechanisms for Movement of Plant Nutrients from Soil and Fertiliser to Plant Root. Journal of Agricultural and Food Chemistry 11:204-&.
Barrow, N.J. 1980. Evaluation and utilization of residual phosphorus in soils, p. 333-410, In F. E. Khasawneh, ed. The Role of Phosphorus in Agriculture. Am. Soc. Agron. / Soil Sci. Soc. Am., Madison, Wis.
Barrow, N.J. 1984. Modeling the Effects of Ph on Phosphate Sorption by Soils. J Soil Sci 35:283-297.
Bowden, J.W., and D. Bennett. 1974. The Decide model for predicting superphosphate requirements. Phosphate in Agriculture. Australian Institute of Agricultural Science (Victorian Branch).
Dell, B., N. Malajczuk, and T.S. Grove. 1995. Nutrient Disorders in Plantation Eucalypts Australian Centre for International Agricultural Research, Canberra.
Devine, J.R., D. Gunary, and S. Larsen. 1968. Availability of Phosphate as Affected by Duration of Fertiliser Contact with Soil. J Agric Sci 71:359.
Grundon, N.J. 1987. Hungry Crops Department of Primary Industries, Brisbane.
Hedley, M.J., P.H. Nye, and R.E. White. 1982. Plant-induced changes in the rhizosphere of rape (Brassica napus var. emerald) seedlings. II. origin of the pH change. New Phytol 91:31-44.
Hinsinger, P. 1998. How do plant roots aquire mineral nutrients? Chemical processes involved in the rhizosphere. Adv Agron 64:225-265.
Lambers, H., F.S. Chapin, and T.L. Pons. 2008. Plant Physiological Ecology. Second Edition ed. Springer, New York.
Lindsay, W.L. 1979. Chemical Equilibria in Soils John Wiley and Sons, New York.
Mengel, K., and E.A. Kirkby. 2001. Principles of Plant Nutrition Kluwer Academic Publishers, Dordrecht.
Marschner, H. 1995. Mineral Nutrition of Higher Plants. Second ed. Academic Press, London.
Menzies, N.W., L.C. Bell, and D.G. Edwards. 1994. Exchange and solution phase chemistry of acid, highly weathered soils. I. Characteristics of soils and the effects of lime and gypsum amendments. Aust J Soil Res 32:251-267.
Norrish, K., and H. Rosser. 1983. Mineral phosphate, p. 335-361, In Division of Soils. CSIRO, ed. Soils: an Australian viewpoint. Academic Press, Melbourne.
Phillips, R.E., and D.E. Peaslee. 1970. Effect of Chemical Pretreatment of Kaolinite Clay Upon Apparent Self-Diffusion of Phosphorus-32. Soil Sci Soc Am Proc 34:743
Probert, M.E. 1983. The sorption of phosphate by soils, p. 427-438, In Division of Soils. CSIRO, ed. Soils: an Australian viewpoint. Academic Press, Melbourne.
Richardson, S.J., D.A. Peltzer, R.B. Allen, M.S. McGlone, and R.L. Parfitt. 2004. Rapid development of phosphorus limitation in temperate rainforest along the Franz Josef soil chronosequence. Oecologia 139:267-276.
Reuter, D.J., and J.B. Robinson. 1997. Plant Analysis: An Interpretation Manual. second ed. CSIRO Publishing, Collingwood.
Sanchez, P.A. 1976. Properties and Management of Soils in the Tropics John Wiley and Sons, New York.
Tinker, P.B., and P.H. Nye. 2000. Solute movement in the rhizosphere Oxford University Press, Ney York.
Uehara, G., and G.P. Gillman. 1981. The Mineralogy, Chemistry, and Physics of Tropical Soils with Variable Charge Clays Westview Press, Boulder, CO.
Wild, A., (ed.) 1988. Russell's Soil Conditions and Plant Growth. Longman Scientific and Technical, Harlow.
Williams, C.H., and J. Lipsett. 1961. Fertility Changes in Soils Cultivated for Wheat in Southern New South Wales. Aust J Agric Res 12:612-&.