Low protein: is it timing decision making or something else?
Author: Chris Dowling, Back Paddock Company | Date: 05 Mar 2013
Chris Dowling, Back Paddock Company
Take home message
Low protein in cereal grains is indicative of poor nitrogen supply to the grain during the grain fill period. This is influenced by factors such as the location and concentrations of mineral nitrogen resulting from fallows and application of fertilisers, fallow soil moisture amount and soil profile distribution, seasonal rainfall and temperature patterns, and crop species and varietal genetics. Contributing factors in the 2012 crop included:
- Long term loss of soil nitrogen supply elasticity as a result of organic matter decline
- General lack of legumes in rotations
- Record wet summers prior to the 2012 winter crop
- High yields in crop preceding 2012 winter crop
- Summer 2011/12 denitrification events
- Fertiliser N management strategies – quantity and timing
- Dry spring – subsoil finish - moisture and available nitrogen dislocation
Does the 2012 outcome mean that we have the foundations of N nutrition wrong? No, the soil N cycle is still the same, but we need to heed the low protein warnings. These warnings suggest that “set and forget” nitrogen management of the past was a legacy of the fortunate combination of soil organic N reserves and climate and this may need to change. With increasing impact of factors such as declining N reserves and apparent increasing varietal difference in N use, nitrogen management especially for high grain protein may well need more considered in-season management oversight and different N management options for the future.
What is low protein in cereals telling us?
In essence, low protein content in cereal grain is symptomatic of the inability of the soil and/or dry matter mass of the crop to maintain an adequate nitrogen (N) content to maintain a protein content relative to grain yield. In reviewing the 2012 season it is pertinent to review what constitutes low grain protein.
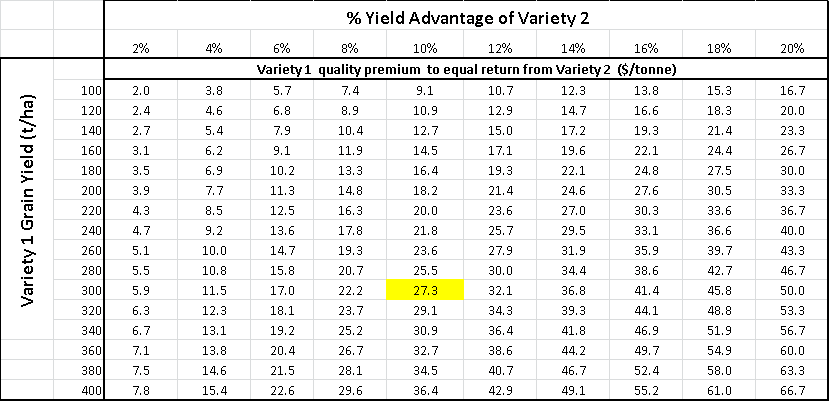
Grain protein can be an important measure of crop performance from both economic and agronomic perspectives. From an economic perspective the dollar value of some in cereal crops is directly or indirectly related to it grain protein content, while from an agronomic perspective it is a reasonable barometer of seasonal adequacy of nitrogen supply. In recent years the benefit of higher protein has been negligible from an economic perspective due to the low premiums. Selection of wheat varieties with yield advantages at the expense of protein have frequently provided the best economic return (Table 1) and now dominate crop areas. This may be influencing protein averages in many districts.
Table 1: Quantity of grain required to provide equivalent income as grain premium at a range of base grain prices. (e.g. at base grain price of $300 and a varietal yield advantage of 10 % it would take a grain price difference of $27.30/t to provide the equivalent income.)
For wheat grown in northern NSW and Qld achievement of grain protein of 11.5 – 12.5 % in varieties with hard classification is thought to indicate optimisation of N availability (quantity and location) for the seasonal moisture availability (quantity and timing) (Figure 1). This protein range also includes the 90 % Relative Yield (RY) point that is commonly associated with economic optimum.
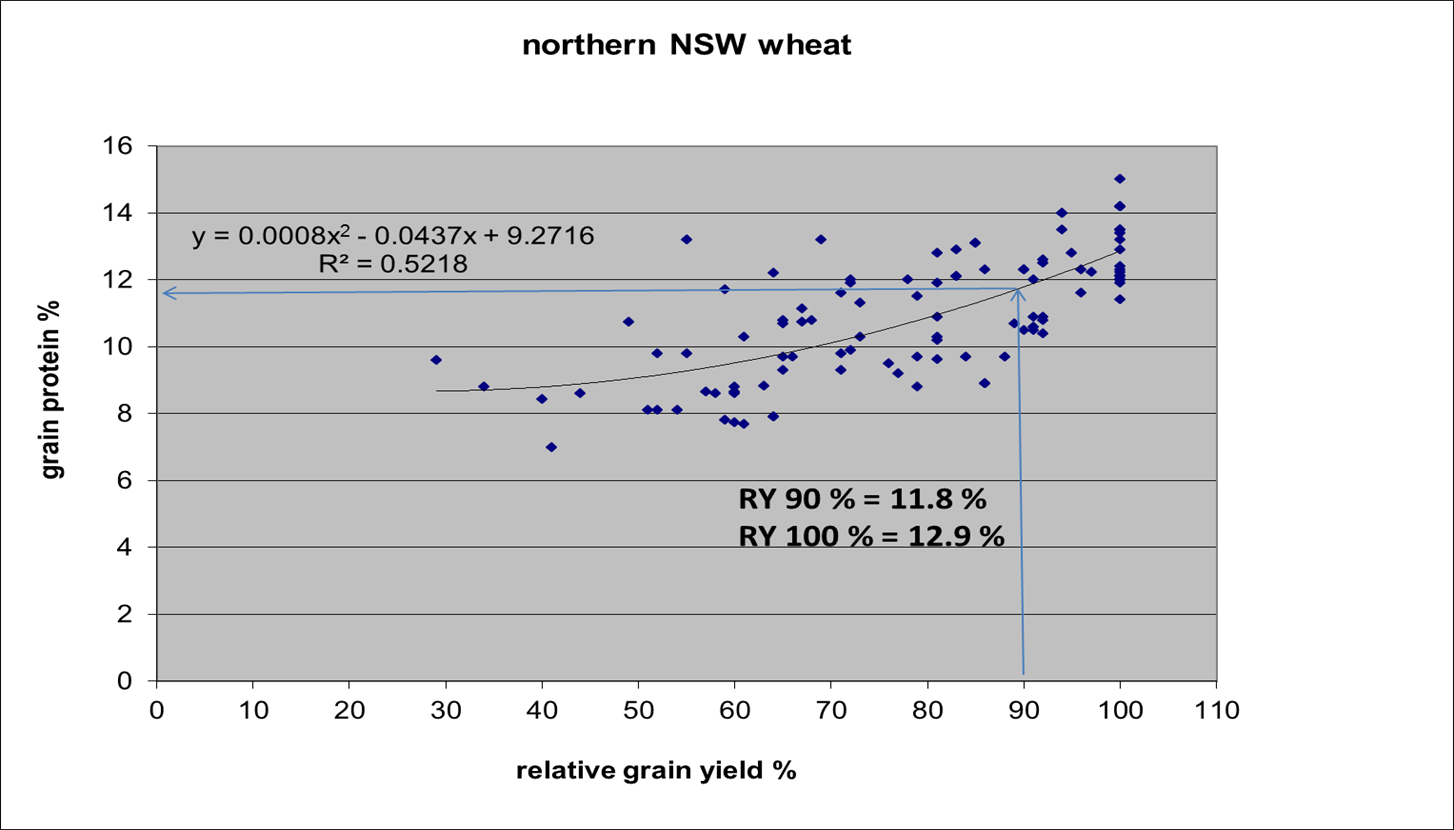
Figure 1: Grain protein % reflects the seasonal adequacy of nitrogen supply
Agronomically, grain protein also provides a historical perspective of the risk associated with having added more N (Table 2), and the likely residual soil N at the commencement of the next fallow (Figure 2).
Table 2: Probability of grain yield increase from added nitrogen based on historical grain protein % (Strong 2000)
|
Grain Protein |
Frequency of response to applied nitrogen |
|---|---|
|
<12.5% |
8/10 |
|
<11.5 % |
9/10 |
|
<10.5 |
10/10 |
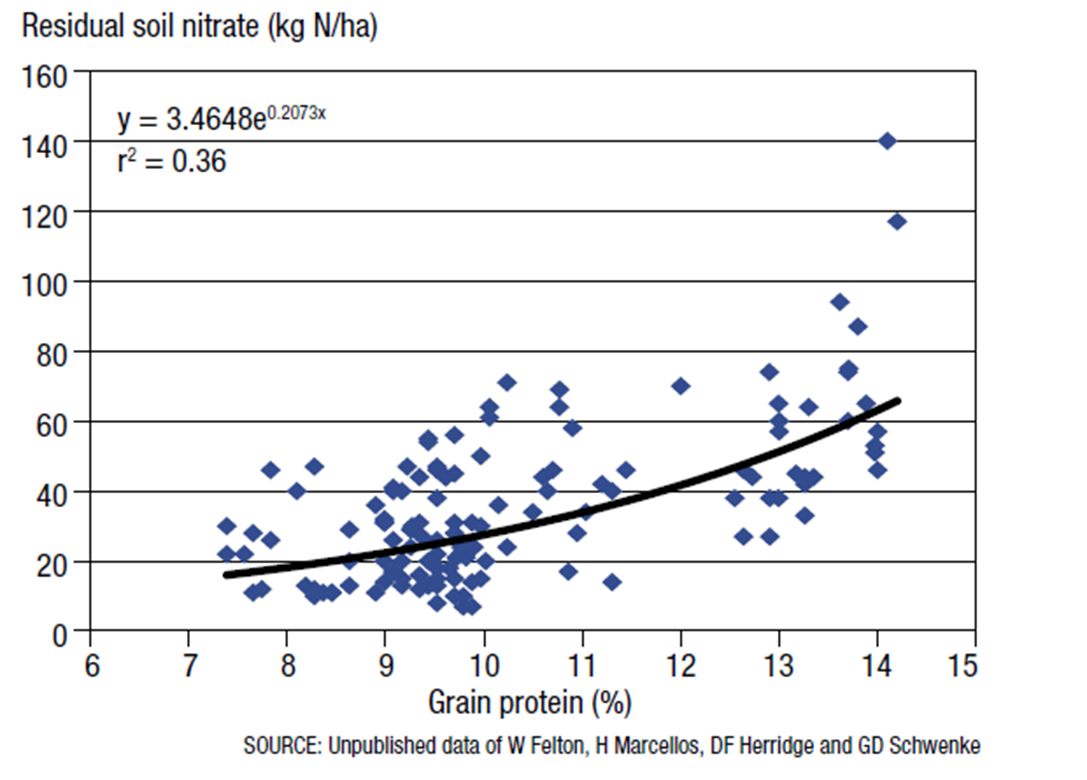
Figure 2: Post harvest soil residual nitrate-N is related to grain protein in wheat
How and when does protein get into the grain?
After flowering as grain is developing, N in the form of amino compounds derived from breakdown of proteins in other plant parts such as leaves and stems and nitrate from the soil are transported to the grain where it is deposited. Translocation of N from the crop biomass to grain is dominantly via the glumes, and upper leaves and where functional the roots (Figure 3). Damage to these plant parts post-anthesis can significantly affect both yield and protein content.
Deposition of both starch and protein take place during this period, starch deposition beginning about 1 week after anthesis with storage proteins first appearing in the endosperm about 10 days after anthesis. Grain fill has two components, rate and duration; both are under genetic and environmental controls.
Starch deposited in grain is mostly derived from CO2 fixed during grain fill whereas grain protein is largely derived from N absorbed and assimilated in earlier stages of growth and stored throughout the plant in a soluble form or as protein that is subsequently re-mobilised for deposition in grain. Climatic conditions such as cool temperatures and good availability of moisture that prolong grain fill favour high yield but frequently at the expense of grain protein %.
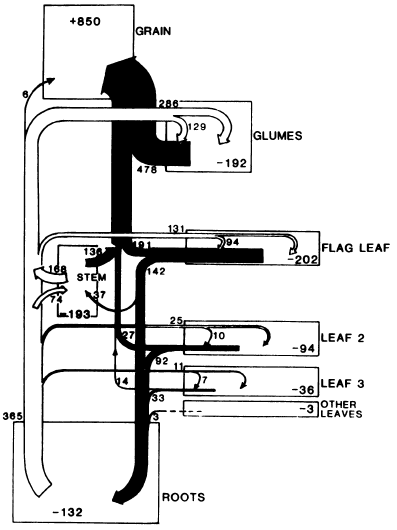
Figure 3: Movement of nitrogen compounds to the grain for deposition as protein after flowering. (from Simpson et al. 1983)
Starch deposited in grain is mostly derived from CO2 fixed during grain fill whereas grain protein is largely derived from N absorbed and assimilated in earlier stages of growth and stored throughout the plant in a soluble form or as protein that is subsequently re-mobilised for deposition in grain. Climatic conditions such as cool temperatures and good availability of moisture that prolong grain fill favour high yield but frequently at the expense of grain protein %.
Stems and leaves are the most important reserves of N. Each may contribute 30 % of the protein deposited in the grain. Environmental events (hail, frost, insect damage, disease) that reduce and cause traumatic death of stem and leaf tissue may significantly affect the N supply for grain fill. Contribution from the root is small, about 10 %. The glumes may contribute 15 % but more importantly act as a temporary site for deposition of N in early grain fill. Diseases such as head blights and melanism may also impact on grain N though a reduction in function of the glumes.
Grain fill is considerably affected by environmental factors, N nutrition and water balance being the most important. Depending on the nature and timing of the stress, starch deposition and /or protein deposition may be affected.
Elevated temperature (>30 oC) post-anthesis may cause premature cessation of starch deposition in the endosperm even with adequate water supply (pinched grain). Protein deposition is largely unaffected by temperature. Water stress will cause similar poor deposition, starch deposition being more sensitive than protein. It has been postulated that wheat varieties that sacrifice grain protein content for higher yield (e.g. EGA Gregory![]() ) may be less sensitive to temperature during grain fill and therefore able to maintain starch production and grain weight for a longer period.
) may be less sensitive to temperature during grain fill and therefore able to maintain starch production and grain weight for a longer period.
Protein and starch deposition are not always synchronous, the rate and duration being mostly independent events. The rate of protein deposition may reach its peak earlier than starch, explaining higher protein in grain when grain fill is shortened by high temperature or lack of moisture.
Every season presents us with a different set of environmental and biological circumstances that culminate in a grain yield and protein outcome that can largely be explained by events that affect the processes described above.
How does grain protein relate to soil and fertiliser nitrogen?
A multitude of factors affect the pathway of N from the soil to the grain and hence influence grain protein. The rate of nitrogen fertiliser applied is an attempt to bridge the gap between the nitrogen a soil can supply (mineralisation plus residual mineral-N minus denitrification), the crop demand for the season, and the efficiency of the crop accessing and transferring soil and fertiliser N to grain (Figure 4).
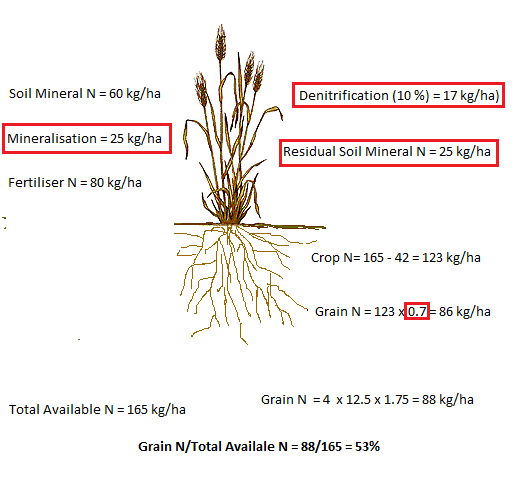
Figure 4: Gross seasonal nitrogen budgets – winter cereal
When the system fails and yield and/or grain protein are below optimum the causes can generally be put into a couple of major categories
- Insufficient nitrogen available across the season from the soil (inadequate quantity)
- The combination of mineralisable N and fertiliser N does not match the yield potential as determined by climatic conditions. The decline in soil organic matter has also seen a parallel and related decline in soil N supply capacity (Figure 5). If the decline in organic N supply is not matched by a parallel increase in N from other sources (fertiliser, recycle organics, legume) with equivalent uptake efficiency then yield and /or grain protein will decline.
- Nitrogen loss prior to crop access – denitrification depletes the mineral N pool that is derived from both mineralisation of organic N and fertiliser N residues. Where in the past it was thought that most denitrification was limited to the surface soil, recent anecdotal evidence suggests that under some circumstances denitrification may be occurring down to 60 cm where decaying root systems are present at the time of waterlogging.
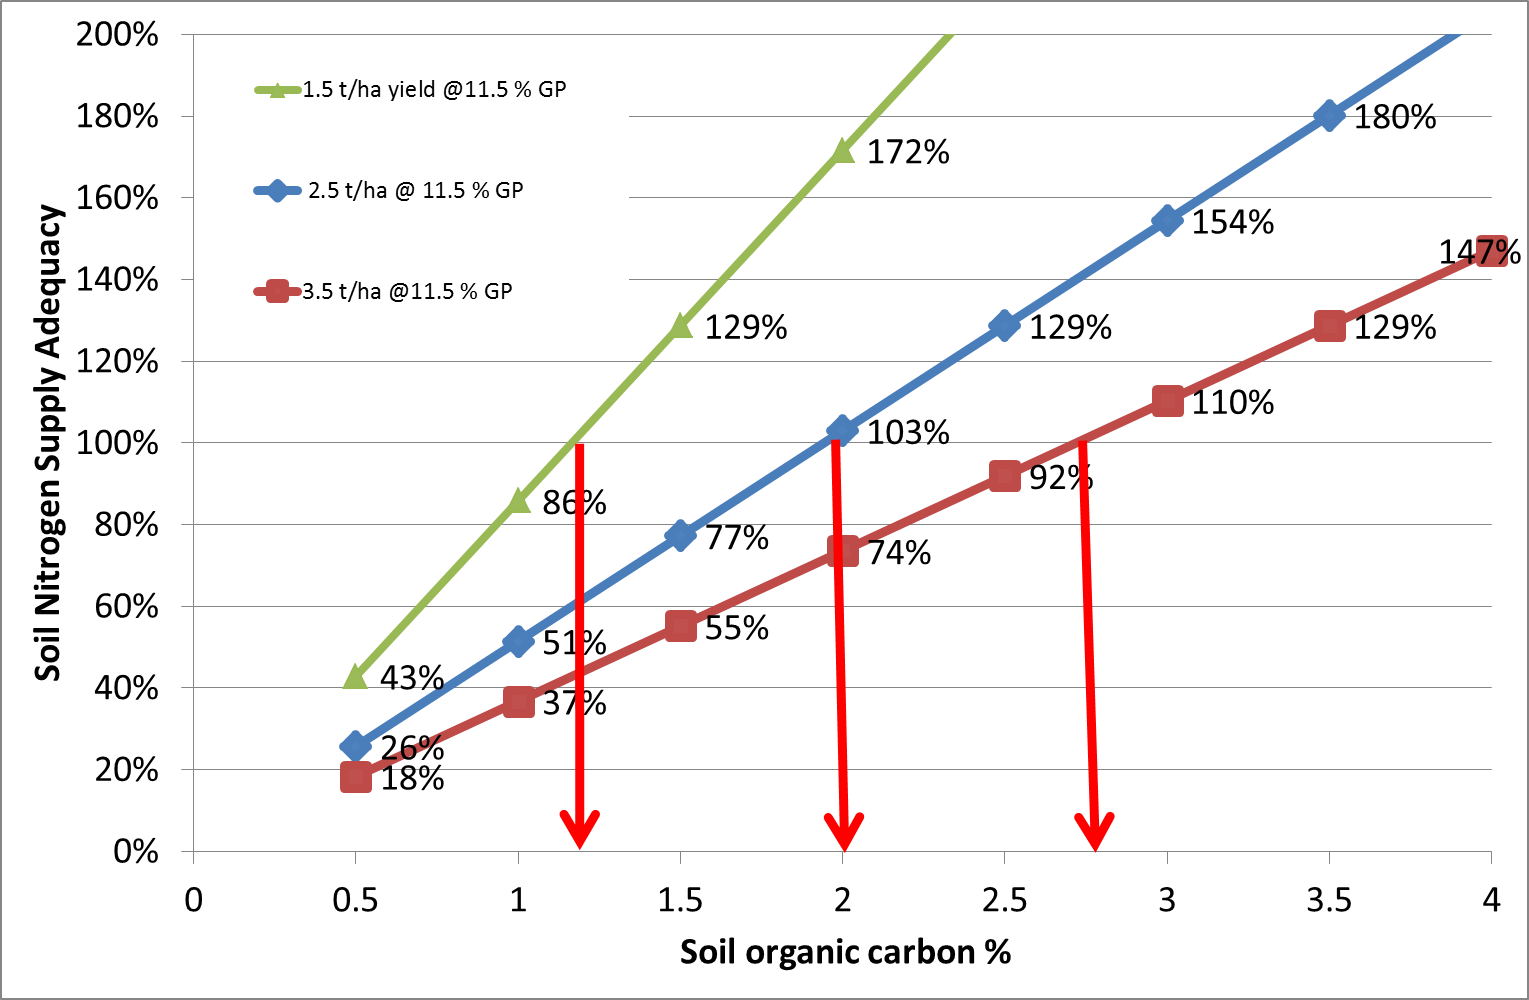
Figure 5: Soil organic carbon capacity to supply annual crop nitrogen demand at three levels of grain yield (assumptions: soil C/N ratio = 11, annual mineralisation % total N = 5)
- Sufficient nitrogen available but not taken up (low efficiency)
- Nitrogen available to the crop not accessed - located in dry soil or hostile (salinity, sodicity, nutrient toxicity, density) soil
- Low supply of another key nutrient such as phosphorus that can affect N acquisition.
- Nitrogen not transferred to the grain (internal nitrogen use efficiency)
- Variety – based on the NVT trials data there appears to be reasonably significant and consistent difference in cereal varieties in their apparent nitrogen efficiencies (Figure 6) and their yield – protein balance (Figure 7). Dominance of a particular variety can bias the average protein outcomes of a district and region.
- Low supply of another key nutrient such as potassium, sulphur and zinc that can affect internal use efficiency
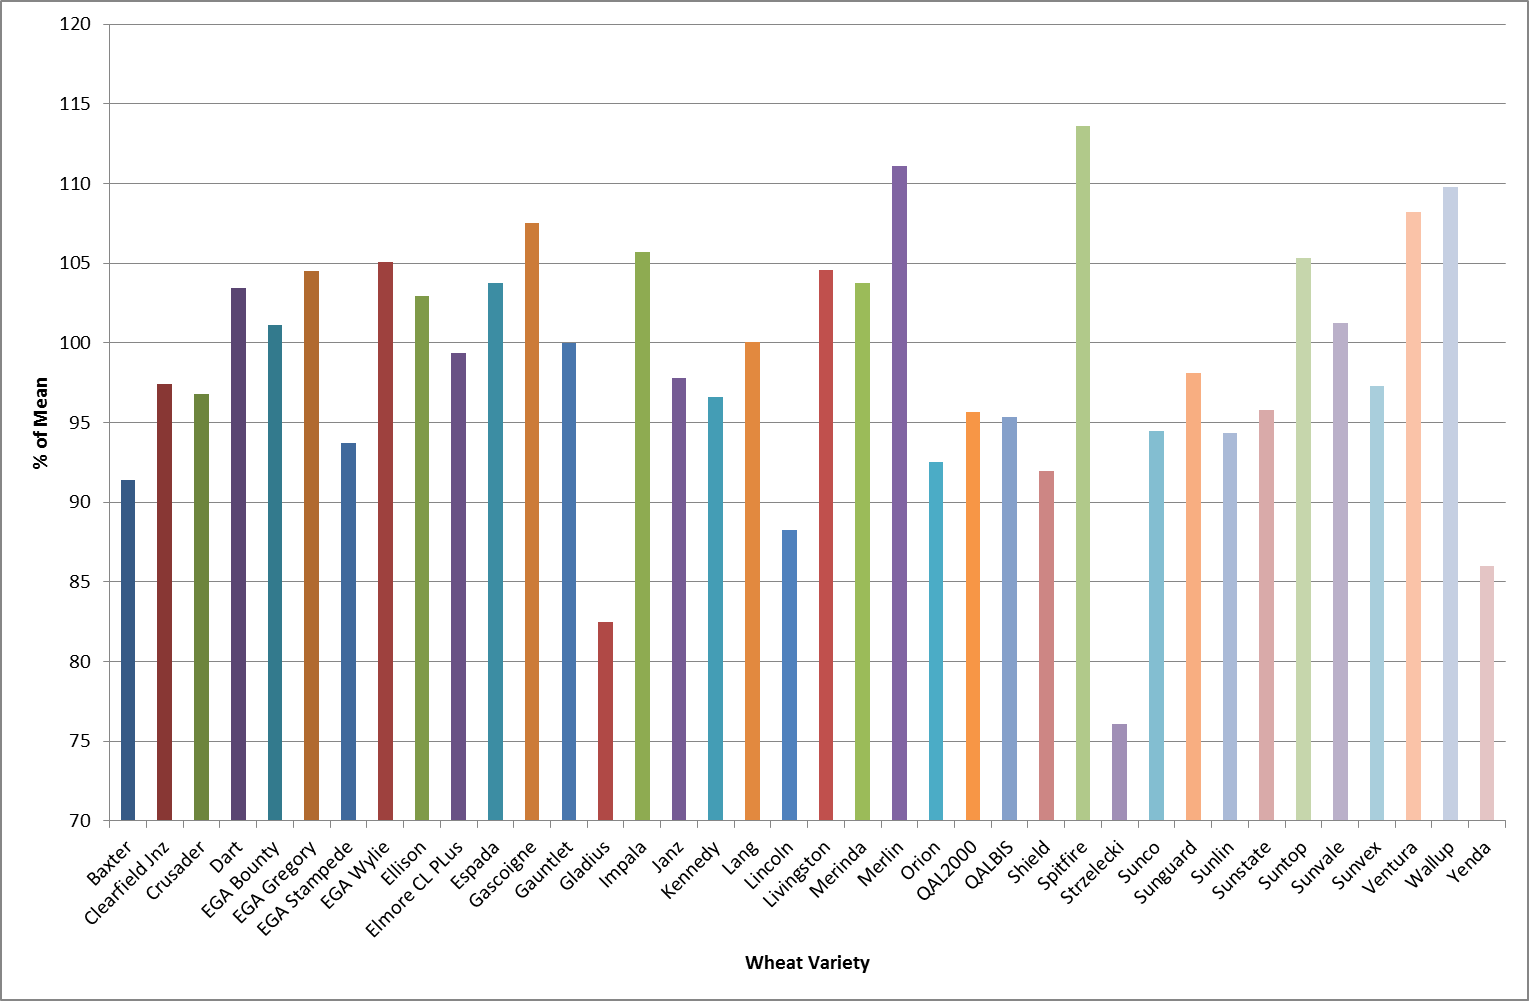
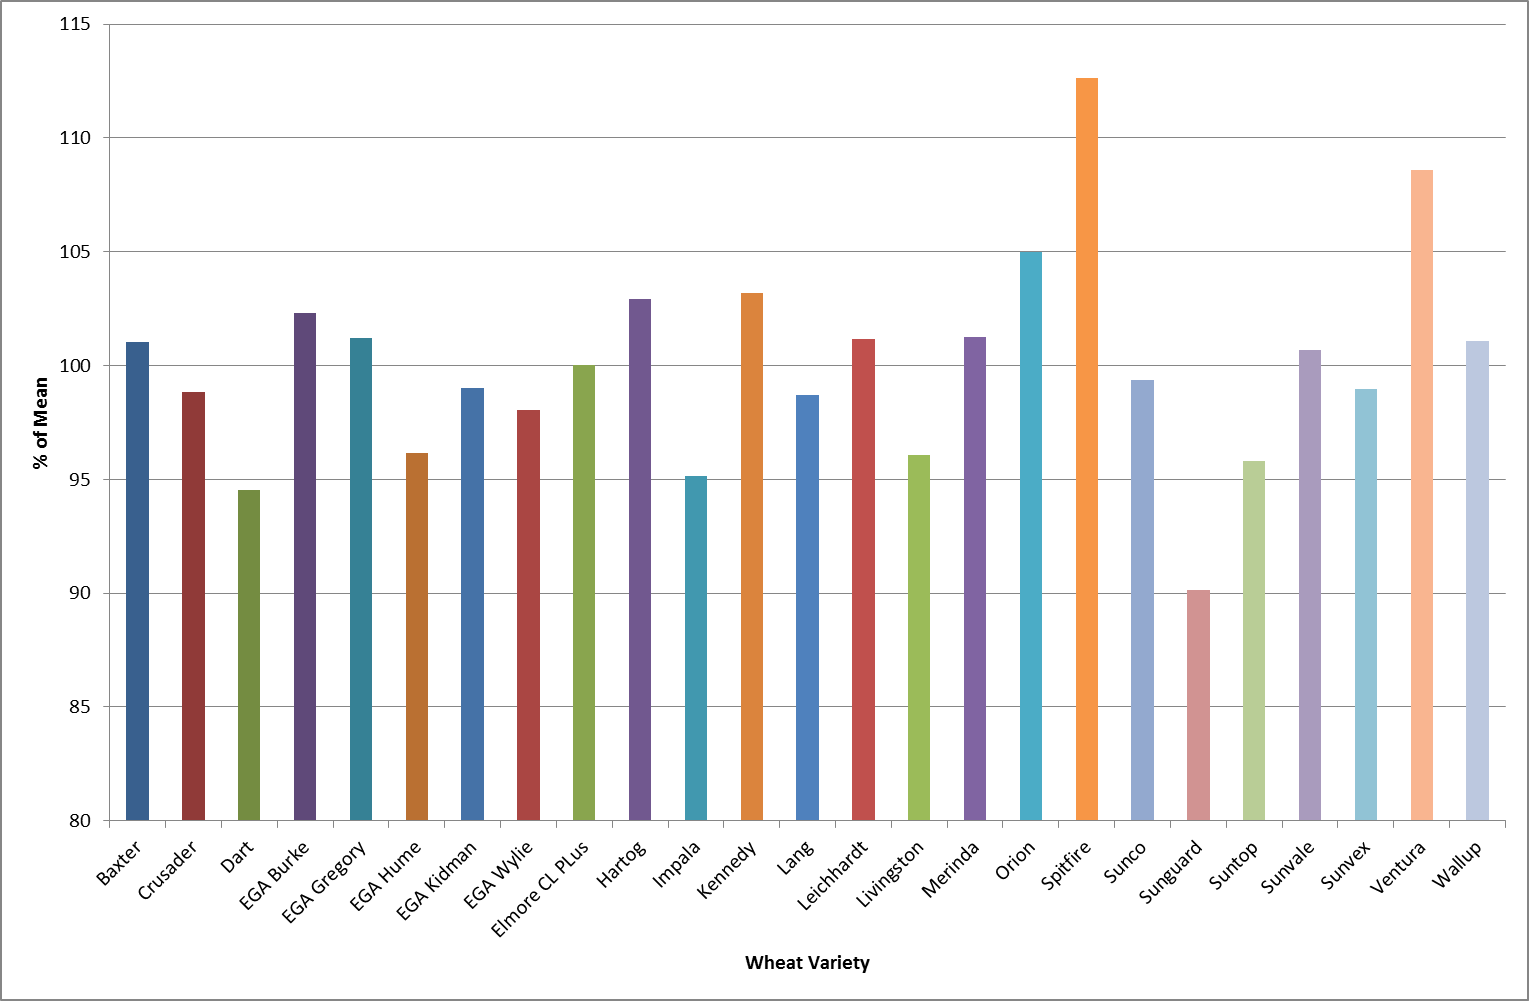
Figure 6: Relative wheat varietal nitrogen uptake performance assessed by grain nitrogen content (kg/ha) – Qld and NW NSW NVT Trials - 2011
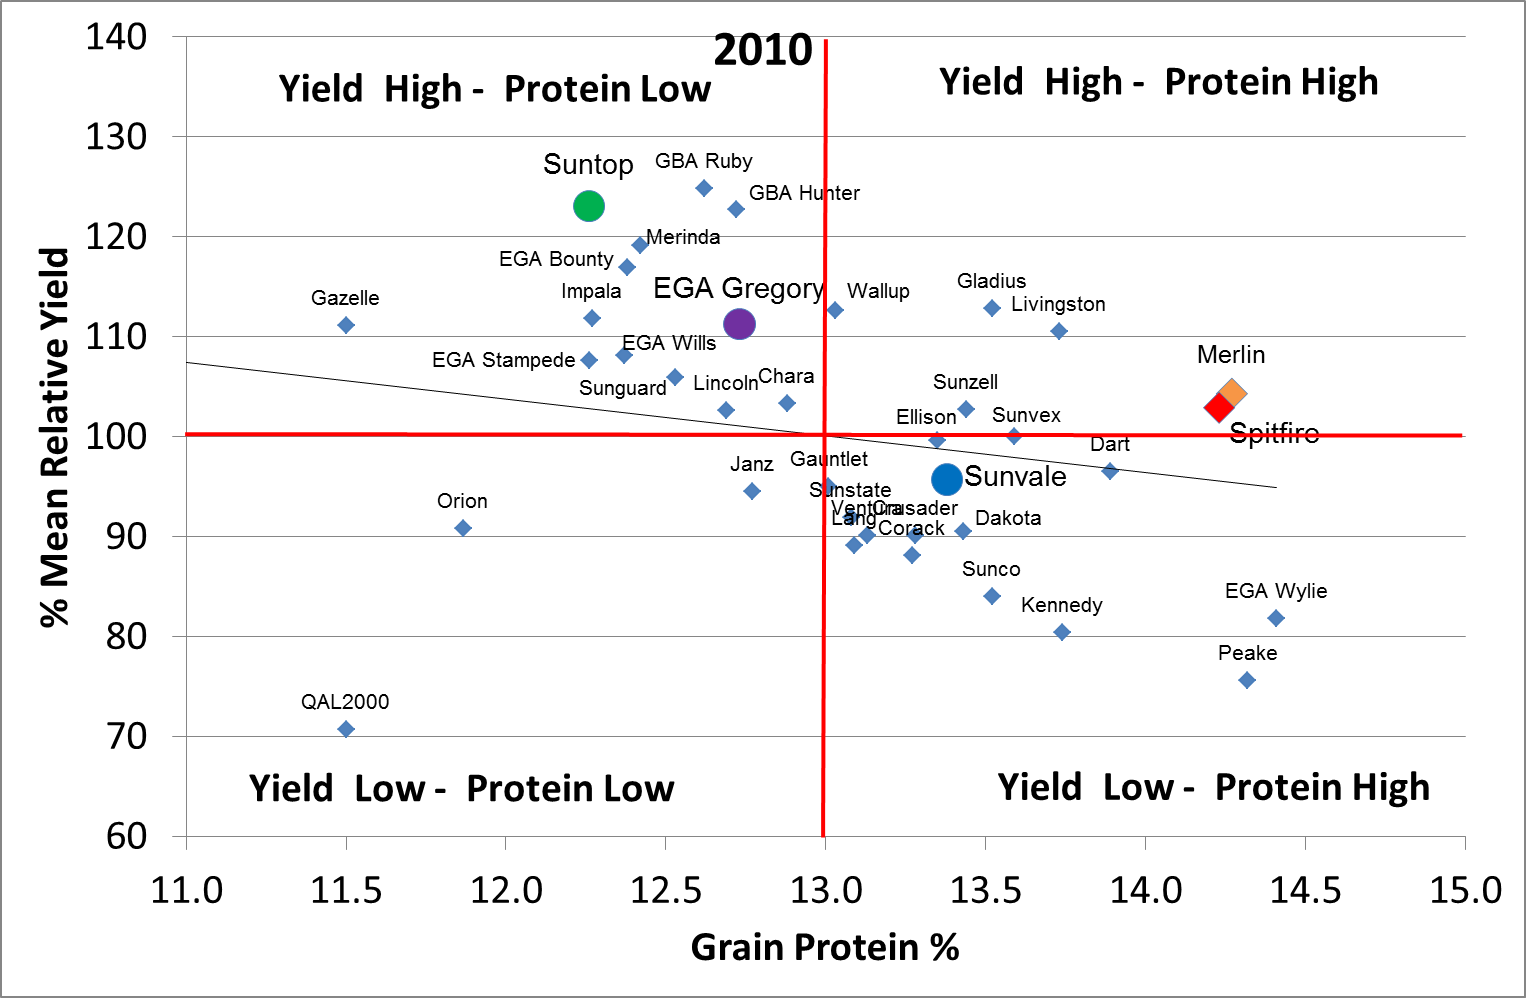
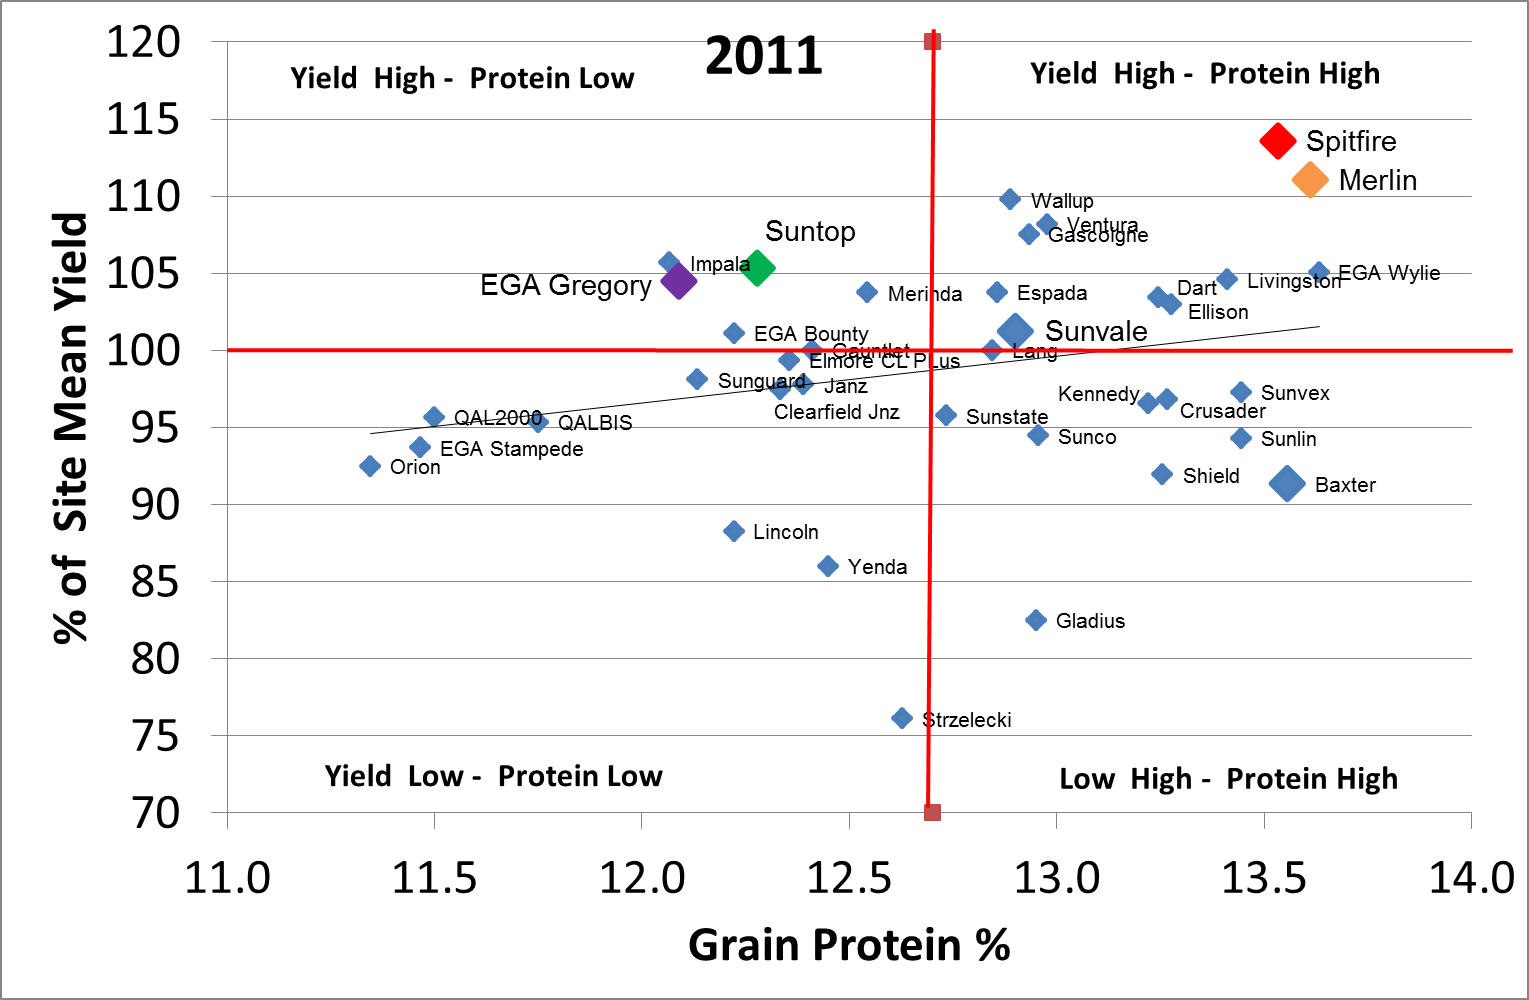
Figure 7: Relative grain yield – grain protein performance of wheat varieties, NW NSW NVT Trials 2010 and 2011.
What happened in 2012?
In any unexpected event, such as industry-wide low grain protein in dryland crops in 2012, the causes can generally be understood with the clarity of hindsight but prediction is frequently difficult. Prediction is clouded by complexity and uncertainty, particularly where weather events are a large component of the unknown. In the 2012 winter crop the combination of near term extremes such as the wet summer fallows and denitrification, small cumulative effects such as the depletion of subsoil mineral nitrogen reserves (built up during the mid-2000s drier seasons) by the crops in 2009 and 2010 as well as organic matter decline, and the seasonal growing conditions combined to create conditions where low protein was inevitable and probably reasonably predictable.
Low protein in cereal grains is indicative of poor nitrogen supply to the grain during the grain fill period. This can, and was, influenced by factors such as location of concentrations of mineral nitrogen in the soil, soil moisture, seasonal rainfall and temperature patterns and crop species and variety genetics.
Identified significant contributing factors in the 2012 crop included:
- Long term loss of soil nitrogen supply elasticity as a result of long-term organic matter decline.
- General lack of legumes in rotations to supplement background organic matter nitrogen.
- A record wet summer prior to the 2012 winter crop leading to significant denitrification through the soil profile. Soil test data from autumn 2012 suggests that many paddocks had no benefit from normal 20 – 50 kg/ha summer fallow N mineralisation due to losses from waterlogging or the >20 kg/ha residual mineral N present in the post-harvest ( Figure 2).
- High yields in crop preceding 2012 winter crop creating low mineral N availability in the subsoil.
- Fertiliser N management strategies – quantity and timing unsuited to the seasonal soil moisture use pattern. Due to the wet summer and autumn, N was applied in late autumn and into full soil profiles. As a consequence there was little possibility for movement of fertiliser N away from the application zone.
- Dry spring – depending on the sowing dates of the crop, from mid-tillering or noding onward, many crops were dependent on reserves of soil moisture and mineral N below 30 cm because the last effective rainfall was in July. This meant that greater than 60 % of the above ground dry matter was grown with adequate moisture from subsoil reserves but limited nitrogen. During grain fill, the low N reserves in the biomass appears to have been sufficient to sustain yield but was not sufficient to maintain protein. After long fallows where there was generally more N in the subsoil, despite denitrification, grain proteins were frequently significantly higher.
- Widespread adoption of varieties that are yield dominant at the expense of grain protein content.
- Apparent low soil N transfer efficiency (% of soil and fertiliser N in the grain) in N Budgets resulting from underestimate of denitrification loss and possible stranding of fertiliser nitrogen during the period of majority of dry matter accumulation.
- Plant tissue analysis for N prior to first node does not appear to provide any information about final protein.
Not all of the above conditions were necessarily active in each case but the widespread seasonal low protein outcomes suggest a number of these conditions were present for many growers in 2012.
How do we avoid or adapt to the low protein challenge?
- Ignore it! The protein price premium signals are not sufficient to forgo yield or chase protein.
- Consider varietal performance in relation to N use. As for pest and diseases select a variety with it reaction to N supply in mind.
- Know your situation – don’t ignore the signs from previous crop outcomes. Frequent occurrence of low protein indicates N supply is not well matched to water supply.
- Recognise that high protein now needs to be a planned outcome and may be less frequently a consequence of the season.
- Measure to manage. Need to consider a range of tools to establish N management strategies, tactics and monitor seasonal progress. Soil testing 3 months before the crop is sown may be a good starting point for seasonal N but it should not be the only consideration.
- Rethink “set and forget” – there is no right rate of N to achieve a particular yield and protein outcome, but there is a range of acceptable and unacceptable yield and grain protein outcomes from N that are available (Figure 8). The outcomes can be biased in positive direction using a combination of paddock and variety selection and judicious use of the 4 Rs (Right Product, Right Rate, Right Timing and Right Placement) for N fertiliser management.
- New fertiliser strategies – higher efficiency products and strategies, application timing for protein only?
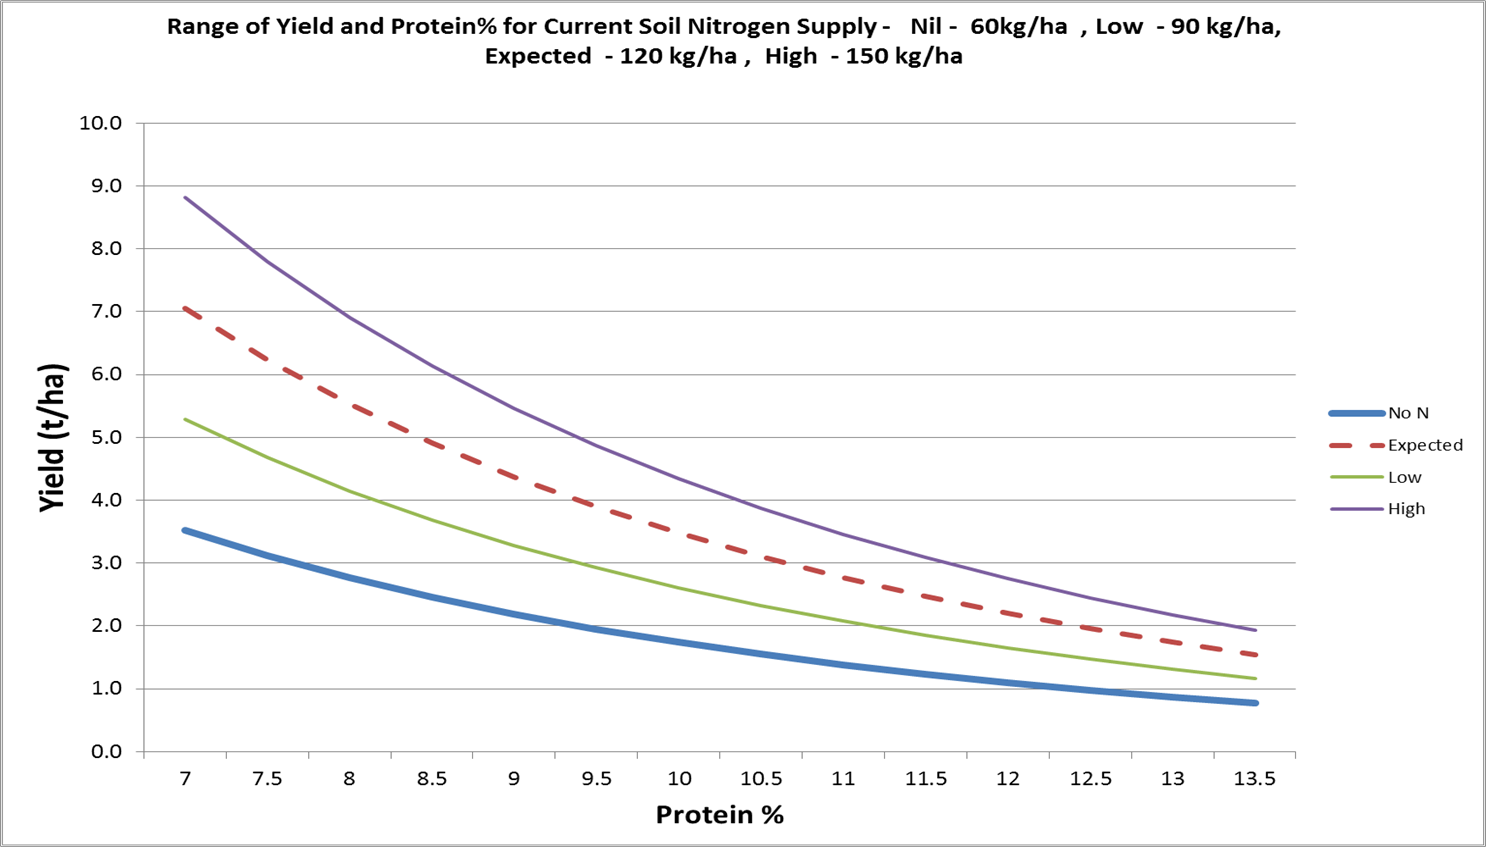
Figure 8: A range of grain yield and protein outcomes based on a range of soil and fertiliser N availability and standard nitrogen transfer efficiencies associated with grain protein%. Total crop N supply 60 (No N added), 90 (Low), 120 (Expected) and 150 (High) kg/ha N.
References
Simpson RJ, Lambers H, and Dalling MJ. 1983. Nitrogen redistribution during grain growth in wheat (Triticum aestivum L.). iv. Development of a quantitative model of the translocation of nitrogen to the grain. Plant Physiol., 71, 7-14
Strong WM 2000 pers. comm.
Contact details
Chris Dowling,
Back Paddock Company
Mb: 0407692251
Fx: 07 38213544
Email: cdowling@backpaddock.com.au
![]() Varieties displaying this symbol beside them are protected under the Plant Breeders Rights Act 1994.’
Varieties displaying this symbol beside them are protected under the Plant Breeders Rights Act 1994.’
Was this page helpful?
YOUR FEEDBACK