Improved understanding of thresholds of armyworm in barley and aphids in canola
Author: Melina Miles, Adam Quade, Richard Lloyd and Paul Grundy, Queensland Department of Agriculture, Fisheries and Forestry | Date: 05 Mar 2014
GRDC code: DAQ00153
Authors
Melina Miles, Adam Quade, Richard Lloyd and Paul Grundy, DAFF Qld
Take home message
The 2013 season demonstrated that the presence of armyworm in above threshold densities did not necessarily result in head lopping and associated crop losses. Increased sampling effort resulted in significant savings in insecticide and application. The beatsheet provides the best overall estimate of armyworm larvae, but the inclusion of soil inspections when sampling for armyworm provides a clearer picture of larval densities and risk to the crop. Predicting the likelihood of damaging head lopping is not possible based on larval density and size alone. The additional factors driving this behaviour are unclear.
Removing late terminal growth on canola racemes (simulated aphid damage) did not result in a reduction in yield at 10, 50 or 100% of racemes treated. The need for aphid management needs to be considered in the context of crop growth and yield potential. Improved knowledge of canola physiology in different regions will be useful in making these assessments.
Armyworm in barley – what we learnt in 2013
Thresholds for armyworm were derived in the 1980s and 1990s, and have not been revisited since then. The origin of the estimate of damage that we currently base the economic threshold on is unknown. The calculation of potential loss, and consequently the economic threshold is as follows:
- armyworm damage is estimated to be 7 heads lopped per day per large larva (= 70 kg/ha at 1 larva/m2 (based on the estimate of 1 lost head per m2 = a loss of 10 kg/ha).
- If a large armyworm larva is active for 7 days, then this is a potential loss of 0.5 t/ha.
- Using these estimates, the economic threshold for armyworm, with variation in grain price, would be as per Table 1.
Grain price ($/t) | Cost of control | |
|---|---|---|
Ground ($15) | Air ($25) | |
200 | 0.15 | 0.21 |
220 | 0.14 | 0.19 |
250 | 0.12 | 0.17 |
270 | 0.11 | 0.16 |
Clearly these threshold estimates are significantly lower than the nominal 2-3 larvae/m2 that is commonly used as a threshold for armyworm in barley. So this season we set out to test the damage potential of armyworm in barley.
What we did this season
To do this we set up a trial where we introduced armyworm larvae at different densities to ‘caged’ sections of crop. The larvae were checked weekly, and new larvae introduced to maintain densities at the required levels. The cage trial yielded no result as the behaviour of the larvae was changed by being physically located. Apparently this has been the experience previously with these types of trials (G. McDonald pers. comm.), which meant we were dependent on monitoring infestations in situ.
To do this we sampled 6 fields weekly in the Crooble and North Star region of NSW, where there were natural armyworm infestations from the vegetative stage until maturity/harvest. Of particular interest was the relative usefulness of the beatsheet, sweep net and digging in providing estimates of armyworm densities. We also looked at the levels of defoliation and other crop damage, and the incidence and potential impact of natural enemies (predators and parasitoids).
Sampling and estimating armyworm densities effectively
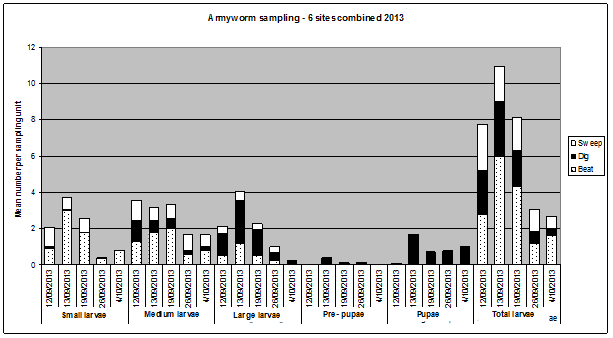
Figure 1 illustrates a number of things relevant to making decisions about armyworm:
- not all larval stages are sampled equally well by a beatsheet and sweep net. Sampling below the canopy, on the soil surface and just below, is critical to getting a good estimate of the number of large larvae in the crop.
Overall the beatsheet was more effective in determining the number of small and medium larvae. The dig (soil sampling) was most effective at determining the number of large larvae. - Neglecting to sample the soil for larvae and pupae not only potentially underestimates the most damaging life stages, but also misses information that would help predict the rate at which larvae are pupating and therefore no longer posing a risk to the crop.
Figure 1. Combined data from across the 6 barley crops showing the relative efficacy of sweep, beatsheet and digging in estimating armyworm numbers through the critical crop stages. Sweep net data is an average of 20-25 x 10 sweeps; beatsheet is an average of 20 x 1m row samples; and digging the average of 10 x 1m row samples each date.

Figure 1 text description: Small larvae was mainly found through the beatsheet method with the sweep method also quite effective in the earlier crop stages. The mean number of small larvae initially increased till the second crop stage and then begins to drop off. Medium larvae show a similar pattern with higher mean numbers found in the early critical crop stages. The beatsheet method was also most effective but both sweep and digging also contributed to about half the medium larvae found. Large larvae was mostly found through digging and again followed a similar mean number per sampling unit by increasing to the second critical crop stage and then decreasing. Very few pre-pupae were found and were only found through digging. Pupae were also only found through digging with the highest number found at the second critical crop stage. The total larvae showed an increase to the highest mean number per sampling unit at the second critical crop stage where it then decreased to the lowest at the final critical crop stage.
Crop damage – head damage and defoliation
One of the 6 sites was treated for armyworm (Crooble 1). This field had larval numbers far in excess of any threshold, the highest levels of defoliation, and visible damage from grazing on grain and awns. In the remaining 5 sites we did not see head lopping although densities and larval age were consistent with the expectation that significant head lopping would occur (Table 2).
Location | Large larvae (/m2) | Total larvae (/m2) | Total number of tillers examined | Number of tillers with feeding damage to awns/grain | % tillers with feeding damage to grain/awns | Number of tillers with heads lopped |
|---|---|---|---|---|---|---|
Crooble 1 | 1.3 | 23 | 1000 | 2 | 0.2 | 0 |
Crooble 2 | 2.6 | 8.6 | 774 | 24 | 3.1 | 0 |
Crooble 3 | 1.3 | 6 | 888 | 3 | 0.3 | 0 |
North Star 1 | sprayed | sprayed | 746 | 44 | 5.9 | 0 |
North Star 2 | 4 | 22 | 938 | 4 | 0.4 | 0 |
North Star 3 | 1.3 | 26 | 1148 | 10 | 0.9 | 0 |
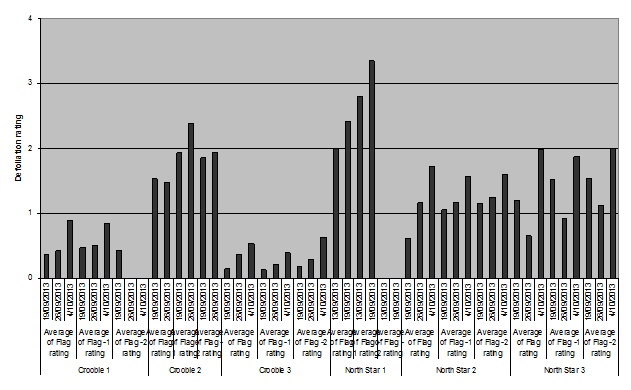
In addition to low levels of grain and awn damage there was considerable leaf feeding, and concern amongst agronomists about the level of defoliation of the flag, flag-1 and flag-2, and the potential impact that may have on grain fill. To determine the extent of the damage, weekly samples were taken from each field and an estimate made of the level of defoliation (Figure 2). What is evident from the data is that the defoliation progressed over the 4-5 weeks that the crops were monitored. Ultimately, there was little difference between the levels of defoliation of the flag, flag-1 and flag-2. The armyworm larvae fed on the available green leaf. The levels of overall defoliation did vary between crops with Crooble 1 and 3 low, and North Star 1 high. There were no consistent growth variations in these crops to explain the differences, nor do the defoliation rates correlate consistently with larval densities.
Figure 2. Rates of defoliation by armyworm of flag, flag-1 and flag-2 at 6 sites in Northern NSW, 2013. (Defoliation rating 0 = 0%; 1=1-24%, 2=25-49%, 3=50-74; 4=75-99; 5=100).

Figure 2 text description: The highest rates of defoliation were seen at the North Star 1 site in flag-1 ratings. Crooble 2 showed the next highest rates of defoliation also in the flag-1 rating. North Star 2 and North Star 3 had similar defoliation rates across their sites. Crooble 1 had quite low defoliation and Crooble 1 had the lowest defoliation across the 6 sites. Most sites showed the same pattern of an increase in defoliation from the first date sample to the last at each flag rating. Crooble 1 flag-2 rating showing defoliation at the first date but then showed 0% defoliation at the second and third date samples. North Star 1 flag-2 rating did not show any defoliation at any sample date.
Natural enemies (beneficials)
The predators recorded were largely species we associate with aphid infestations, as the majority of the sites had had some aphids earlier in the season. However, it is likely that some of these species may contribute to the mortality of armyworm eggs and small larvae. The most frequently encountered species included the lacewings, ladybeetles, and hoverflies. Overall numbers averaged 0.5 – 5 per square metre.
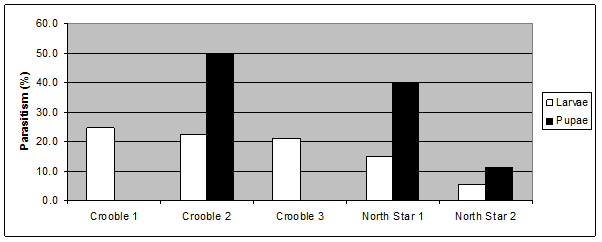
Parasitoids, although much less visible, had a significant impact on the armyworm populations. Figure 3 shows the level of larval parasitism ranging from 5 – 25% of collected larvae (50 per site), and 10-50% for pupae (<10 per site).
The contribution of these predators and parasitoids to the suppression of armyworm, helicoverpa and other potential pests both in the barley and successive summer crops is potentially valuable.
Figure 3. Levels of larval and pupal parasitism recorded from armyworm infestations in Northern NSW, 2013.

Figure 3 text description: Crooble site 1 showed approximately 25% parasitism on larvae. Crooble site 2 showed approximately 22% parasitism on larvae and approximately 50% parasitism on pupae. Crooble site 3 showed approximately 21% parasitism on larvae. North Star site 1 showed approximately 15% parasitism on larvae and approximately 40% parasitism on pupae. North Star site 2 showed approximately 5% parasitism on larvae and approximately 11% parasitism on pupae.
Impact of aphids on canola
The cabbage and turnip aphids colonise the terminals and flowering and podding racemes of canola. When infestations develop rapidly they retard or prevent the development of the raceme where the colony is located. Visually, it appears that the aphids are limiting the flowering and podding capacity of the infested racemes. Infestations are typically patchy in a field with many racemes uninfested. Infestations tend to occur late in flowering once the crop has already set the bulk of the pods. The patchiness of infestations combined with the difficulties associated with sampling a crop adequately, has resulted in significant uncertainty about aphid management.
The only empirical threshold information available to guide agronomists and growers is from trial work in WA in the 1990s. Early work showed very high levels of infestation (up to 100% of racemes) resulted in no yield or oil content loss if the crop had adequate moisture. This work makes clear reference to the capacity of the crop to compensate (adequate moisture, limited insect and disease stresses). Current threshold recommendations are to control when 20% of racemes are infested – no reference to compensation.
Australia is relatively unique in controlling aphids in canola. In Canada and North America, for example, it is pest that is considered of little consequence in most seasons. Primarily this is because aphids are only considered potentially damaging if they infest crops during flowering and early pod set. Although later infestations may prevent the further growth of raceme, it is considered unlikely that this portion of the raceme would have contributed to yield. The contribution of natural enemies (beneficials) to the suppression and control of aphid populations is a major factor in considering if insecticidal control is warranted.
This season we established three trials to attempt to quantify the compensatory capacity of a dryland canola crop when subjected to artificial damage. Artificial damage is used because of the difficulties in maintaining aphid infestations in the field (usually decimated by natural enemies).
The results of the trial that most closely simulates late aphid infestation are presented here (Table 3). In this replicated plot trial, we attempted to simulate the impact of late aphid infestation by preventing the ongoing development of the racemes. The damage was simulated by removing the terminals from the racemes at 23 days after first flower. The treatments were different levels of damage applied to each plot (10%, 50% and 100%) of racemes damaged by terminal removal (cutting at least 25mm of stem). Plots were kept free of aphids and helicoverpa until harvest. Plots were hand harvested with a plot thresher. Yield was assessed for each plot as was oil content and plant architecture.
The results for yield are in Table 3, and show no significant differences between the treatments. We do not yet have the oil analysis results.
Treatment | Yield (t/ha) |
|---|---|
Control | 2.07 a |
10% of terminals removed | 1.93 a |
50% of terminal removed | 1.98 a |
90% of terminal removed | 2.01 a |
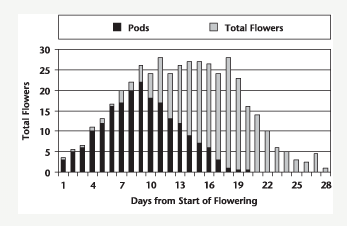
This result shows that the loss of primary reproductive structures in canola does not directly result in yield loss. In this trial it is likely that the later flowers that were removed in these treatments would have contributed relatively little to yield and their removal had no impact on yield. This outcome is consistent with flower – pod set data presented in Figure 4.
Figure 4. Total flowers produced, and productive pods formed, B. napus.
Source: Canola Council of Canada. Canola Grower’s Manual. Chapter 3: Growth Stages.

Figure 4 text description: There is an increase in the amount of pods formed till about the 9th day from start of flowering, then the number of pods formed decreases till no more pods are formed after the 21st day from start of flowering. After the peak in number of pods formed, the total flowers formed begins to increase to a peak at the 18th day from start of flowering where it steadily decreases till the 28th day from start of flowering.
What don’t we know that would help in managing aphids in canola?
An understanding of canola crop physiology and what can reasonably be expected from the varieties in the different growing regions is desperately needed. Until an agronomist can make a reasonable assessment of what the crop potential is, how the crop is responding to the environmental conditions and what compensatory ability it has, it is extremely difficult to make decisions about the likely impact of late aphid infestations on crop yields.
In the absence of thresholds, an assessment of whether the canola crop is likely to have the capacity to continue to set harvestable pods should be made when aphid infestations are detected. In conjunction with an assessment of natural enemy activity, this information can be used with greater confidence in the northern region than a fixed threshold derived in a very different environment and with different varieties.
Acknowledgements
We are extremely grateful to the agronomists who alerted us to the armyworm outbreak and held their nerve long enough for us to collect this data. We are also grateful to the growers who allowed us to regularly sample their fields and take samples. In particular Tim Thorne (Allora) who accommodated the compensation trial in his crop. The processing of samples was a tedious undertaking and assistance was provided to the authors by Jamie Hopkinson, Samuel Rojas Ponce and Thomas Noble.
We acknowledge the financial support for this work from the GRDC and DAFF Queensland.
Contact details
Melina Miles
DAFF Queensland
Ph: 07 46881369
Mb: 0407 113 306
Fx: 07 46881199
Email: melina.miles@daff.qld.gov.au
GRDC Project Code: DAQ00153,
Was this page helpful?
YOUR FEEDBACK
