Deep phosphorus soil testing on the darling downs
| Date: 02 Mar 2015
Some data and a call to action for best practice
Bede O’Mara, Incitec Pivot Fertilisers, Toowoomba
Take home messages
- A very low proportion of samples from the Central Darling Downs have been analysed for Deep P. Is this representative of the Northern Grains Region?
- “Test to know” and “measure to manage” for better understanding of agronomic and economic responses to deep placed fertiliser.
- Soil sampling strategies for both surface and subsoil should be consistent and repeatable to allow critical analysis of results over time (N, P, K & S).
- Be mindful of previous P fertiliser band locations for accurate sampling
Background
The rundown of phosphorus (P) & potassium (K) in the subsoil increases the importance of placing these nutrients in the zone where moisture and active root growth is most likely. The compromise is the energy cost in placing nutrients at depth and the associated moisture loss – these factors suggest that a single application for a number of crops may be the solution. Quantification of these factors and associated economics are ongoing.
Soil characteristics of the intensive cropping region of the Darling Downs in Southern Queensland have been widely studied. Soil water, bulk density, pH, subsoil constraints and mobile nutrients such as nitrogen and sulphur are well understood. Most historical or published data also has baseline data and trends over time for most soils in the region. But, most of the P data has been from the surface layer, to the old plough layer as an artefact from our conventional farming days.
Case study area
The Nutrient Advantage® Laboratory Services (NALS) data presented here is from the Central Darling Downs region, spanning the last five years (i.e. 2009-2014).
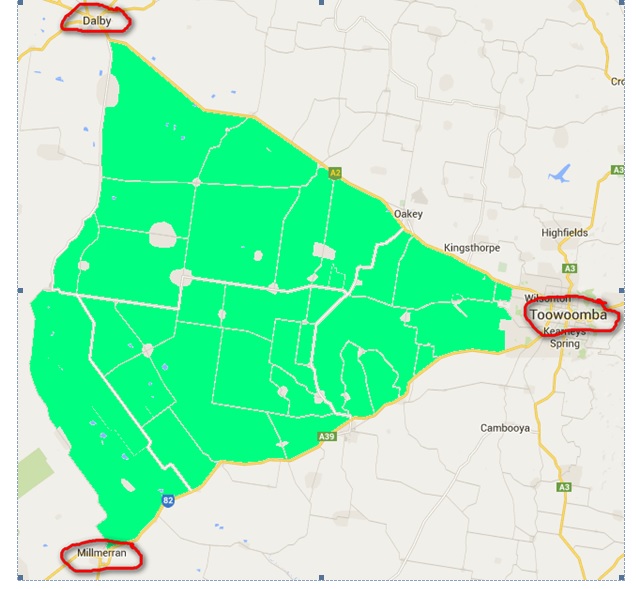
Figure 1. Case Study Area: Toowoomba north west to Dalby (following the Warrego Highway), south west to Cecil Plains, south to Millmerran, and north east back to Toowoomba (following the Gore Highway.
Soil sample data
Measuring P in the 10-30cm depth layer gives growers and advisers a better understanding of how much phosphorus the plant can access (Bell et al 2010).
A first step in predicting responses in in understanding what is down there. NALS soil samples from the case study area from 1 January 2009 to 30 September 2014 were examined. Approximately 750 samples were tested for phosphorus. This data set was further filtered for depth sampled and method of P extraction.
In the case study area, only 9% of those soils sampled were tested for any of the relevant phosphorus extraction methods from below 15cm in the soil profile (figure 2).
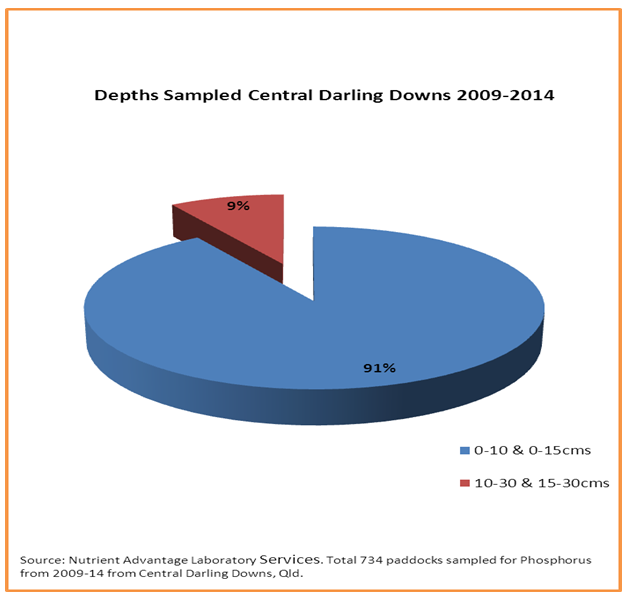
Figure 2. Distribution of depths sampled (i.e. surface vs sub-surface)
Further, when examining the proportion of actual phosphorus extraction methods utilised, whilst 100% of samples were tested for Bicarbonate extractable (Colwell) phosphorus, just 15% of surface samples were tested for acid extractable BSES P at all (figure 3).
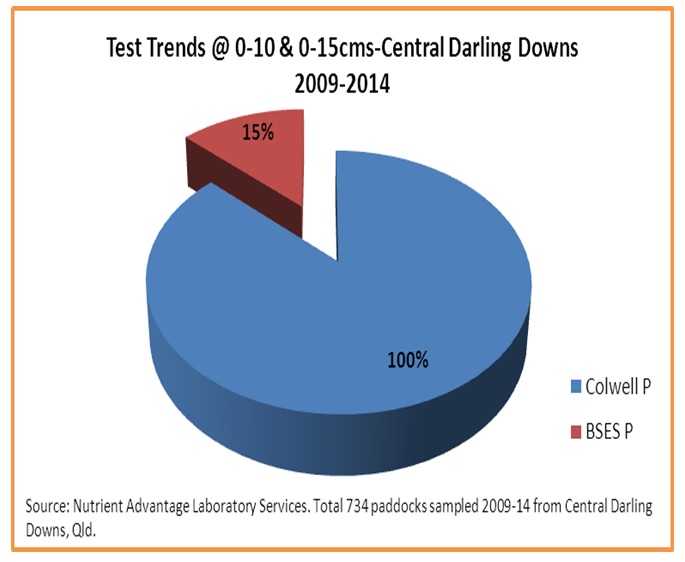
Figure 3. Proportion of surface phosphorus tests
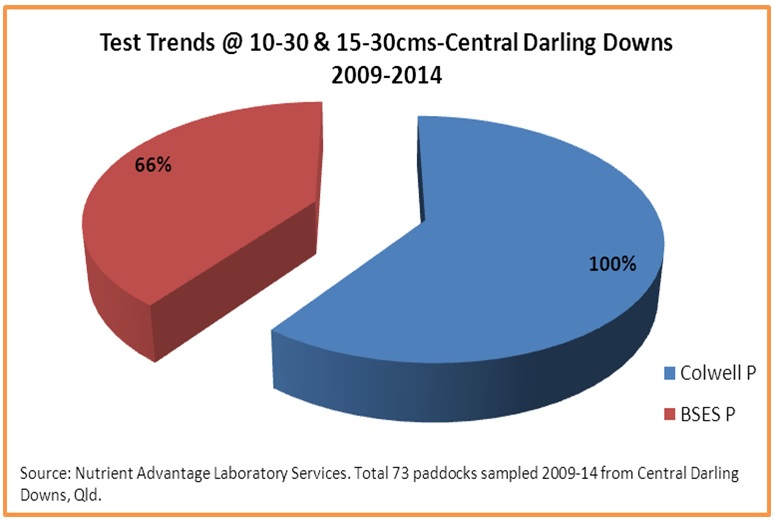
Figure 4. Proportion of sub-surface phosphorus tests
All subsoil samples (>10 cm) were tested for Bicarbonate extractable (Colwell) phosphorus, while 66%of samples were also tested for acid extractable BSES P (figure 4).
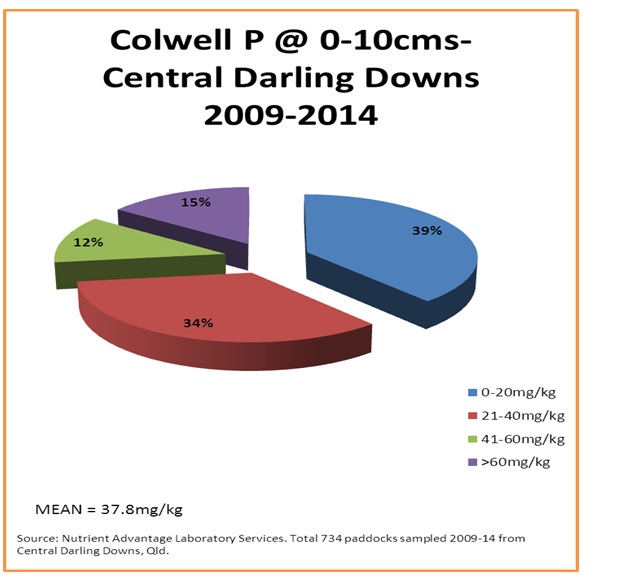
Figure 5. Surface bicarbonate extractable (Colwell) phosphorus levels (mg/kg) from the case study area
Approximately 40% of surface samples may be responsive to starter phosphorus applications at planting (figure 5) and , from those same soils, little evidence of accumulation of much phosphorus greater than crop removal is occurring (figure 6) where the acid extractable BSES P analysis method is being used as a measure.
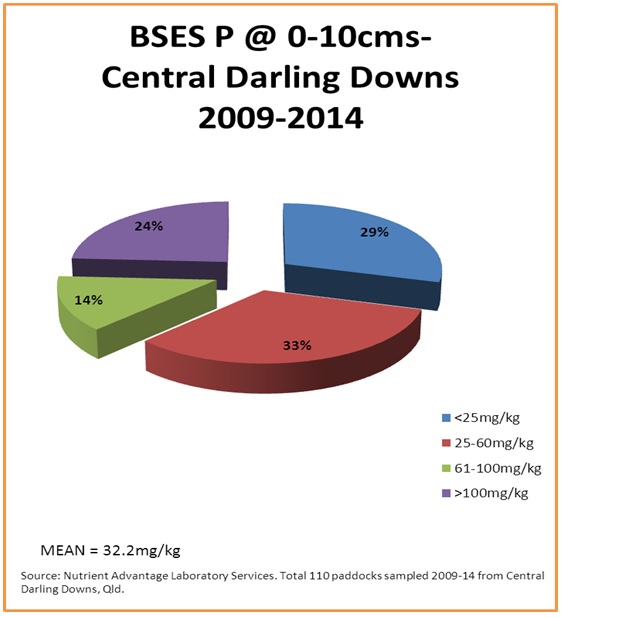
Figure 6. Surface soil acid extractable BSES P (mg/kg) from the case study area
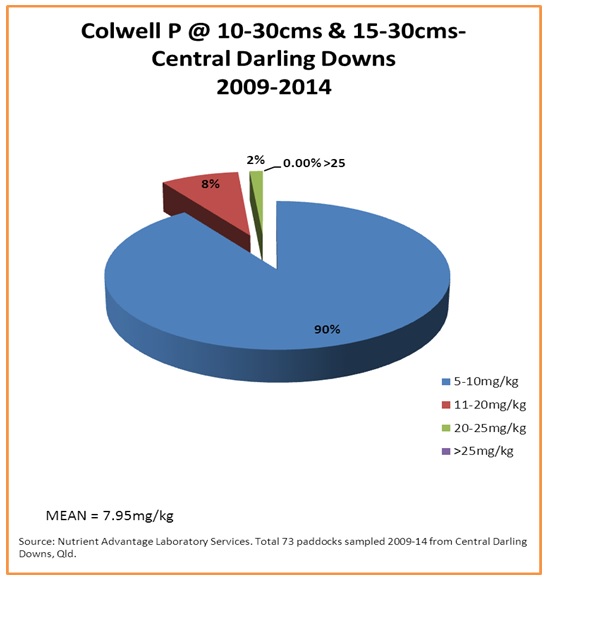
Figure 7. Sub-surface bicarbonate extractable (Colwell) phosphorus levels (mg/kg) from the case study area
Figure 7 shows that 90% of sub-surface samples from the 73 paddocks that were sampled at those depths were critically low in bicarbonate extractable (Colwell) phosphorus. Figure 8 shows that the situation is similar for soil acid extractable BSES P at the sub-surface depths, where levels are quite low.
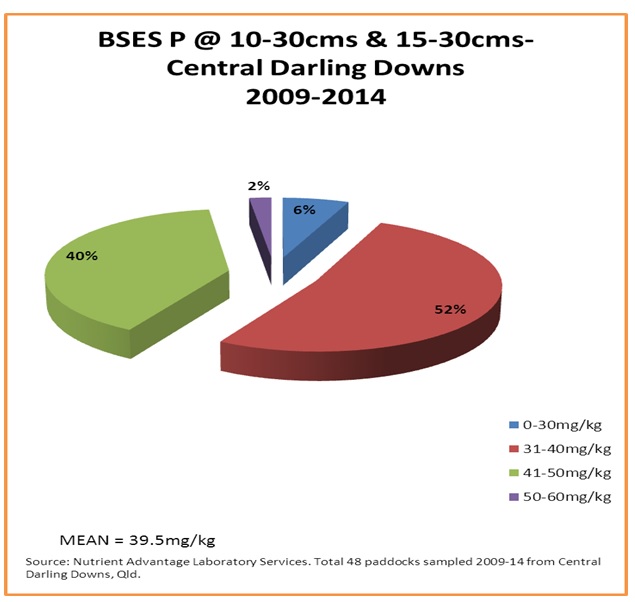
Figure 8. Sub-surface soil acid extractable BSES P (mg/kg) from the case study area
With mean PBIs from this data at 174 and 158 for the surface and sub-surface layers respectively, and according to Guppy and Bell (2013), the mean of these sub-surface samples suggest a likely positive response from these PBIs to deep applied phosphorus fertiliser, providing other phosphorus extraction methods align in the responsive ranges.
NOTE: The likelihood of agronomic and economic responses to deep P should be assessed using paddock specific soil analysis and fertiliser test strips. Trend analysis of BSES P over time is a crucial part of developing a profile phosphorus strategy, combined with knowledge of PBI.
Best practice soil sampling protocol
Distribution of sample locations for cores
Which direction of travel and method for sampling is appropriate to you? Various methods exist, each having its own pros and cons but consider which is most appropriate for you, your equipment or vehicle, the grower and type of country being sampled.
- Zig-zag
- Zonal
- Transect
- Cluster
- Grid
- Monitoring site (repeatedly used & geo-referenced)
What is a representative sample?
Soil cores must be taken from across the same soil type under the same management. If not, interpretation (without knowledge of differing factors) is difficult.
Surface & sub-soil
Peverill et al (1999), suggest that the number of cores required to gain a representative sample is from the surface is:
- approximately 30-40 cores for the surface 0-10 or 0-15cm layer,
- or a minimum of 10-20 cores at this depth (where no ameliorant or fertiliser has been used).
For the deeper sub-surface or sub-soil, they suggest:
- 30-40 cores
Where to sample in relation to previous P fertiliser bands?
With the adoption of precision placement and GPS farming techniques, it is relatively simple to identify where recent P fertiliser bands have been applied. This is particularly relevant when developing starter P fertiliser recommendations, and equally as important for monitoring the rundown of nutrients from deep placed fertiliser.
Kitchen, Westfall and Havlin (1990) identify methodologies to accurately incorporate and mix cores from within and outside of recent P fertiliser bands:
- Core through centre of most recent fertiliser band
- Dilute this with cores taken from outside the band
- To determine the number of cores outside the band to mix with those from within the fertiliser band: multiply row spacing(cm) x 0.262
Table 1. Ratio of cores to mix from within the previous phosphorus fertiliser band with those from outside
(adapted from Kitchen, Westfall & Havlin, 1990)
|
Row Spacing
(centimetres)
|
Ratio of number of cores to mix
Away from fert band: From fert band
|
|---|---|
| 20 | 5:1 |
| 25 | 7:1 |
| 30 | 8:1 |
| 35 | 9:1 |
| 40 | 10:1 |
| 45 | 12:1 |
| 50 | 13:1 |
| 60 | 16:1 |
| 75 | 20:1 |
| 100 | 26:1 |
| 150 | 39:1 |
| 200 | 52:1 |
Conclusion
Ensure soil sampling methods (surface and depth) are consistent and repeatable, by adopting tools and techniques widely available to assist in the process. Value the potential $ outlay to be spent if the adoption of Deep P is appropriate, by applying some scientific rigour and professionalism to the sampling process.
Take home messages
- “Test to know” and “measure to manage” for better understanding of likely agronomic and economic responses deep fertiliser placement.
- Soil sampling strategies for both surface and subsoil should be consistent and repeatable to allow critical analysis of results over time (N, P, K & S).
- Be mindful of previous P fertiliser band locations for accurate sampling
Acknowledgements
Thanks to Craig Jamieson, Incitec Pivot Fertilisers, Werribee, Victoria for provision of Nutrient Advantage® Laboratory Service (NALS) raw data.
References
Bell, M, Cox, H., Harch, G., O’Mara, B., Pilcher, S., Smith, L. and Want, P. (2010) ‘Improving phosphorus fertiliser management on southern Queensland grain farms’. DEEDI, Brisbane.
Guppy, C. and Bell, M. (2013) ‘Soil testing for crop nutrition’ in Crop Nutrition Fact Sheet. GRDC, Canberra.
Soil Sci. Soc. Am. J. 1990. 54:1661–1665.
Kitchen, N. R., Westfall, D. G. & Havlin, J. L.(1990) Soil Sampling under No-Till Banded Phosphorus
O’Mara, B. (2014) ‘Economics and Management of P nutrition and multiple nutrient decline’, GRDC Update Proceedings 2014, Goondiwindi.
Peverill, K.I., Sparrow, L.A. & Reuter, D.J. (1999) ‘Soil Analysis: An Interpretation Manual’, CSIRO Publishing, Collingwood, Victoria.
Contact details
Bede O'Mara
Incitec Pivot Fertilisers
Ph: 0417 896 377
Fx: 07 4690 6810
Email: bede.omara@incitecpivto.com.au
Reviewed by
Charlie Walker & Jim Laycock.
Incitec Pivot Fertilisers is a business of Incitec Pivot Limited, ABN 42 004 080 264.
Nutrient Advantage® is a registered trademark of Incitec Pivot Limted.
Was this page helpful?
YOUR FEEDBACK