How long does it take to reduce Pratylenchus thornei (Root lesion nematode) population in the soil?
Author: Jeremy Whish (CSIRO) and John Thompson (University of Southern Queensland) | Date: 23 Feb 2016
Take home message
- Know your soil’s Root-lesion nematode (P. thornei) population size
- Test your soil for Root-lesion nematodes. P. thornei populations greater than 40,000 per kg at harvest will requires a double break of around 40 months free of a host to reduce the population below the accepted threshold of 2000 Pt/kg. P. thornei populations greater than 10,000 per kg at harvest will requires a single break of around 30 months free of a host to reduce the population below the accepted threshold of 2000 Pt/kg
- Weeds can be a host so fallows must be weed free and free of volunteers
Background
The root-lesion nematode Pratylenchus thornei (Pt) is a major pest of cereal and pulse crops on the heavy clay textured soils of the northern grains region of eastern Australia. P. thornei has a broad host range covering many cereals and pulses (Castillo and Vovlas, 2007; Nicol and Rivoal, 2008) highlighting its economic importance as a major pathogen of grain production worldwide. In Australia, yield losses in intolerant wheat varieties as a result of P. thornei have been estimated at between 44 and 80% (Thompson, 2008; Thompson et al., 2012), resulting in an estimated annual cost to the industry of $38 million (Murray and Brennan, 2009). Genetic control by breeding tolerant and resistant varieties has been considered the best long-term approach for this pathogen (Thompson et al., 1999). Wheat lines with superior tolerance have been developed, which has meant the regional wheat yield potential has continued to be achieved. However, tolerant varieties can continue to increase the nematode population, creating high pathogen levels in the soil and posing a serious risk to other host crops that do not have tolerant or resistant lines available.
How long does it take a P.thornei population to decline in the absence of a host?
Fallowing or the use of consecutive non-host crops such as sorghum (O'Brien, 1983) has the potential to significantly reduce P. thornei populations (Owen et al., 2014; Thompson et al., 2012) . However, this can take a long time and never completely eliminate the pest as low numbers of P. thornei were still present in soils fallowed continuously for 8 years (Peck et al., 1993). This is in contrast to another Pratylenchus species (P. coffeae) where an 11-month absence of a host reduced the population to zero (Trinh et al., 2011). To understand the rate of decline in a nematode population we monitored different starting populations for a 30 month host free period in a Vertosol on the Darling Downs at Formartin.
What we did
Following two consecutive wheat crops using wheat cultivars with different levels of tolerance and resistance a range of nematode populations were created in the soil. At the harvest of the second wheat crop the nematode population from each plot was recorded and characterised as high, (H >20,000Pt/cm2/1.2m profile), medium (M >10,000Pt/cm2/1.2m profile), low (L >5,000Pt/cm2/1.2m profile) and very low populations (VL <5,000Pt/cm2/1.2m profile) calculated as the sum of nematodes across the whole profile. Over the next 30 months soil samples were collected from these plots to monitor the change in nematode population over time. Two 1.8 m soil cores were collected from each plot and divided into 8 layers (the top four being of 15 cm and the bottom four of 30 cm). Nematodes were extracted from the soil and manually counted to give a live nematode population estimate for each soil layer. The rotation over the 30 months was, long fallow from wheat to sorghum then long fallow from sorghum to wheat. In the fallow commencing in 2011 no sorghum was sown due to drought.
Our results
In this experiment, the majority of nematodes resided in the soil surface layers. Over the 30 months without a host crop the bulk of the populations reduced to below the damage threshold of 2000/kg or ~2/cm3. The majority of the reduction occurred in the surface layers (Figure 1). The 0-15 cm layer at the surface showed the fastest decline in population numbers (Figure 2).
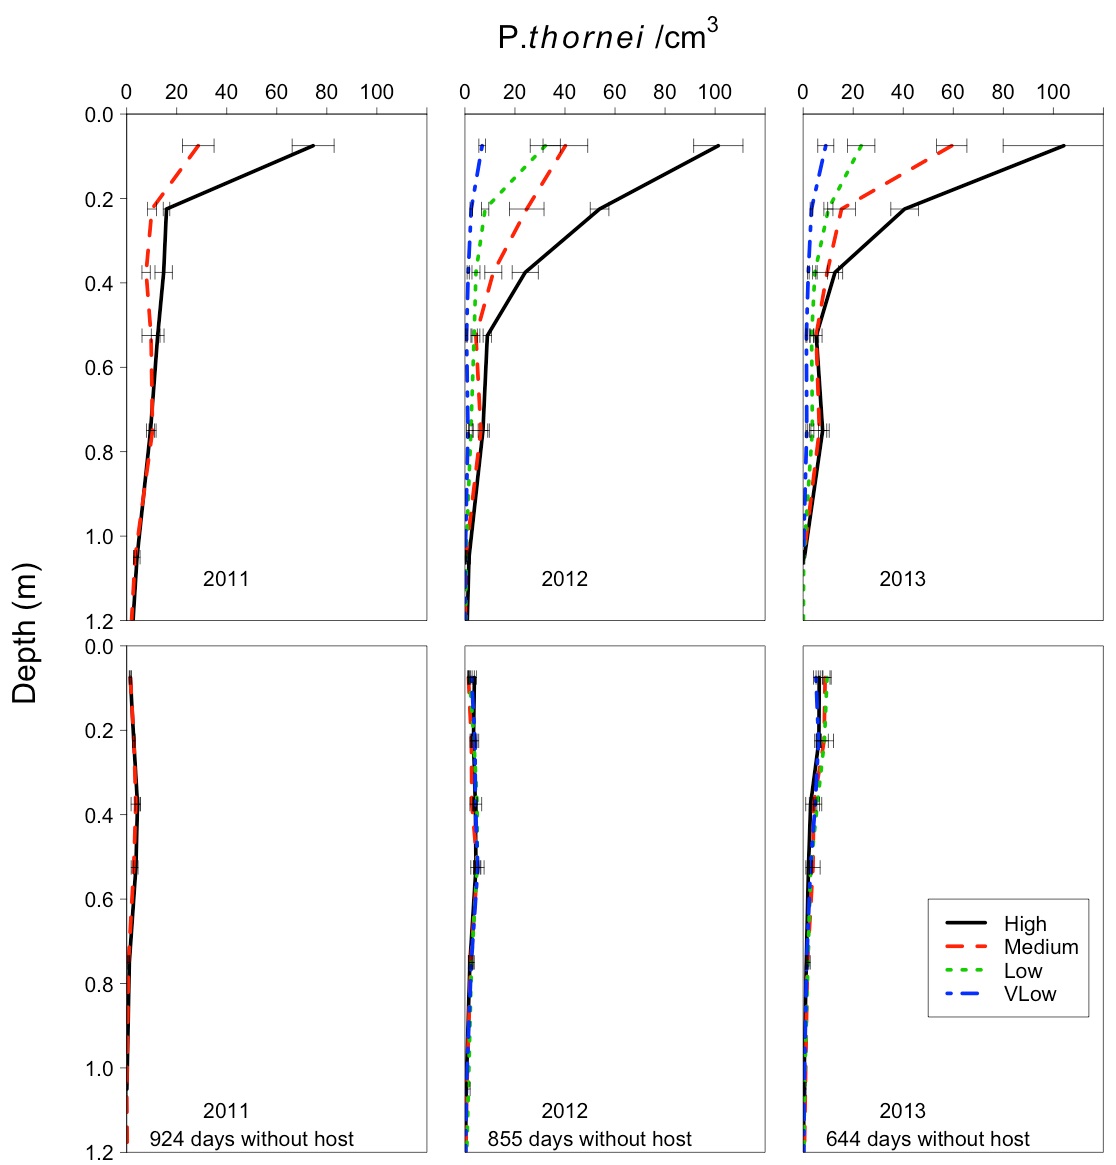
Figure 1. Distribution of Pratylenchus thornei at the start (top row) and end (bottom row) of the three non-host long fallows. The different lines indicate the different starting population classes (High,H >20,000Pt/cm2/1.2m profile), medium (M >10,000Pt/cm2/1.2m profile), low (L >5,000Pt/cm2/1.2m profile) and very low population (VL <5,000Pt/cm2/1.2m profile) calculated as the sum of nematodes across the whole profile. Standard errors are indicated for each sampling point.
To understand the rate of decline or how many nematodes died per day a negative exponential function was applied to the data (Figure 2) which went part way to describe the observed data. Note how a sharp drop occurs in the surface layer but not in the second or third layer population densities.
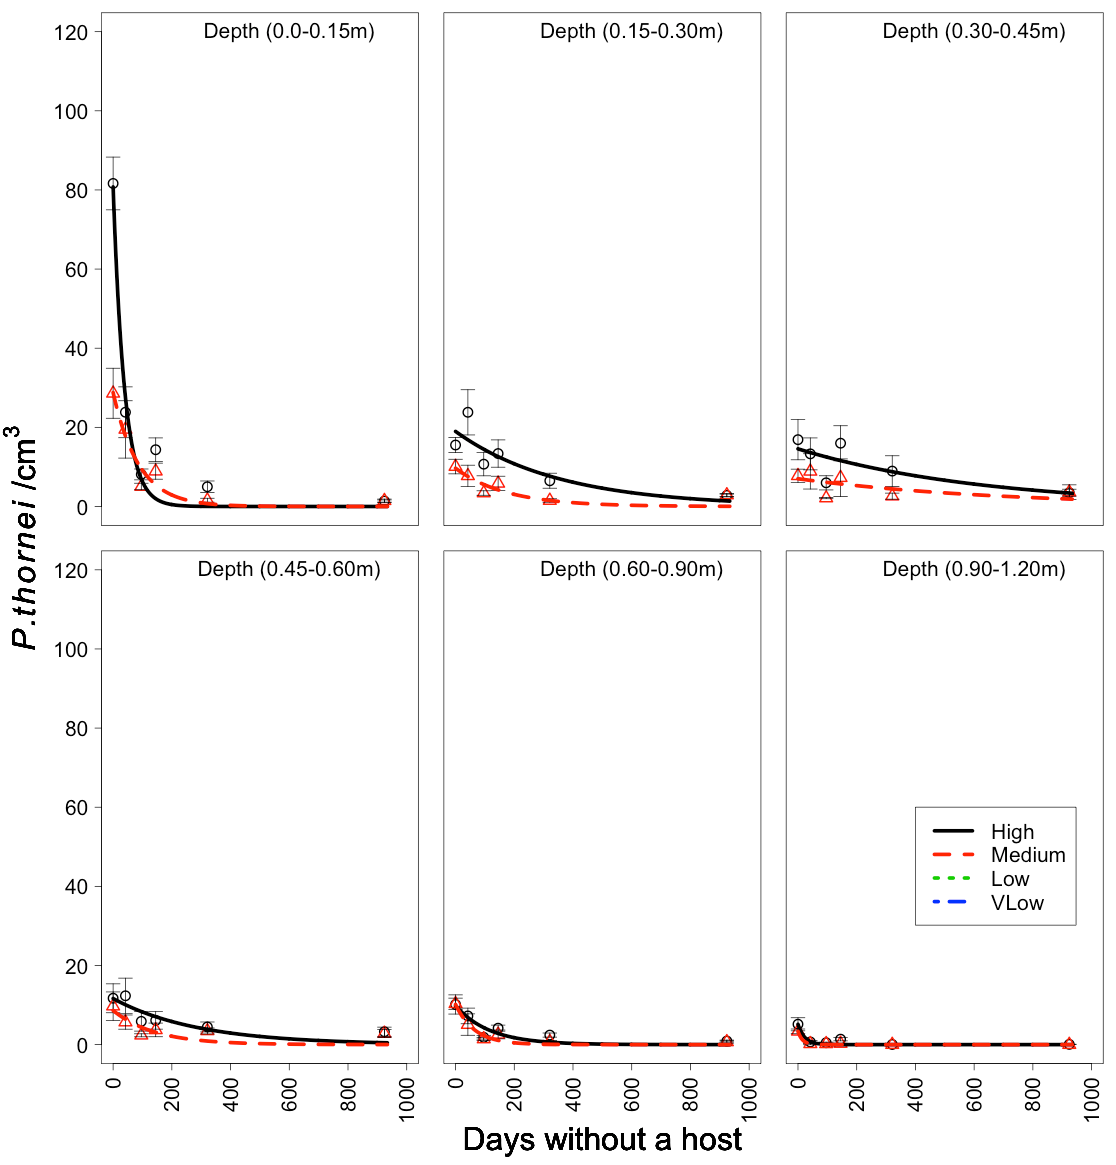
Figure 2. The negative exponential function Y=ae-bt, where y = nematode density per soil layer, t = time in days , a = the intercept and b = the slope parameter, fitted to the high and medium population data at each soil layer over the 30-month fallow commencing in November 2011. Standard errors are presented for each of the observed population measurements.
A similar rate of decline was found in each of the non-host periods for each layer. This information was combined with knowledge of temperature and moisture to build a dynamic nematode decline model that worked with APSIM. The completed model was tested against the observed data. The observed predicted regression (Figure 3) shows the model accounted for 95% of the error. The predicted model curves highlight how the inclusion of dynamic modelling or temperature and moisture combined with age class mortality rates of the different nematode life stages improved the prediction in the early stages of the fallow (Figure 4).
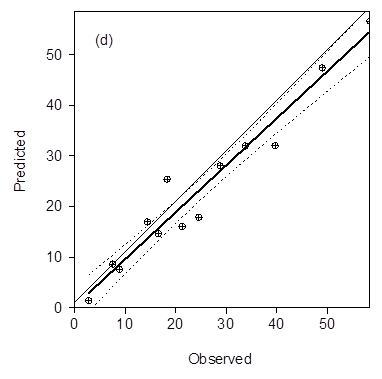
Figure 3. The observed predicted regression (Fig. 1d) shows good correlation between the observed and predicted data, y = 0.93x + 0.28, R2=0.94.
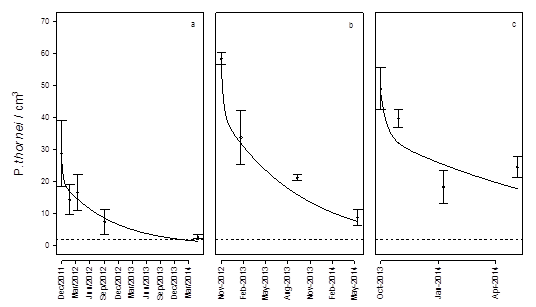
Figure 4. The observed (points) and predicted (line) population data declining from maximum population at harvest of the preceding wheat crop and the decline over the break. The longest decay curve (a) included a non-host sorghum crop sown in October 2012. The shorter curve (b) commenced in November 2012 and there was no sorghum crop planted due to drought. The final curve (c) commenced in 2013 and had a sorghum crop planted in October 2014. The dashed horizontal line represents the damage threshold below which minimal yield loss will occur in a susceptible wheat crop.
Using the developed model, the time taken to reduce different sized nematode populations to below the damage threshold of 2000 nematodes per kg was calculated (Figure 5).
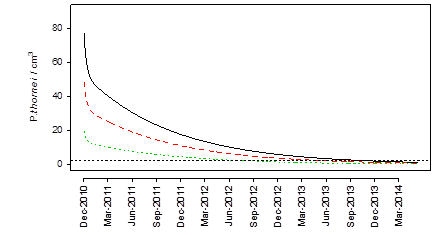
Figure 5. The effect of starting population (80 Pt/cm3 ~80,000/kg, solid black line; 50 Pt/cm3 ~50,000/kg, dashed red line; 20 Pt/cm3 ~20,000/kg , dotted green line) on the time taken for the P. thornei population to reduce below the economic threshold.
So what?
The scenario analysis (Figure 5) highlighted the importance of the initial population when reducing nematode populations below the damage threshold. High population of 80 nematodes per cm3 (~80,000 Pt/kg) took four years to reduce below the threshold. This would require 2 non host crops such as sorghum and fallows to reduce the population. A moderate initial population of 50 nematodes per cm3 took three and a half years (Figure 6), requiring the equivalent of a single non host summer crop and fallows. A population of 20 nematodes per cm3 took 24 months. The long survival mechanisms of root-lesion nematodes highlight the importance of knowing the size of the population at the end of each season. Once a population increases, non-host, resistant crops or fallows are required to reduce the population below the damage threshold. Planting susceptible or tolerant crops within this time period will increase populations to higher levels that will take longer to reduce, thereby limiting cropping options, and potentially reducing the profitability of the overall farming system. As resistant wheat varieties are released they can be used to provide a winter decline option to increase non-host periods within the rotation.
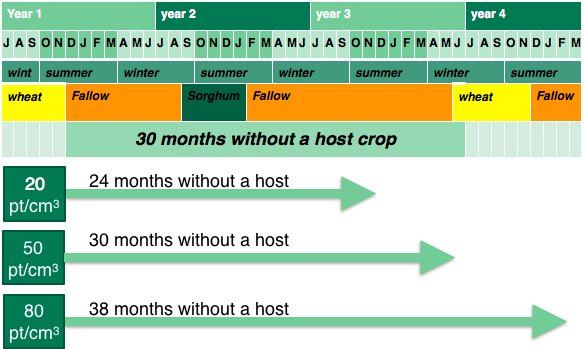
Figure 6. An example of a non-host fallow showing the time required to reduce different starting populations of root-lesion nematode.
Where to next?
Further testing of the model is required to ensure it captures the influences of different soils, soil temperatures and moisture conditions. Understanding the survival mechanisms of P. thornei and what causes the initial sharp decline may provide some insight into tactical ways to reduce populations faster and maintain low populations for longer.
References
Castillo P., Vovlas N. (2007) Pratylenchus (Nematoda: Pratylenchidae): Diagnosis, biology, pathogenicity and management. Chapter 7. In Biology and ecology of Pratylenchus. Nematology Monographs and Perspectives Series 6. pp. 305–324 Eds D.J. Hunt, R.N. Perry, Leiden-Boston:Brill,.
Murray, G.M., Brennan, J.P., 2009. Estimating disease losses to the Australian wheat industry. Austral. Plant Pathol. 38, 558–570. doi:10.1071/AP09053
Nicol, J.M., Rivoal, R., 2008. Global Knowledge and its Application for the Integrated Control and Management of Nematodes on Wheat, in: Mukerji, K.G. (Ed.), Integrated Management and Biocontrol of Vegetable and Grain Crops Nematodes. Springer, pp. 251–283.
O'Brien, P., 1983. A Further Study on the Host Range of Pratylenchus thornei. Austral. Plant Pathol. 12, 1. doi:10.1071/APP9830001
Owen, K.J., Clewett, T., Bell, K., Thompson, J.P., 2014. Wheat biomass and yield increased when populations of the root-lesion nematode (Pratylenchus thornei) were reduced through sequential rotation of partially resistant winter and summer crops. Crop Pasture Sci. 65, 227–15. doi:10.1071/CP13295
Peck, D.M., Thompson, J.P., Clewett, T., Haak, M.I., 1993. The root lesion nematode Pratylenchus thomei survives extended clean fallows and build up quickly with wheat cropping, in:. Presented at the th Biennial APPS Conference Hobart, July -th,, pp. 29–32.
Thompson, J.P., 2008. Resistance to root-lesion nematodes (Pratylenchus thornei and P. neglectus) in synthetic hexaploid wheats and their durum and Aegilops tauschii parents. Aust. J. Agric. Res. 59, 432. doi:10.1071/AR07222
Thompson, J.P., Brennan, P., Clewett, T., Sheedy, J.G., Seymour, N., 1999. Progress in breeding wheat for tolerance and resistance to root-lesion nematode (Pratylenchus thornei). Austral. Plant Pathol. 28, 45–52.
Thompson, J.P., Zwart, R.S., Butler, D., 2012. Inheritance of resistance to root-lesion nematodes (Pratylenchus thornei and P. neglectus) in five doubled-haploid populations of wheat. Euphytica 188, 209–219. doi:10.1007/s10681-012-0689-x
Trinh, P.Q., Wesemael, W.M.L., Nguyen, C.N., Moens, M., 2011. Decline of Pratylenchus coffeae and Radopholus arabocoffeae populations after death and removal of 5-year-old arabica coffee (Coffea arabica cv. Catimor) trees. Nematology 13, 491–500. doi:10.1163/138855410X528505
Acknowledgements
The research undertaken as part of this project is made possible by the significant contributions of growers through both trial cooperation and the support of the GRDC, CSIRO and the University of Southern Queensland, and the authors would like to thank them for their continued support.
Contact details
Jeremy Whish
CSIRO
Ph: 07 46881419
Email: Jeremy.whish@csiro.au
Reviewed Neal Dalgliesh and Kirsty Owen
GRDC Project Code: CSE00055,
Was this page helpful?
YOUR FEEDBACK
