Methods and tools to characterise soils for plant available water capacity (Coonabarabran)
Author: Kirsten Verburg, Brett Cocks, Tony Webster, Jeremy Whish (CSIRO) | Date: 03 Feb 2016
Take home message
- Information regarding the plant available water (PAW) at a point in time, particularly at planting, can be useful in a range of crop management decisions. Estimating PAW, whether through use of a soil water monitoring device or a push probe, requires knowledge of the plant available water capacity (PAWC) and/or the Crop Lower Limit (CLL)
- A wide variety of soils in the northern region have been characterised for PAWC and the characterisations are publicly available in the APSoil database, which can be viewed in Google Earth and in the ‘SoilMapp’ application for iPad
- The field-based method for characterising PAWC has been tried and tested across Australia, but users need to be mindful of common pitfalls that can cause characterisation errors
- Knowledge of physical and chemical soil properties like texture or particle size distribution and (sub) soil constraints helps interpret the size and shape of the PAWC profiles of different soils. It can also assist in choosing a similar soil from the APSoil database
- Extrapolating from the point-based dataset to predict PAWC at other locations of interest is a challenge that needs further research. Preliminary analyses drawing on soil landscape mapping (NSW) and land resource area (LRA) mapping (Queensland) suggest that an understanding of position in the landscape and the story of its development may assist with extrapolation. This is because in many landscapes the soil properties determining PAWC are tightly linked to a soil's development and position in the landscape and these same aspects underpin soil and land resource surveys
- While the concept of using soil-landscape information to inform land management is not new (e.g. Queensland land management manuals draw on the same concept), the availability of these maps on-line makes them more accessible and assists with visualising a location’s position in the landscape. Combining these maps with the geo-referenced APSoil PAWC characterisations will increase the value that both resources can provide to farmers and advisors
- Uncertainty of PAWC estimates translates into uncertainty in PAW. The extent to which this affects potential decision making depends on the question asked, but also needs to be viewed in terms of the spatial variability in PAW and the accuracy of the method to convert this water into a yield forecast
Plant available water and crop management decisions
A key determinant of potential yield in dryland agriculture is the amount of water available to the crop, either from rainfall or stored soil water. In the northern region the contribution of stored soil water to crop productivity for both winter and summer cropping has long been recognized. The amount of stored soil water influences decisions to crop or wait (for the next opportunity or long fallow), to sow earlier or later (and associated variety choice) and the input level of resources such as nitrogen fertiliser.
The amount of stored soil water available to a crop - Plant Available Water (PAW) – is affected by pre-season and in-season rainfall, infiltration, evaporation and transpiration. It also strongly depends on a soil’s Plant Available Water Capacity (PAWC), which is the total amount of water a soil can store and release to different crops. The PAWC, or ‘bucket size’, depends on the soil’s physical and chemical characteristics as well as the crop being grown.
Over the past 20 years, CSIRO in collaboration with state agencies, catchment management organisations, consultants and farmers has characterised more than 1000 sites around Australia for PAWC. The data are publicly available in the APSoil database, including via a Google Earth file and in the ‘SoilMapp’ application for iPad (see Resources section).
A number of farmers and advisers, especially in the southern Australia, are using the PAWC data in conjunction with Yield Prophet® to assist with crop management decisions. Yield Prophet® is a tool that interprets the predictions of the APSIM cropping systems model. It uses the information on PAWC along with information on pre-season soil moisture and mineral nitrogen, agronomic inputs and local climate data to forecast, at any time during the growing season, the possible yield outcomes. Yield Prophet® first simulates soil water and nitrogen dynamics as well as crop growth with the weather conditions experienced to date and then uses long term historical weather record to simulate what would have happened from this date onwards in each year of the climate record. The resulting range of expected yield outcomes can be compared with the expected outcomes of alternative varieties, time of sowing, topdressing, etc. to inform management decisions.
Others use the PAWC data more informally in conjunction with assessments of soil water (soil core, soil water monitoring device or depth of wet soil with a push probe) to estimate the amount of plant available water. Local rules of thumb are then used to inform the management decisions.
The APSoil database provides geo-referenced data (i.e. located on a map), but the PAWC characterisations are for points in the landscape. To use this information one needs to find a similar soil. This is not a straight forward process and subject of ongoing research, but a number of data and information sources are available that can assist. If suitable PAWC data are not found, local measurement of PAWC is required. This will often also provide a more accurate estimate although spatial variability may still be an issue.
This paper describes the measurement of PAWC, including practical tips and pitfalls, and outlines where to find existing information on PAWC. It discusses the principles behind extrapolation from known soil profiles and illustrates this with examples of PAWC data for local soils.
Plant Available Water Capacity (PAWC)
To characterise a soil’s PAWC, or ‘bucket size’, we need to determine (Figure 1a):
- drained upper limit (DUL) or field capacity – the amount of water a soil can hold against gravity
- crop lower limit (CLL) – the amount of water remaining after a particular crop has extracted all the water available to it from the soil
- bulk density (BD) – the density of the soil, which is required to convert measurements of gravimetric water content to volumetric water content.
In addition, soil chemical data are obtained to provide an indication whether subsoil constraints (e.g. salinity, sodicity, boron and aluminium) may affect a soil’s ability to store water, or the plant’s ability to extract water from the soil.
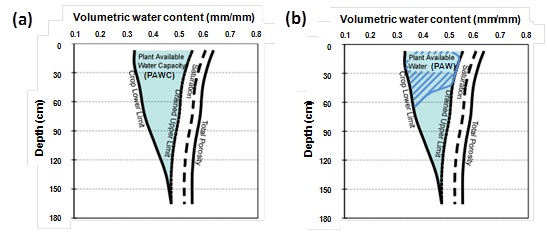
Figure 1. (a) The Plant Available Water Capacity (PAWC) is the total amount of water that each soil type can store and release to different crops and is defined by its Drained Upper Limit (DUL) and its crop specific crop lower limit (CLL); (b) Plant Available Water (PAW) represents the volume of water stored within the soil available to the plant at a point in time. It is defined by the difference between the current volumetric soil water content and the CLL.
Plant Available Water (PAW)
Plant available water is the difference between the CLL and the volumetric soil water content (mm water / mm of soil) (Figure 1b). The latter can be assessed by soil coring (gravimetric moisture which is converted into a volumetric water content using the bulk density of the soil) or the use of soil water monitoring devices (requiring calibration in order to quantitatively report soil water content).
An approximate estimate of PAW can be obtained from knowledge of the PAWC (mm of available water/cm of soil depth down the profile) and the depth of wet soil (push probe or based on a feel of wet and dry limits using an uncalibrated soil water monitoring device).
Knowledge of PAW can inform management decisions and many in the northern region have, formally or informally, adopted this. Several papers at recent GRDC Updates have illustrated the impact of PAW at sowing on crop yield in the context of management decisions (see e.g. Routley 2010, Whish 2014, Dalgliesh 2014 and Fritsch and Wylie 2015).
Field measurement of PAWC
Field measurement of DUL, CLL and BD are described in detail in the GRDC PAWC Booklet ‘Estimating plant available water capacity’ (see Resources section). Briefly, to determine the DUL an area of approximately 4 m x 4m is slowly wet up using drip tubing that has been laid out in spiral (see Figure 2). The area is covered with plastic to prevent evaporation and after the slow wetting up it is allowed to drain (see GRDC PAWC booklet for indicative rates of wetting up and drainage times). The soil is then sampled for soil moisture and bulk density.
The CLL is measured either opportunistically at the end of a very dry season or in an area protected by a rainout shelter between anthesis/flowering and time of sampling (Figure 2). This method assumes the crop will have explored all available soil water to the maximum extent and it accounts for any subsoil constraints that affect the plant’s ability to extract water from the soil.
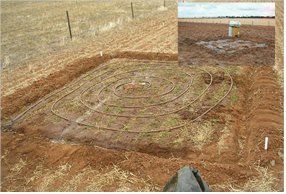
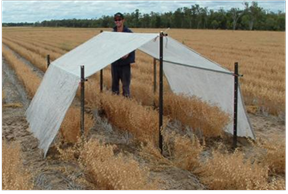
Figure 2. Wetting up for DUL determination and rainout shelter used for CLL determination
Pitfalls and common mischaracterisation issues
While the concept of PAWC is simple and the measurement methods for DUL and CLL were developed to be straightforward and not require any sophisticated equipment, it is important to keep an eye out for possible sampling errors. The list below summarises some of the key pitfalls and common mischaracterisation issues that we have come across in our collective experience of PAWC characterisations across Australia.
To allow interpretation and use of the data by others, PAWC characterisations should be accompanied by as much extra information as possible, including descriptions of the landscape position, surface condition (e.g. cracking, waterlogging), colour, texture (ideally with a full particle size analysis), Australian soil classification and any local classification soil name.
DUL
- Weeds are often seen growing on the side of the plastic cover. It is important that these are strictly controlled throughout the wetting up process until sampling
- In sandy-textured soils the concentric rings of dripper line must be laid sufficiently close to each other to ensure consistent wetting across the whole area
- Allowing insufficient time for drainage may lead to overestimation of DUL, especially at depth. Heavier soils can take 1-2 months to drain
- Insufficient water application or application at too high a rate leads to underestimation of DUL at depth. This is particularly an issue with heavy clay soils, dispersive sodic soils and strong duplex (texture contrast) soils where water may move sideways. Both the GRDC PAWC booklet and the Soil Matters book provide indicative rates and amounts for different soils. The wetting and drainage processes may be monitored (e.g. using NMM or a moisture probe), but this is not often done due to cost constraints (time, money)
- Bulk density sampling, which is often done in conjunction with DUL sampling, requires a relatively high level of precision as any error in bulk density values will propagate when used to convert gravimetric water contents (including DUL, CLL and PAW) into mm of water. The procedure is described and illustrated in detail in the GRDC PAWC booklet.
- Snakes like to hide under the plastic, so take care when wetting and sampling the plot.
CLL
- The CLL method as described above relies on crop roots exploring the soil to the fullest extent. If the crop had insufficient moisture to establish its root system prior to anthesis, the CLL may not reflect maximum soil water extraction. Roots will not grow through a dry layer even if there is moisture underneath. It is, therefore, important to perform CLL measurement in paddocks with a well established and healthy crop. Wetting up of the CLL site prior to the growing season may help, but requires close attention to weeds and to supplying the right amount of nitrogen fertiliser
- In wetter climates and years with rainfall in the weeks just prior to the erection of rainout shelters at anthesis may refill the PAWC ‘bucket’. If the PAWC is large, this may prevent the crop from using all soil water and result in an overestimate of CLL (too wet). Ideally CLL is measured over multiple seasons, but this is rarely done in practice. Calibrated moisture probes can be an effective tool to assess a crop’s ability to extract moisture over a range of different seasons
- The CLL measured for one crop type may not apply to a different crop type, especially where growing season length or susceptibility to subsoil constraints differs. It is possible that long-season varieties may extract water from a greater depth than short season varieties because of more extensive root development, and hence result in different CLL
- If sampling is not deep enough to capture the full root zone, PAWC will be underestimated. In this case the CLL and DUL do not reach the same value at the bottom of the profile
- If there is insufficient wetting of the profile prior or during the growing season, the measured CLL may reflect the CLL of a previous crop. If the current crop has a shallower root system this could cause the PAWC to be overestimated. Wetting up of the CLL site prior to the season may help. Taking a soil core when the rainout shelter is installed and comparing values against those determined at the time of final sampling can assist with interpretation of the data.
- Rainout shelters have blown loose or away on occasions, so it is important to secure the sides firmly into the soil
- For duplex soils located on hills slopes > 3-5% or soils at the break of slope, subsurface lateral flow can cause soil wetting despite the presence of a well constructed rain-out shelter. Keep an eye on late season rainfall and note any unusual wetness in samples collected
- Sampling after harvest when the soils are dry and hard, or have hard layers can be tricky. Digging a soil pit can be a better alternative than soil coring from the surface in these situations.
General
- Soil variability may mean there is more than one PAWC profile within the paddock. Variability in depth of layers, e.g. texture contrast in duplex soils, can occur over small distances. This makes mixing replicates and selecting a “representative soil” difficult
- High soil variability can cause the DUL and CLL measurements to effectively be on different soils (even though they are usually only 2-3 m apart). It is essential to measure DUL and CLL on the same soil type. Yield or soil maps may assist in deciding where to sample.
Where to find existing information on PAWC
Characterisations of PAWC for more than 1000 soils across Australia have been collated in the APSoil database and are freely available to farmers, advisors and researchers. The database software and data can be downloaded from APSoil. The characterisations can also be accessed via Google Earth (KML file from APSoil website) and in SoilMapp, an application for the iPad available from the App store. The yield forecasting tool Yield Prophet® also draws on this database.
In Google Earth the APSoil characterisation sites are marked by a shovel symbol (see Figure 3a), with information about the PAWC profile appearing in a pop-up box if one clicks on the site. The pop-up box also provides links to download the data in APSoil database or spreadsheet format.
In SoilMapp the APSoil sites are represented by green dots (see Figure 3b). Tapping on the map results in a pop-up that allows one to ‘discover’ nearby APSoil sites (tap green arrow) or other soil (survey) characterisations. The discovery screen then shows the PAWC characterisation as well as any other soil physical or chemical analysis data and available descriptive information.
Most of the PAWC data included in the APSoil database has been obtained through the field methodology outlined above, although for some soils estimates have been used for DUL or CLL. Some generic, estimated profiles are also available. While field measured profiles are mostly geo-referenced to the site of measurement (+/- accuracy of GPS unit), generic soils are identified with the nearest, or regional town.
The report 'PROFILE descriptions – District guidelines for managing soils in north-west NSW' by Daniells et al. (2002) provides PAWC characterisations for 17 soils in the region drawing on the same methodology. In addition this report provides valuable soil descriptions for areas around Coonabarabran, Coonamble, Moree, Pilliga, and Walgett.
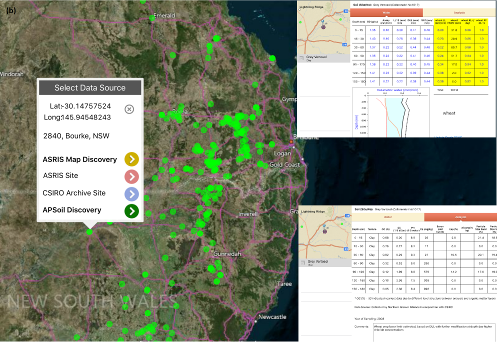
Figure 3. Access to geo-referenced soil PAWC characterisations of the APSoil database via (top) Google Earth and (bottom) SoilMapp (APSoil discovery screens as inserts).
Factors that influence PAWC
An important determinant of the PAWC is the soil’s texture. The particle size distribution of sand, silt and clay determines how much water and how tightly it is held. Clay particles are small (< 2 microns in size), but collectively have a larger surface area than sand particles occupying the same volume. This is important because water is held on the surface of soil particles which results in clay soils having the ability to hold more water than a sand. Because the spaces between the soil particles tend to be smaller in clays than in sands, plant roots have more difficulty accessing the space and the more tightly held water. This affects the amount of water a soil can hold against drainage (DUL) as well as how much of the water can be extracted by the crop (CLL).
The effect of texture on PAWC can be seen by comparing some of the APSoil characterisations from the northern region, as illustrated below (Figures 4-11). The soil’s structure and its chemistry and mineralogy affect PAWC as well. For example, subsoil sodicity may impede internal drainage and subsoil constraints such as salinity, sodicity, toxicity from aluminium or boron and extremely high density subsoil may limit root exploration, sometimes reducing the PAWC bucket significantly.
The CLL may differ for different crops due to differences in root density, root depth, crop demand and duration of crop growth. Some APSoil characterisations only determined the CLL for a single crop. The CLL for wheat, barley and oats are often considered the same and that of canola can be found to be similar as well, but care needs to be taken with such extrapolations as different tolerances for subsoil constraints can cause variation between crops.
A detailed explanation of the factors influencing PAWC is included in the 'Soil Matters – Monitoring soil water and nutrients in dryland farming' book, a pdf of which is available for free online (see Resources section).
Nyngan-Trangie-Coonamble
The APSoil database contained relatively few PAWC characterisations in the wider Nyngan-Trangie-Coonamble area, despite the high variability in soils. The complex set of soils is dominated by alluvial soils laid down by the Macquarie, Bogan and Castlereagh Rivers between 5,000 and 1.5 Million years ago. There are also soils formed on bedrock to the west of Nyngan and south east of Collie. The 'Glovebox guide to Soil of the Macquarie-Bogan Flood Plain' (Hulme 2003) provides a description soils and their features. It does this through a mapping based on the underlying 1:250,000 Nyngan geology map, which distinguishes different formations and position in the flood plain (meander plain vs. back plain). The guide does not provide information on PAWC, but the current project is characterising further soils in this area, targeting different soil-landscape units. Examples below illustrate that texture as affected by parent material is an important factor affecting the PAWC (Figure 4), that soils can vary significantly over a short distance (Figure 5; distance between the sites is < 3 km), but can also have a similar sized PAWC, despite being in different parent materials (Figure 6).
(Figure captions refer to soil-landscape units from a draft Nyngan soil-landscape map and accompanying report – see subsequent section on using soil-landscape information.)
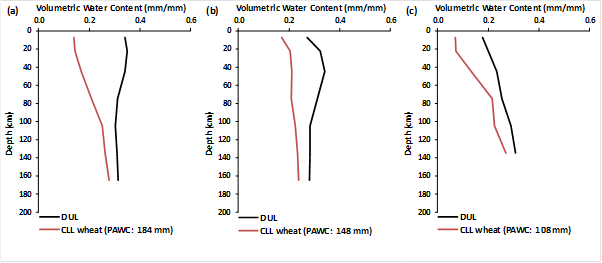
Figure 4. Select soils near Warren NSW and Nyngan NSW (see (a), (b) and (c) below):
(a) Medium clay (APSoil 705) near Warren. Exact location unknown, but likely from back plain position in alluvial sediments of the Macquarie River.
(b) Sandy clay loam over light clay changing to clay loam at depth (APSoil 248) near Warren. Exact location unknown, but likely from meander plain position in alluvial sediments of the Macquarie River.
(c) Sandy clay loam over sandy clay (APSoil No246) near Nyngan on. On an older, higher alluvial plain of Pangee Creek. The different parent material results in a much lighter texture (e.g. 70 % sand in top 30 cm compared with 50% for APSoil 248).
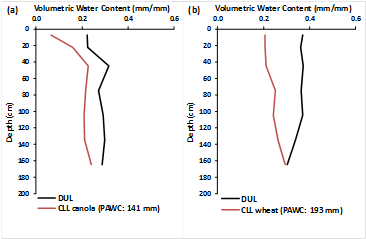
Figure 5. Select soils near Trangie NSW (see (a) and (b) below):
(a) Sandy clay loam (APSoil 683) near Trangie. Alluvial sediment formed on a meander plain of the Macquarie River more than 150,000 years ago. There is a higher proportion of sand, particularly in the surface of this soil reflected in a lower PAWC.
(b) Light over medium clay reverting to a sandy clay at depth (APSoil 684) near Trangie. Alluvial sediment formed on a back plain of the Macquarie River more than 150,000 years ago. The back plains are characterised by large flat areas where finer sediments were deposited from the lower energy flows. These finer sediments produce soils with higher PAWC.
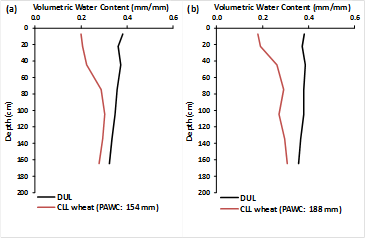
Figure 6. Select soils near Collie NSW(see (a) and (b) below):
(a) Vertosol formed on alluvial back plains of the Castlereagh River between 15,000 and 150,000 years ago. Alluvial material originated from Jurassic and Cretaceous sandstone to the east and deposited in low energy flows forming large, flat, treeless areas dominated by cracking clays. Chemistry data pending, but soils in this soil-landscape unit commonly have sodic subsoils which may explain the narrowing PAWC. Draft characterisation.
(b) Vertosol formed primarily from basaltic tertiary volcanic material. This landscape was the lower colluvial slopes and depressions associated with finer sediments. The PAWC of this basaltic origin soil is similar to the nearby vertosols formed on the back plains of the Macquarie River. Draft characterisation. (Part of a new set of characterisations with support from Neroli Brennan and Graeme Callaghan.)
Walgett – Collarenebri - Pilliga
The 'Profile Descriptions - District guidelines for managing soils in north-west NSW' report (Daniells et al. 2002) provides descriptions of the soils in the Walgett, Pilliga, Moree, Coonamble and Coonabarabran areas, including PAWC data for select soils. This is a valuable resource that complements the existing APSoil characterisations and used the same methodology for the PAWC characterisations.
The report describes characterised soils in the Walgett area as being dominated by Grey and Brown Vertosols, which are all strongly sodic (and dispersive) below 15 or 60 cm and alkaline. Most are also saline in the deeper subsoil. PAWC for wheat is usually high and frequently in the 200-220 mm range, but some of the APSoil characterisations confirm that smaller and bigger buckets do occur depending on texture and subsoil constraints in particular (see e.g. Figure 7).
Soils included in the Profile Descriptions report for the area between Collarenebri, Mungindi and and Moree are described as black and grey vertosols which have lower PAWC than the ‘true black earths’ east of Moree (PAWC 160-205 mm). The soils are strongly sodic (and dispersive) below 30 or 45 cm, which explains their reduced PAWC. Crops respond differently to subsoil constraints, resulting in different PAWC (Figure 8). Where the differences are small, they could also be due to measurement error (including due to seasonal variation).
We have included two lighter textured soils from the Profile Descriptions report from the Pilliga area to illustrate the effect that their lighter texture has on PAWC (Figure 9b,c).
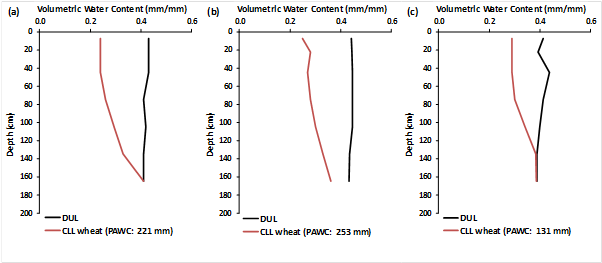
Figure 7. Select soils west of Walgett(see (a), (b) and (c) below):
(a) Grey Vertosol (APSoil 1013) (also W79 in Profile Descriptions report). Strongly sodic subsoil below 90 cm. Rotten Plain land system unit (low-lying back plains of Quaternary alluvium, periodically partially inundated by local run-off or floodwaters; depressed to 4m; land systems unit report via ESpade).
(b) Grey Vertosol (APSoil 1015) near Angledool Lake with a deeper and hence larger PAWC profile not limited by subsoil constraints.
(c) Grey Vertosol (APSoil 1016) between Walgett and Cumborah in alluvial deposits. Particle size and chemistry data not available, but shape suggests subsoil constraints limit the PAWC.
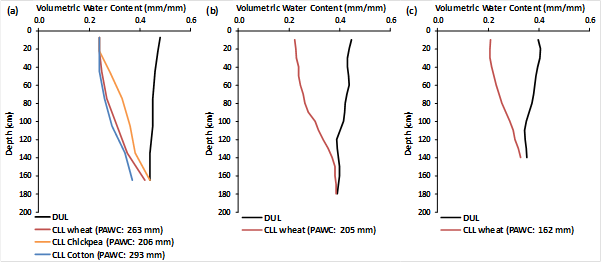
Figure 8: Select soils near Collarenbri (see (a), (b) and (c) below):
(a) Grey Vertosol (APSoil 126) near Merrywinebone in alluvial deposits. The high clay content (~60%) contributes to the high PAWC although the subsoil below 90 cm is affected by chloride and sodicity.
(b) Grey Vertosol MW51 near Collarenbri from the Profile Descriptions report. It has a strongly sodic subsoil although the report notes rooting to 175 cm.
(c) Grey Vertosol MW52 near Bullarah from the Profile Descriptions report. The report notes that dispersive subsoil may limit the penetration of water and reduce the effective rooting depth, but the PAWC of 162 mm may be an underestimate as characterisation was only down to 140 cm.
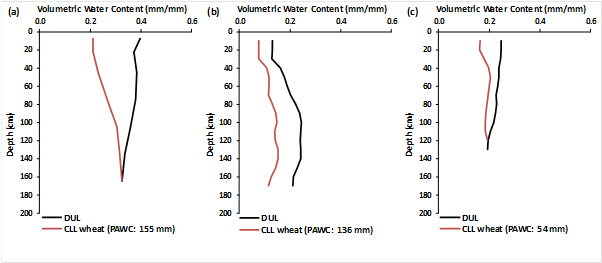
Figure 9. Select soils near Pilliga (see (a), (b) and (c) below):
(a) Grey Vertosol (APSoil 1014) just north of Pilliga and (judged by location in Google Earth) on alluvial deposits. The high clay content (58%) results in the higher PAWC compared with (b,c), but subsoil constraints (chloride and sodicity) reduce the PAWC from what it may have been based on texture alone.
(b) Red Chromosol (texture change (duplex) soil) North of Gwabegar (P56 from the Profile Descriptions report). The abrupt increase in clay % causes the shift and widening of the PAWC profile between 20 and 40 cm depth.
Liverpool Plains
Cropping within the Liverpool Plains is primarily on the vertosols. The various APSoil characterisations in the area show, however, that within the vertosols there is still variation in PAWC in response to texture, parent material and subsoil constraints (Figure 10). Current new characterisations in the area are underway with local coordination of William Manning. The new characterisations are attempting to characterise the vertosols of different soil-landscape units. This followed the observation of an informal, qualitative analysis of the limited existing APSoil profiles that it seemed that the PAWC of vertosols in different areas of the Liverpool Plains could be characterised within 30-50 mm ranges. There are similarities with the soil characterisations in the Central Darling Downs Management manual (see below) where the indicative PAWC ranges for soils are provided in 50 mm intervals (e.g. 150-200, 200-250, > 250). Whether and how well this works for the Liverpool Plains still needs to be tested. One complication is that PAWC for different crops can be quite different (Figure 10), although seasonal differences could affect that if measurements were not made in the same year.
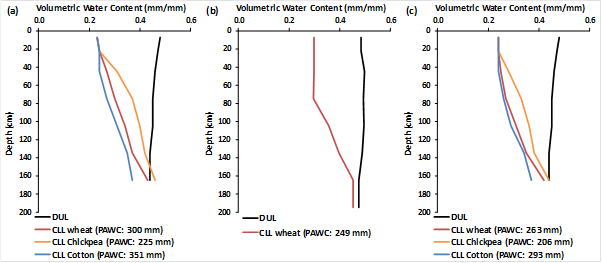
Figure 10. Select soil PAWC characterisations from the Liverpool Plains (see (a), (b) and (c) below):
(a) Vertosol on footslopes in Jurassic basalts and associated alluvium south of Goran Lake (APSoil site 128) has a large PAWC bucket, although PAWC for chickpea was smaller than for wheat and cotton was larger. Other characterisations in the same soil-landscape unit had very similar PAWC.
(b) Vertosol on flood plain in tertiary and quaternary alluvium near Quirindi (APSoil 866) has a slightly smaller, but still sizable PAWC bucket. A nearby characterisation (APsoil 869) in the same soil landscape unit had a similar PAWC (245 mm wheat).
(c) Black Vertosol (APSoil 119) near Breeza is located on the broad, level floodplains of the Mooki River on Quaternary alluvium derived from the Tertiary basalts, which contributes to the large PAWC bucket. Other characterisations in this soil-landscape unit had similar PAWC buckets.
Central Darling Downs
While outside of the area of interest for most people attending the Coonabarabran Updates, we include a few examples from the Central Darling Downs (Figure 11) as it is another example (like Figures 4-6) where soil-landscape information has helped us interpret and explain the observed PAWC profiles.
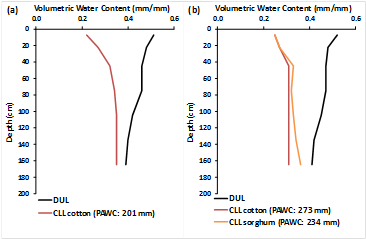
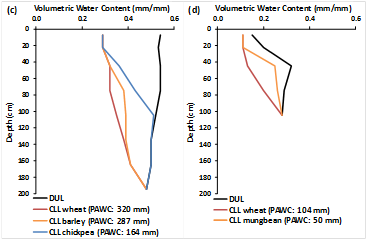
Figure 11. Select soil PAWC characterisations from the Central Darling Downs (see (a), (b), (c) and (d) below):
(a,b) Variation within the broad level recent alluvial plains (LRA unit 1a) stems from the mixed basaltic and sandstone origin of the alluvium and from particle size of the sediments in response to position within the plains. The Condamine soil is a deep, coarse structured black cracking clay adjacent to the Condamine River. It has coarse sand and gravel throughout and moderate to high suboil salinity, both of which limit PAWC to about 150-200 mm, as seen in the example of APSoil 8 from near Yandilla, Qld (a). The Anchorfield black cracking clay has a finer structure which is reflected in its larger PAWC (typically >250 mm) as illustrated by APSoil 6 from near Brookstead (b).
(c) The Waco soil is more common in the broad level older alluvial plains of basaltic alluvium. The high clay content of these soils along with the smectite clay minerals contributed by the basaltic origin are responsible for the severe cracking and self-mulching nature of these soils and their large PAWC (Apsoil site 16 near Jimbour, Qld).
(d) The undulating to steep, low hills and rises of Walloon sandstone of the Brigalow Uplands (LRA unit 6b) are characterised by grey-brown cracking clays with brown sands over brown clays. The Diamondy soil of APSoil site 88 near Jinghi, Qld is a texture contrast soil with a hardsetting surface and impermeable subsoil. The lower PAWC (50-100 mm) is in response to the limited depth, lower water holding capacity of the sandy surface layer and sodicity and salinity at depth.
Choosing an APSoil characterisation
As shown above, the soil PAWC can vary significantly. How do we choose the most appropriate APSoil characterisation, if we are not in the position to do a local field PAWC characterisation? This is still research in progress, but some guidance can already be provided.
- The nearest APSoil may not be the most appropriate as its soil, parent material and landscape position could be quite different (cf. Figure 5)
- Compare soil with descriptions of the APSoil sites (texture, colour, soil classification, chemical analysis). More recently collected APSoil characterisations include chemical analysis and particle size. As illustrated in Figures 4-11 both particle size and subsoil constraints strongly affect the PAWC
- Dig a hole (soil auger, soil core, backhoe trench, roadside bank or cutting); note surface features (cracking, hard setting), subsoil issues (salinity, sodicity, etc), rooting depth. This can assist with APSoil selection as well as adapting an APSoil profile to local conditions (e.g. if depth of texture change or rooting depth is different)
- A measured sowing soil water profile (convert to volumetric) needs to ‘fit’ between CLL and DUL and can assist with APSoil selection (Figure 1b). If the measured (volumetric) water content profile is below CLL or above DUL then the texture of the soil does not match that of the chosen APSoil
- Opportunistic CLL (e.g. soil core following a dry finish; convert to volumetric) can be compared with CLL of APSoil characterisations
- Check for nearby soil survey characterisations (SoilMapp, Espade, Queensland Globe (see Resources section) and local soil reports) to help describe soils
- Draw on soil-landscape mapping (where available) to find APSoil sites in similar landscape positions (see below).
- Native vegetation is often a useful indicator of soil type too and is indeed often included in information about soil-landscape, land resource area and land systems units.
Using soil –landscape information
In many landscapes the soil properties are tightly linked to a soil's development and position in the landscape and these same aspects underpin the many soil and land resource surveys that have been carried out over the years and that are increasingly becoming available on-line. Many of these present a mapping of so-called soil-landscape units that are based on a combination of geology, landscape features like slope and relief, vegetation and groups of soils. Effectively the distribution of soil types described by these maps and their mapping units descriptions are based on a landscape model or story. These descriptions, where available, can be used to interpret and potentially extrapolate APSoil characterisations.
In parts of NSW these soil-landscape units can be accessed through the ESpade tool (see Resources section), which delineates the units and provides a description and typical soil profiles for each unit (see Figure 12). In parts of Queensland, similar land resource area (LRA) mappings are used as part of land management manuals (see Figure 13). Where this information is available, it may be possible to use it to find an APSoil site in a similar landscape position as a first approximation of PAWC.
The concept of using soil-landscape information to classify and inform soil properties is not new. The Queensland land management manuals accompanying the LRA maps draw on the same concept as do the 'Glovebox Guide to Soil of the Macquarie-Bogan Flood Plain' by Hulme (2003) and several 'Soil Specific Management Guidelines for Sugarcane Production' in different sugarcane growing areas from northern NSW to northern Queensland (e.g. Wood et al 2003). The availability of these maps on-line makes them more accessible and assists with visualising a location’s position in the landscape. Combining these maps with the geo-referenced APSoil PAWC characterisations will increase the value that both resources can provide to farmers and advisors.
Using these resources to inform or even predict PAWC profiles is, however, still research in progress. In particular its predictive power and spatial accuracy still needs to be assessed as well as the required level of soil and landscape information. Not all areas within the northern region are covered by these soil-landscape maps and knowledge of (hydraulic properties of) soils within these areas varies too. Another resource that may proof useful in the future but requires further testing for its use in predicting PAWC profiles, is the new Soil and Landscape Grid of Australia (see Resources section) which provides digital soil and landscape attribute predictions at a spatial resolution of 90 m x 90 m).
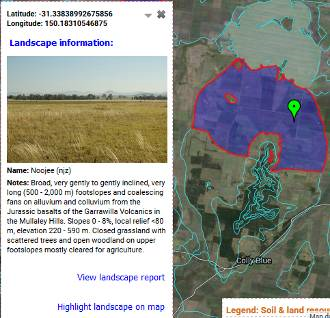
Figure 12. Example of soil-landscape mapping available for parts of NSW through ESpade showing the location of the characterisation of Figure 10a. Mapping unit description is available through a pdf report.
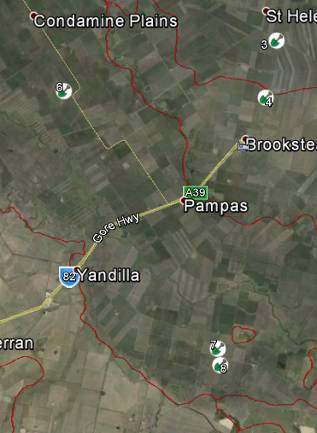
Figure 13. Section of Central Darling Downs with Land Resource Areas (LRA) delineated on Google Earth map with APSoil sites indicated. The accompanying description assisted in describing the differentiation between APSoil 6 and 8 of Figure 11a,b.
Local soil and landscape mapping information
Nyngan-Trangie-Coonamble
ESpade does not provide on-line access to soil-landscape mapping in this area, but a draft map based on the 1:250,000 Nyngan geology map exists and a pdf copy of this draft can be found here.
Walgett – Collarenbri – Pilliga
ESpade does not provide on-line access to soil-landscape mapping in this area and a draft map based on the 1:250,000 Walgett geology map only covers the south-western part of this region (south of Walgett and west of Come By Chance). A pdf copy of this draft can be found here.
ESpade does provide higher-level land systems mapping for the western part of this region (north of Kamilaroi Highway and west of the Gwydir Highway). The pdf descriptions of the different land systems can provide some insights in typical floodplain components and their soil types.
Useful information about soils in the region is contained in the Profile Descriptions report by Daniells et al. (2002).
North Star
ESpade does not provide on-line access to soil-landscape mapping in this area and neither is land systems mapping available online. Soilmapp provides a broad distinction of where the heavier vertosols and lighter texture change soils may be, but within these there will be local exceptions and variations.
The Profile Descriptions report provides descriptions and PAWC information for soils a bit further south in a region labelled in the report as ‘Moree East’.
Liverpool Plains
ESPade provides access to soil-landscape maps and reports on each soil-landscape unit covering the Liverpool Plains (soil & land resources mapping). Within each of the mapping units there are still different soil types. The typical position of these soil types is described.
Central Darling Downs
The Central Darling Downs is covered by a LRA map, of which Google Earth files can be obtained (see Resources section). This allows simultaneous viewing of the LRA units and APSoil characterisations. Descriptions of the LRA units as well as the various soils identified in a local classification and their typical positions within the various LRA units are provided in the accompanying Land Management Manual (see Resources section). Estimated PAWC ranges (in 50 mm intervals) are provided for each local soil type.
Acknowledgements
The research undertaken as part of this project is made possible by the significant contributions of growers through both trial cooperation and the support of the GRDC, the authors would like to thank them for their continued support. We also gratefully acknowledge the contributions of CSIRO colleagues and many collaborators and farmers to the field PAWC characterisations. Their feedback also helped prepare the list of ‘tips and tricks’. The information on PAWC presented in this paper heavily draws on the work over many years by Neal Dalgliesh. Discussions with him and others, including with those involved with soil-landscape mapping in NSW (Neil McKenzie, Rob Banks, Brian Murphy and Neroli Brennan) were invaluable for the development of concepts and ideas presented in this paper. New characterisations in the Nyngan-Trangie-Coonamble area were supported by Neroli Brennan and Graeme Callaghan. New characterisations in the Liverpool plains were supported by a group of consultants led by William Manning. We thank Sean Murphy for access to the Profile Descriptions report for north-west NSW and its authors for the work involved with the PAWC characterisations and soil descriptions. Claire Yung provided assistance with the preparation of graphs.
Resources
APSoil, PAWC methodology and national information
APSoil database: http://www.apsim.info/Products/APSoil.aspx (includes link to Google Earth file)
SoilMapp (soil maps, soil characterisation, archive and APSoil sites): Apple IPad app available from App store; documentation: https://confluence.csiro.au/display/soilmappdoc/SoilMapp+Home
GRDC PAWC booklet: http://www.grdc.com.au/GRDC-Booklet-PlantAvailableWater
Soil Matters book: http://www.apsim.info/Portals/0/APSoil/SoilMatters/pdf/Default.htm
Soil and Landscape Grid of Australia: http://www.csiro.au/soil-and-landscape-grid
Yield Prophet®: http://www.yieldprophet.com.au
NSW
ESpade (soil-landscape and land systems mapping and reports, reports on soil characterisation sites from various surveys): http://www.environment.nsw.gov.au/eSpadeWebApp/
Unpublished soil-landscape maps exist for: Nyngan, Walgett, Narromine, Narrabri, Gilgandra
Soil Profile Descriptions - District guidelines for managing soils in north-west NSW (Daniells et al. 2002)
Queensland
Land Management Manuals: https://publications.qld.gov.au/dataset?q=land+managament+manual
Land Resource Area (LRA) maps: Google Earth files: https://data.qld.gov.au/dataset/land-resource-areas-series or via the Queensland Globe https://www.business.qld.gov.au/business/support-tools-grants/services/mapping-data-imagery/queensland-globe
References
Dalgliesh N (2014) Practical processes for better soil water management. GRDC Update paper.
Daniels I, Manning B, Pearce L (2002) Profile descriptions. District guidelines for managing soils in north-west NSW. NSW Agriculture.
Hulme P (2003) Glove-box guide to the soils of the Macquarie – Bogan floodplain, Sustainable Soils Management, Warren.
Whish J (2014) Sorghum yield risk vs starting soil moisture. GRDC Update paper.
Wood A, Schroeder B, Stewart B (2003) Soil Specific Management Guidelines for Sugarcane Production. CRC for Sustainable Sugar Production, Townsville.
Contact details
Kirsten Verburg
CSIRO Agriculture
Ph: (02) 6246 5954
Email: kirsten.verburg@csiro.au
Brett Cocks
CSIRO Agriculture
Ph: (07) 4688 1580
Email: brett.cocks@csiro.au
CSIRO Agriculture
Ph: (07) 4059 5002
Email: tony.webster@csiro.au
GRDC Project Code: CSP00170,
Was this page helpful?
YOUR FEEDBACK