A new DNA tool to determine risk of chickpea Phytophthora root rot
Author: Sean Bithell, Kevin Moore, Kristy Hobson and Steve Haden (NSW DPI), Willy Martin (DAFQ) and Alan McKay (SARDI) | Date: 01 Mar 2016
Take home message
- Increasing level of inoculum (oospores/plant) of Phytophthora medicaginis (Pm) was strongly correlated with decreasing yield of the moderately resistant variety Yorker
- An inoculum level of 660 oospores/plant (PreDicta B® > 5000 Pm copies/g soil) at sowing significantly reduced yields compared with lower inoculum levels under both dryland and irrigated conditions
- Testing soil samples from growers’ 2015 paddocks confirmed the results of testing 2014 samples that the PreDicta B® soil Pm test can identify Pm in growers paddocks in NSW and QLD
- These findings provide further evidence that the PreDicta B® Pm test will be a useful tool for growers to determine their risk of Phytophthora root rot
Note: the SARDI PreDicta B® test for Phytophthora medicaginis is under development and is not yet available commercially
Phytophthora medicaginis detection in soil
Phytophthora medicaginis (Pm), the cause of chickpea Phytophthora root rot (PRR) is endemic and widespread in southern QLD and northern and north central NSW. Under conducive conditions, PRR can cause 100% loss. The pathogen survives from season to season on chickpea volunteers, lucerne, native medics, sulla and as resistant structures (oospores) in roots and soil.
A PreDicta B® soil DNA test has been developed by the South Australian Research and Development Institute (SARDI) to quantify the amount of Pm DNA in soil samples and so provide a measure of the amount of Pm inoculum (infected root tissue and oospores) in paddocks. We report on the second season of studies to assess the capability of this test to:
- Detect Pm inoculum in soil from commercial paddocks
- Predict the risk of PRR disease and potential yield losses in chickpea
Pm inoculum level, PRR disease and yield
It would be useful if the Pm DNA test could predict the amount of PRR disease and potential losses. For example, would paddocks with nil, low and high Pm inoculum levels have nil, low and high PRR disease and yield losses? Our 2014 Pm inoculum concentration field trial (Tamworth) using the PRR susceptible variety Sonali (rating S) showed that yield losses were greatest at the highest soil Pm concentrations but that even at low soil concentrations (100 oospores/plant) substantial yield loss occurred. Pm is able to multiply quickly under high soil water conditions. The 2014 trial showed that following a saturating rain event, the amount of disease and extent of yield loss with medium levels of inoculum (500 and 1000 oospores/plant) caught up with those of higher levels of inoculum (2000 and 4000 oospores/plant).
The aim of the 2015 field trial (DAF Qld Hermitage Research Station, Warwick, QLD) was to relate the Predicta B® Pm test to PRR level and yield loss for low inoculum levels (<1000 oospores/plant) using the most PRR resistant variety Yorker (rating MR), under dryland and irrigated conditions. Irrigation was included to specifically test if low inoculum treatments would have similar effects on disease and yield loss to those of high inoculum treatments under disease conducive conditions. On 10 June 2015, a range of Pm inoculum levels was established by applying, at sowing, different rates of oospores in-furrow. On 10-11 Jun, thirty soil samples (150 mm depth cores) per plot (5 reps) were pooled and tested for soil Pm concentration by PreDicta B®. The trial was also sampled for end-season DNA Pm concentrations on 15 December (data not available at time of writing).
Irrigation was applied on 10-11 Sep and on 16-17 Oct following 2 weeks with low rainfall (< 3mm). Winter rainfall was similar to long term average values for July (22mm) and August (25mm) but September and October both had below average rainfall totals. November was wet with 97mm of rain.
Soil Pm DNA values at sowing differed significantly among oospore treatments but not between irrigation treatment (Table 1). Three of ten Nil (0) oospore plots had positive but low Pm DNA results, indicating background Phytophthora in some plots.
On 13 Oct (end of flowering), the irrigated 130 and 660 oospores/plant treatments had significantly more PRR than the dryland 130 and 660 oospores/plant treatments (Table 1). By 12 Nov (dryland treatments senescing), the irrigated 40, 130 and 660 oospores/plant treatments had significantly more PRR than the dryland 40, 130 and 660 oospores/plant treatments.
The interaction of irrigation and oospore treatments on grain yield was complex as indicated by (Table 1, Figure 1):
(i) At low inoculum levels (zero and 40 oospores/plant), irrigation increased yield compared with dryland
(ii) For medium inoculum (130 oospores/plant), irrigation had no significant effect on yield
(iii) For the highest inoculum level (660 oospores/plant) irrigation reduced yield compared with the dryland treatment.
These interactions suggest that at low PRR levels, the primary effect of irrigation is on yield, but at high PRR levels the primary effect is on disease. However, the shape of these relationships are likely to vary from season to season due to differences in seasonal rainfall (Figure 1).
Furthermore, multiple processes will affect outcomes. For example, although yields did not differ between the irrigated and dryland 130 oospores/plant treatments (~3000 P.med DNA seq no/g soil) there was more disease in the irrigated treatment. In this 2015 trial, the uninfected irrigated plants in a plot will have had grain yield benefits from irrigation and so probably compensated for the yield loss of infected plants. However, for seasons with above average early-season rainfall there may be greater early-season disease development and hence greater impacts on yield at this same 3000 P.med DNA seq no/g soil inoculum level.
Under PRR conducive conditions, can low initial levels of inoculum catch up to high initial levels with regard to disease severity and yield loss?
- This is not clear from the current experiment and further research is required.
Can the Pm DNA soil test predict risk of Phytophthora?
- Based on the results of this trial with Yorker (MR) and the 2014 Tamworth one with Sonali (S), the answer is YES. For Yorker significant yield loss can be expected with starting (pre-sow sampling) inoculum levels above ca 3000 Pm DNA sequences/g soil (ca 130 oospores/plant).
However, these values may need to be interpreted with some caution as seasonal conditions will modify outcomes, for instance in a dry season less disease may develop from the same amount of inoculum.
Table 1. Irrigation-oospore treatment, soil Pm DNA concentration, PRR assessment and yield of Yorker in 2015 Pm inoculum trial at Warwick, QLD (Soil Pm concentration: P < 0.001; LSD 1092.6; 13 Oct PRR rating: P = 0.038; LSD = 0.58; 12 Nov row cm of PRR stunted plants: P = 0.035; LSD 46.4; Grain yield: P<0.001; LSD = 480.7)
|
Treatment, dryland (D), irrigated (I), no. oospores per plant |
Soil Pm DNA concentration at sowing no. Pm sequences/g soil |
13 Oct PRR rating (1= no disease, 9 = all plants dead) |
12 Nov. cm of row of PRR stunted plants |
Grain yield, kg/ha |
|
D-0 |
342 |
1.1 |
16 |
3198 |
|
D-40 |
1986 |
1.7 |
18 |
2961 |
|
D-130 |
3051 |
2.0 |
88 |
3038 |
|
D-660 |
5357 |
3.1 |
203 |
2402 |
|
I-0 |
169 |
1.2 |
6 |
3914 |
|
I-40 |
1765 |
1.8 |
78 |
3631 |
|
I-130 |
2996 |
2.8 |
185 |
2966 |
|
I-660 |
5925 |
4.2 |
395 |
1764 |
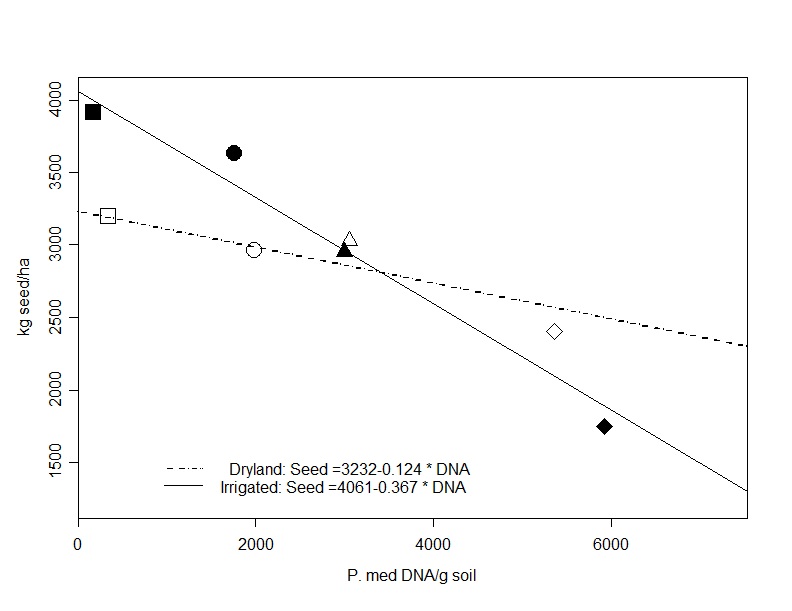
Figure 1. Multiple regression for plot soil Pm concentrations at sowing vs. grain yield for dryland (black symbols) and irrigated (white symbols) treatments (model R2 = 0.745), treatment means presented.
Pm DNA detection in soil samples from commercial paddocks
We evaluated the ability of the Pm DNA test to detect Pm in soil samples from growers’ paddocks.
Over the winter-spring period of 2014, soil samples were collected from fields in central (16) and south-western Queensland (10), and Victoria (7). Most paddocks included chickpeas in the rotation but not all had chickpeas in 2014. There were eight perimeter sample sites per paddock, one near each corner and one near the midpoint of each side. At each of the eight sample sites, a W collection pattern was walked towards the centre of the paddocks and 10 soil cores (150 mm depth PreDicta B® soil corer) collected every 20 – 25 paces along the sample path (total distance 200 – 250 m per sample site), giving a total of 80 soil cores.
Samples (9) were also collected from southern NSW, in this case most paddocks included either lucerne or lupins in the rotation. For these sites a diagonal collection pattern across low lying and weedy areas of paddocks was used and 80 150mm PreDicta B® cores collected per site.
Soil samples were stored in sealed plastic bags at 5°C. Samples were homogenised by cutting up cores and mixing, following which a 400g sub sample was sent to SARDI for DNA analysis. The remainder of each sample was then restored at 5°C until the baiting experiment was setup.
Samples from 43 paddocks were prepared for DNA analysis and a Pm baiting experiment. Subsamples of soil were dried at 105°C for 24h to determine soil moisture content, then non-dried soil was mixed with sand (dry weight basis, 55g soil + 154g sand), placed in a plastic cup (70mm width, 75mm height). There were five reps; soil from a Pm inoculated field trial (MET14) served as a control. Three Sonali seeds were sown in each cup, the cups placed in a glasshouse (RCB design). The cups were watered to 21% soil moisture content three times a week. After 18 days the cups were flooded for 48h then drained. Seedlings were assessed for disease (chlorosis, stem cankers, death) three times a week. Stem canker tissues were plated to isolate Pm. Cultures with Phytophthora like growth on cornmeal agar were plated on low strength V8 agar and colony morphology, oospore production and oospore size used to identify Pm like cultures. The isolation of Pm was attempted from all treatments that produced chlorosis followed by the appearance of Pm like stem cankers. In addition, the isolation of Pm was also attempted from any treatments where there were disease symptoms or seedlings with poor growth. After eight weeks the experiment was terminated.
Ten of the 43 paddock soil treatments produced PRR like cankers on plants, Pm like cultures were isolated from eight samples from growers paddocks; Pm like cultures were also isolated from the MET14 control soil, giving a total of nine Pm isolates. One of the samples (NIE1) produced cankers that were not caused by Pm.
Of the 43 paddock soil treatments (including the MET14 control soil), 9 had positive Pm DNA results. Comparing the DNA results to the isolation results showed that most (8/9, 89%) samples which had positive DNA results also yielded Pm cultures and that most (33/34, 97%) samples which had negative DNA results also did not yield Pm cultures (Table 2).
Notably, one sample (LOU2) which yielded a Pm culture was negative for Pm DNA.
One sample (A) was positive for Pm DNA but did not yield Pm cultures, seedlings in all 5 cups remained healthy. This sample that did not produce any PRR symptoms had a lower Pm DNA value (1,234 Pm copies/g soil) than other samples (range 2,443-813,436 Pm copies/g soil). Possible explanations for this result is: (i) more time may be required for symptoms to develop, or (ii) that the pathogen had died but some DNA had been detected.
Table 2. Comparison of Phytophthora medicaginis (Pm) DNA detection in 43 paddock soil samples and isolation success of Pm from Sonali chickpeas grown in these samples
|
43 samples analysed for Pm DNA |
|||
|
9/43 + Pm DNA |
34/43 nil Pm DNA |
||
|
43 soil samples baited with chickpeas for Pm |
9/43 + Pm isolates |
8/9 (positives) |
1/34 (false negatives) |
|
34/43 nil Pm isolates |
1/9 (false positives) |
33/34 (negatives) |
|
These second season of results for the capability of the soil Pm DNA test are again generally promising, with most samples with positive and negative Pm DNA results corresponding to expected Pm isolation results. However, results for some samples indicate that further work is required to a) identify what factors may contribute to false negative results and b) determine if false positives are due to the presence of dead or inactive Pm DNA.
Pm DNA sampling in paddocks and disease risk determination
The DNA result for a soil sample from a paddock can only provide an indication of inoculum concentration and disease risk for the areas of the paddock which were sampled. Therefore, the spread and locations of sampling across a paddock will affect how representative DNA results are for a paddock. Because of the risk of rapid PRR disease build up following wet conditions it may be appropriate to treat a negative Predicta B® test result as indicating a low risk rather than a nil risk, as the pathogen could still be in areas of the paddock that were not sampled and so still cause PRR and reduce yield.
To maximise the probability of determining the PRR risk of a paddock, target those areas of the paddock where Pm is more likely to occur. The pathogen thrives in high soil moisture contents and so often occurs in low lying regions of paddocks where pooling following rain may occur. The pathogen also carries over from season to season on infected chickpea volunteers, lucerne and, native medics. Including low lying areas and weedy areas of paddocks during PreDicta B® soil sampling may provide the best strategy to identifying a paddocks disease risk of PRR in chickpea.
Detailed information on control of PRR in chickpea is available at the Pulse Australia website
Acknowledgements
This research is made possible by the significant contributions of growers through both trial cooperation, paddocks access and the support of the GRDC, the authors would like to thank them for their continued support. Kurt Lindbeck (NSW DPI), Frank Henry (DEPI) and Peter Keys (DAFQ) kindly located sample sites. Thanks to Gail Chiplin and Kris King for technical support.
Contact details
Sean Bithell & Kevin Moore
NSW Department Primary Industries
Ph: 0429 201 863 & 0488 251 866
Fx: 02 6763 1100
Emails: sean.bithell@dpi.nsw.gov.au & kevin.moore@dpi.nsw.gov.au
Varieties displaying this symbol beside them are protected under the Plant Breeders Rights Act 1994.
® Registered trademark
Was this page helpful?
YOUR FEEDBACK