Soils under an irrigated environment investigating limitations to higher irrigated wheat yields
Soils under an irrigated environment investigating limitations to higher irrigated wheat yields
Author: Sam North (NSW Department of Primary Industries, Deniliquin, NSW), John Hornbuckle (Deakin University, Griffith, NSW), Don Griffin (NSW Department of Primary Industries, Deniliquin, NSW) and Carlos Ballester (Deakin University, Griffith, NSW). | Date: 27 Jul 2016
Background
A three year project entitled ‘Soils under an irrigated environment’ began in July 2014 with the long-term objective to increase grain production and profitability from surface irrigated crops in southern irrigated areas. To achieve this, the project team is seeking to improve our understanding of the interaction between crops, soils, and irrigation and their effects on production. The project is led by the Irrigated Cropping Council in partnership with NSW DPI, Deakin University and Precision Agriculture, with financial support from GRDC and Murray Local Land Service.
There are three components to the project:
- A Situation Analysis to assess current levels of irrigated grain production in southern irrigated areas and the impact of soil type and irrigation design and management.
- Monitoring of a number of commercial crops in the Murray and Murrumbidgee valleys to assess the effect of soil type and irrigation on crop productivity and to identify best practice.
- Small scale field trials to evaluate available technologies identified in the Situation Analysis as having potential to improve irrigated crop production.
All components are on-going and the project is not due for completion until June 2017. However, data collected from commercial wheat crops in 2014 and 2015 is presented here, as it is providing some interesting insights into what may be limiting irrigated winter crop yields.
Methodology
Commercial crops were selected for monitoring across the full range of soils, irrigation systems and climatic zones used by irrigated croppers in the irrigation areas and districts of the southern Murray-Darling Basin. All major soil types were included: grey vertosols (both sodic and non-sodic); red duplex soils (transitional red-brown earths and red-brown earths); and sand-hill soils. Irrigation systems comprised sprinklers (centre pivot and linear move), border check irrigation, contour (rice) surface irrigation, and furrow (beds in bays) and flat terraced surface irrigation systems.
In 2014, 19 sites were monitored in the NSW Murray valley between Berrigan and Moulamein. In 2015, 35 sites were monitored in a wider area extending from northern Victoria to the Murrumbidgee valley.
Soil water sensors were installed in July/early August at depths of 5 and 30cm depths (15cm at sprinkler sites) to monitor the occurrence and duration of any waterlogging or water stress. Soils are considered waterlogged when soil water potential at 5cm is greater than -10kPa, and considered water stressed when soil water potential at 30cm is less than -70kPa (note: 15cm is used as the indicator depth for water stress under sprinkler systems).
Water depth sensors were used to determine the timing, ponded depth, and duration of irrigations.
All sites were visited at the end of tillering, at flowering, and at harvest. Notes were made regarding crop development, presence/absence of disease, weeds, and waterlogging / water stress. Quadrat cuts for analysis of harvest yield components were collected at physiological maturity and processed to obtain yield components (i.e. number of tillers per m2, grains per spike, and grain weight).
Paddock history, paddock yields and header yield monitor data was sought from all co-operators. This data allowed the theoretical potential yield to be estimated for each crop using two methods: a water limited potential calculated from water inputs using the French & Schulz (1984) equation; and a physiological potential calculated from average daily solar radiation and temperature for the 30 days prior to mid-flowering using Rawson’s (1988) equation. Comparing the lower (most limiting) of these two potential yields with the actual yield for each site enabled identification of crops that were limited by factors other than water availability and solar radiation interception during booting and ear emergence. This comparison was only able to be made for 30 crops because of missing data.
Results
In both 2014 and 2015 and across both the Murray and Murrumbidgee valleys, there was a strong, positive correlation between the number of tillers and final grain yield (Figure 1).By contrast, there was little correlation between grains per tiller and final yield (Figure 2) and only a weak correlation between grain size (1000 grain weight) and yield (Figure 3). Yields ranged from 2t/ha up to 8.5t/ha, with a fairly even spread in both 2014 and 2015. All crops monitored in the Murrumbidgee (MIA) in 2015 had yields at the higher end, but this was simply because there were no un-irrigated or deficit irrigated crops in that group.
There are three other main points of note about the data in Figures 1, 2 and 3:
- Grains per tiller was reasonably invariable, with the majority of crops having between 30 and 42 grains per tiller from crops which yielded from 3 to 8.5t/ha.
- Grain size (1000 grain weight) was lower on average in 2015 than it was in 2014.
- It would appear that to achieve at 5t/ha requires at least 350 mature tillers at harvest, between 30 and 42 grains per tiller and grains larger than 30g per 1000 grains.
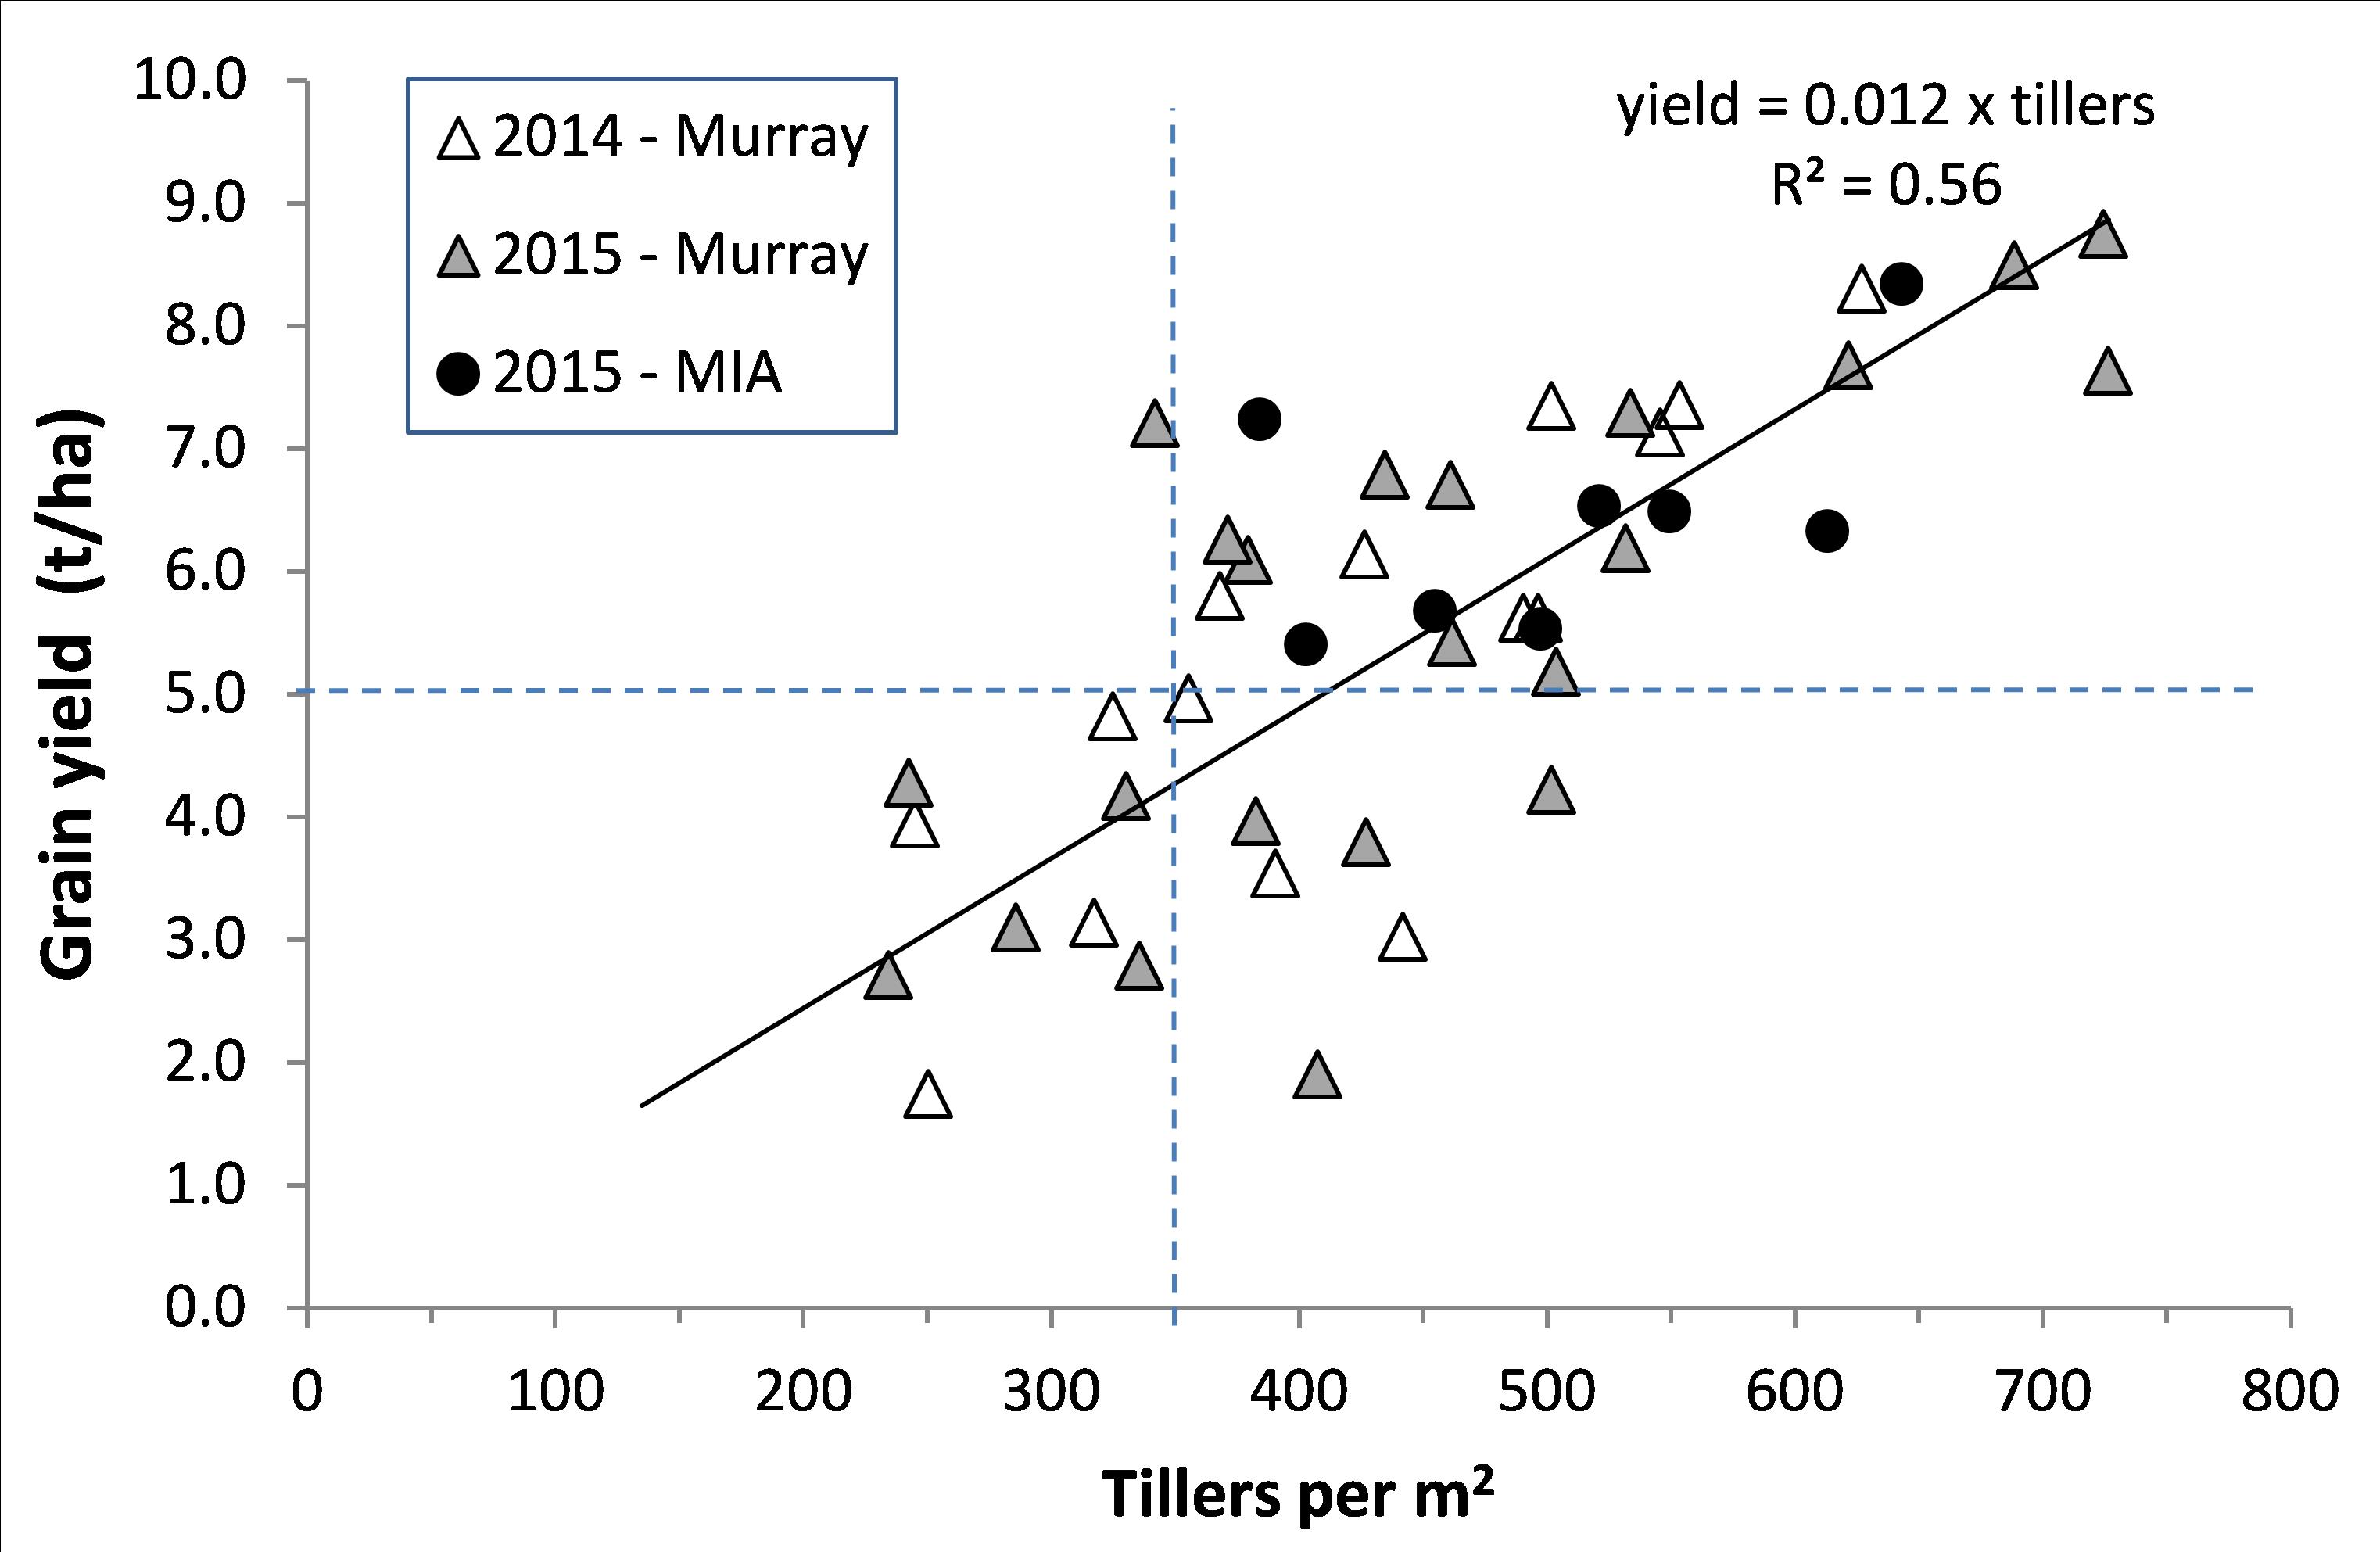
Figure 1: Plot of grain yield on tillers per m2 from the quadrat cuts taken at physiological maturity in 2014 and 2015. The vertical and horizontal dashed lines indicate a minimum of 330 mature tillers/m2 is required to achieve a yield of 5t/ha.
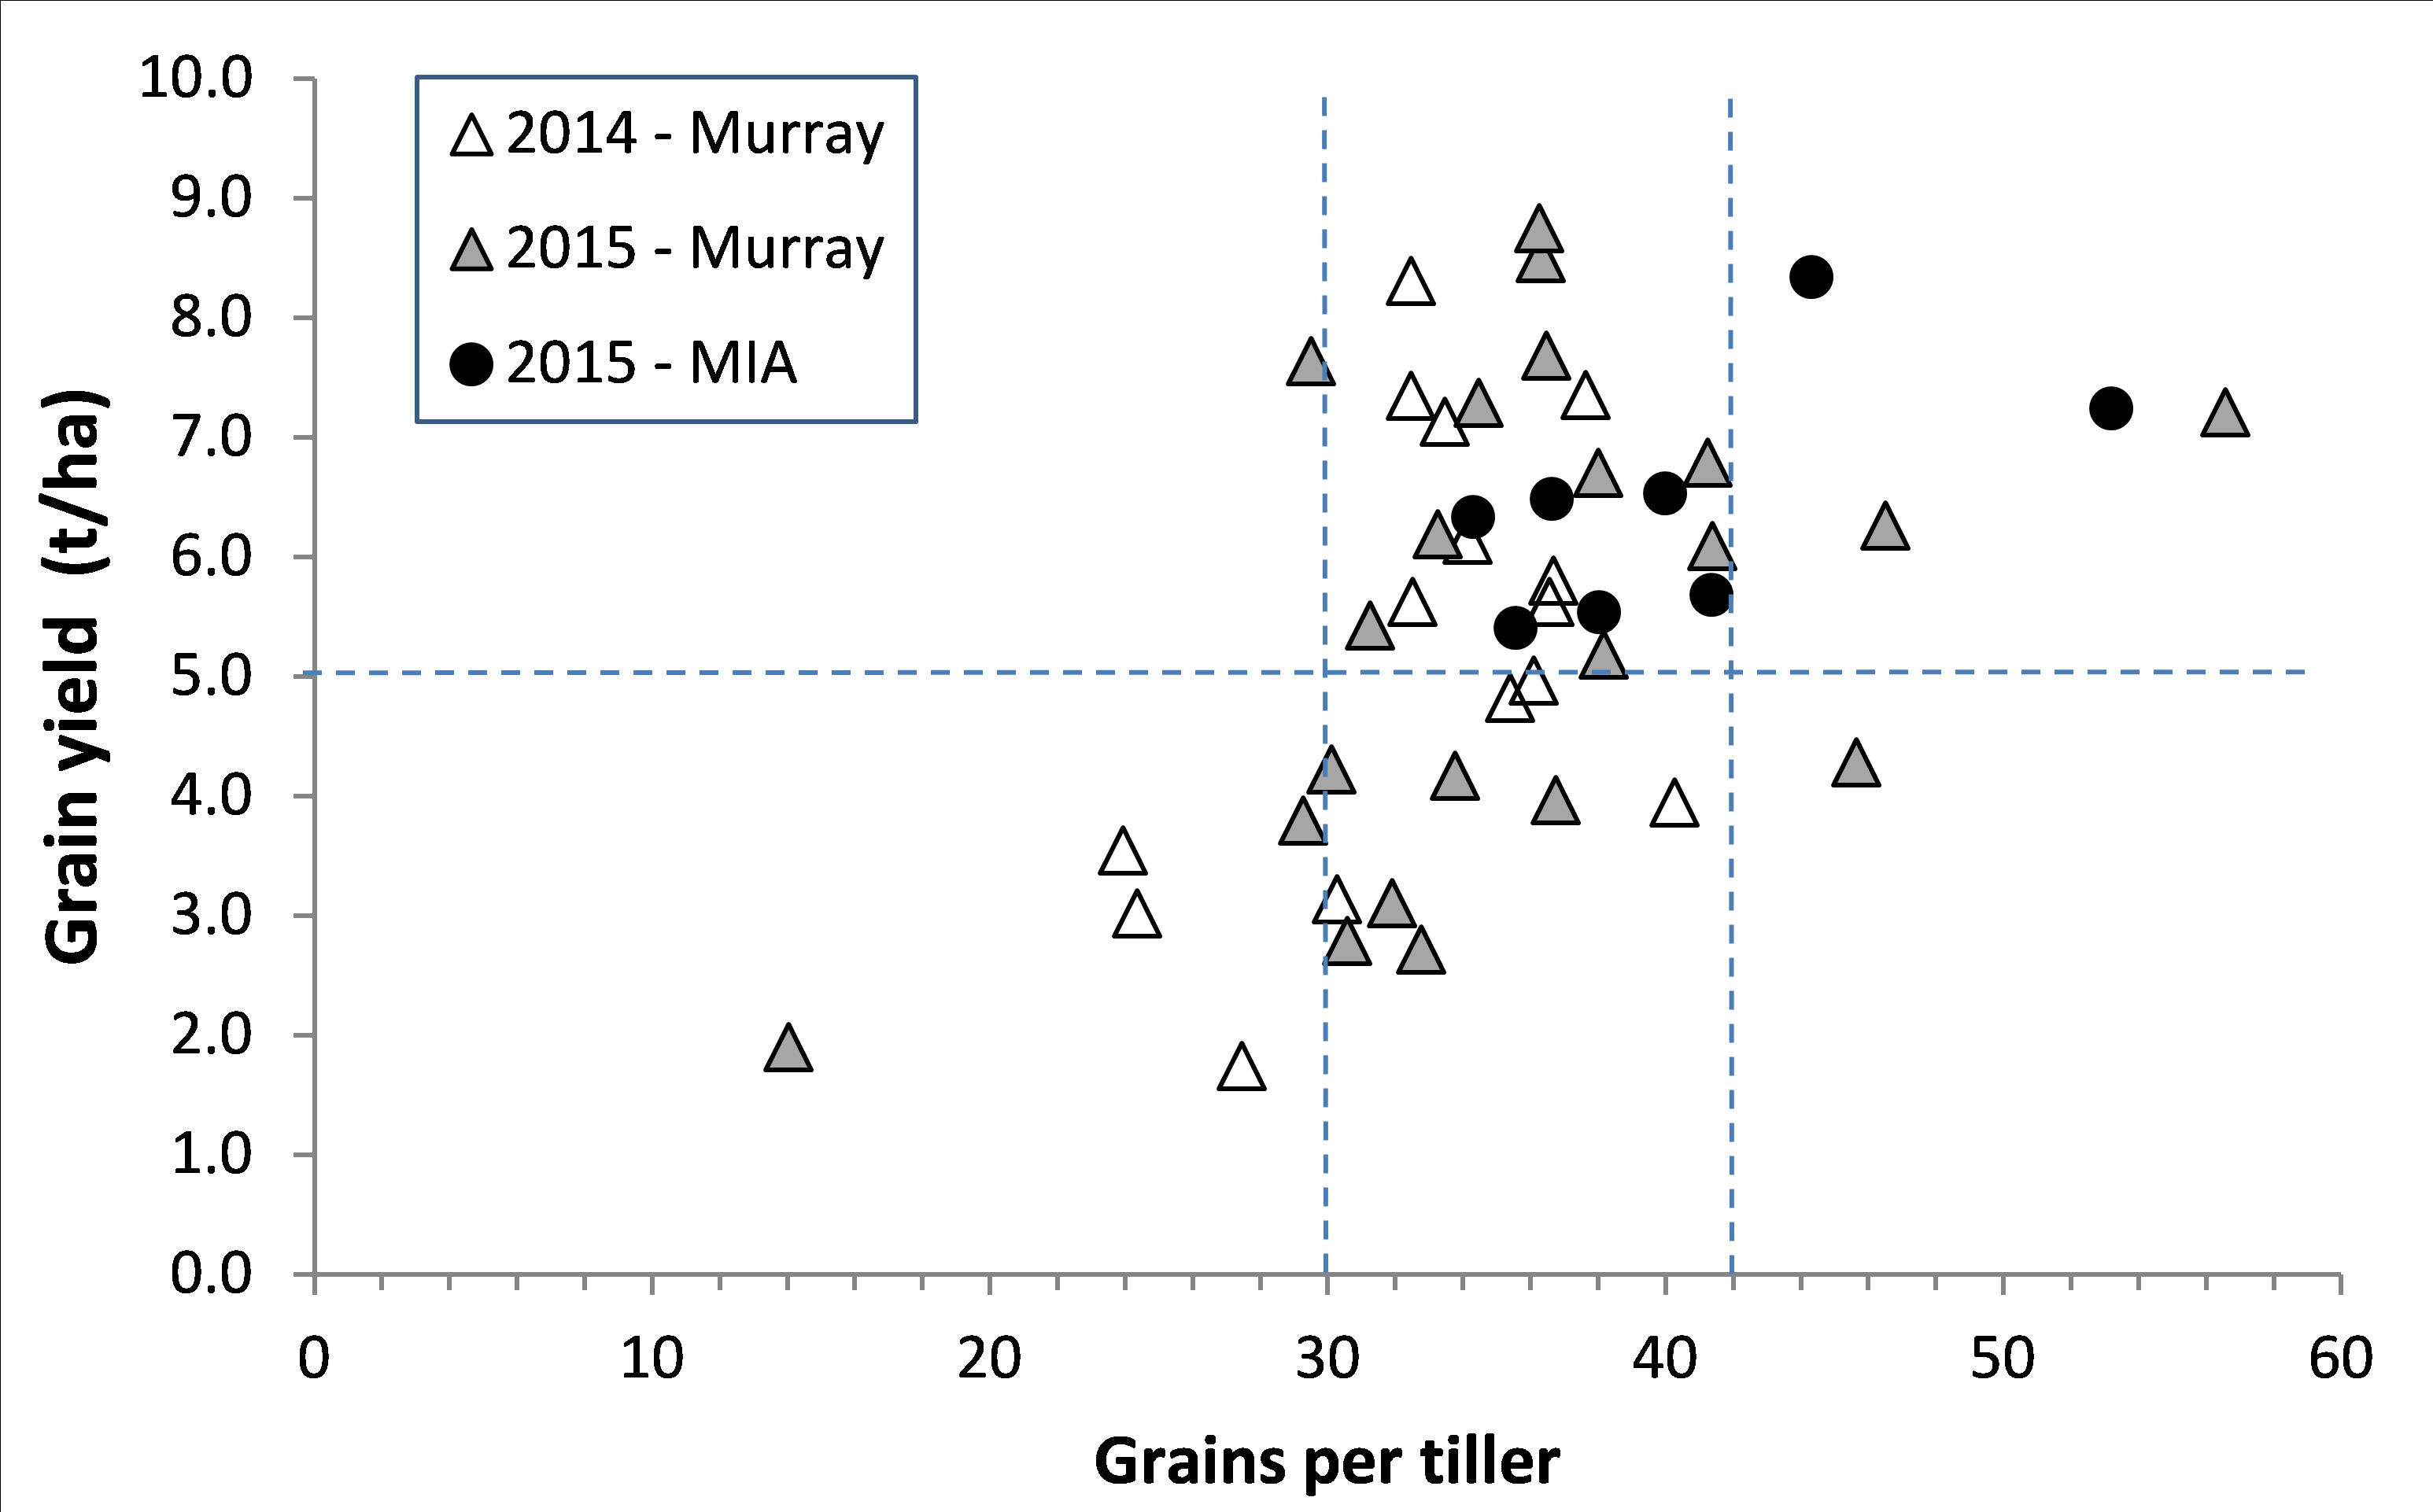
Figure 2: Plot of grain yield on grains per tiller from the quadrat cuts taken at physiological maturity in 2014 and 2015. The dashed lines indicate a minimum of 30 grains per tiller is required to achieve a yield of 5t/ha.
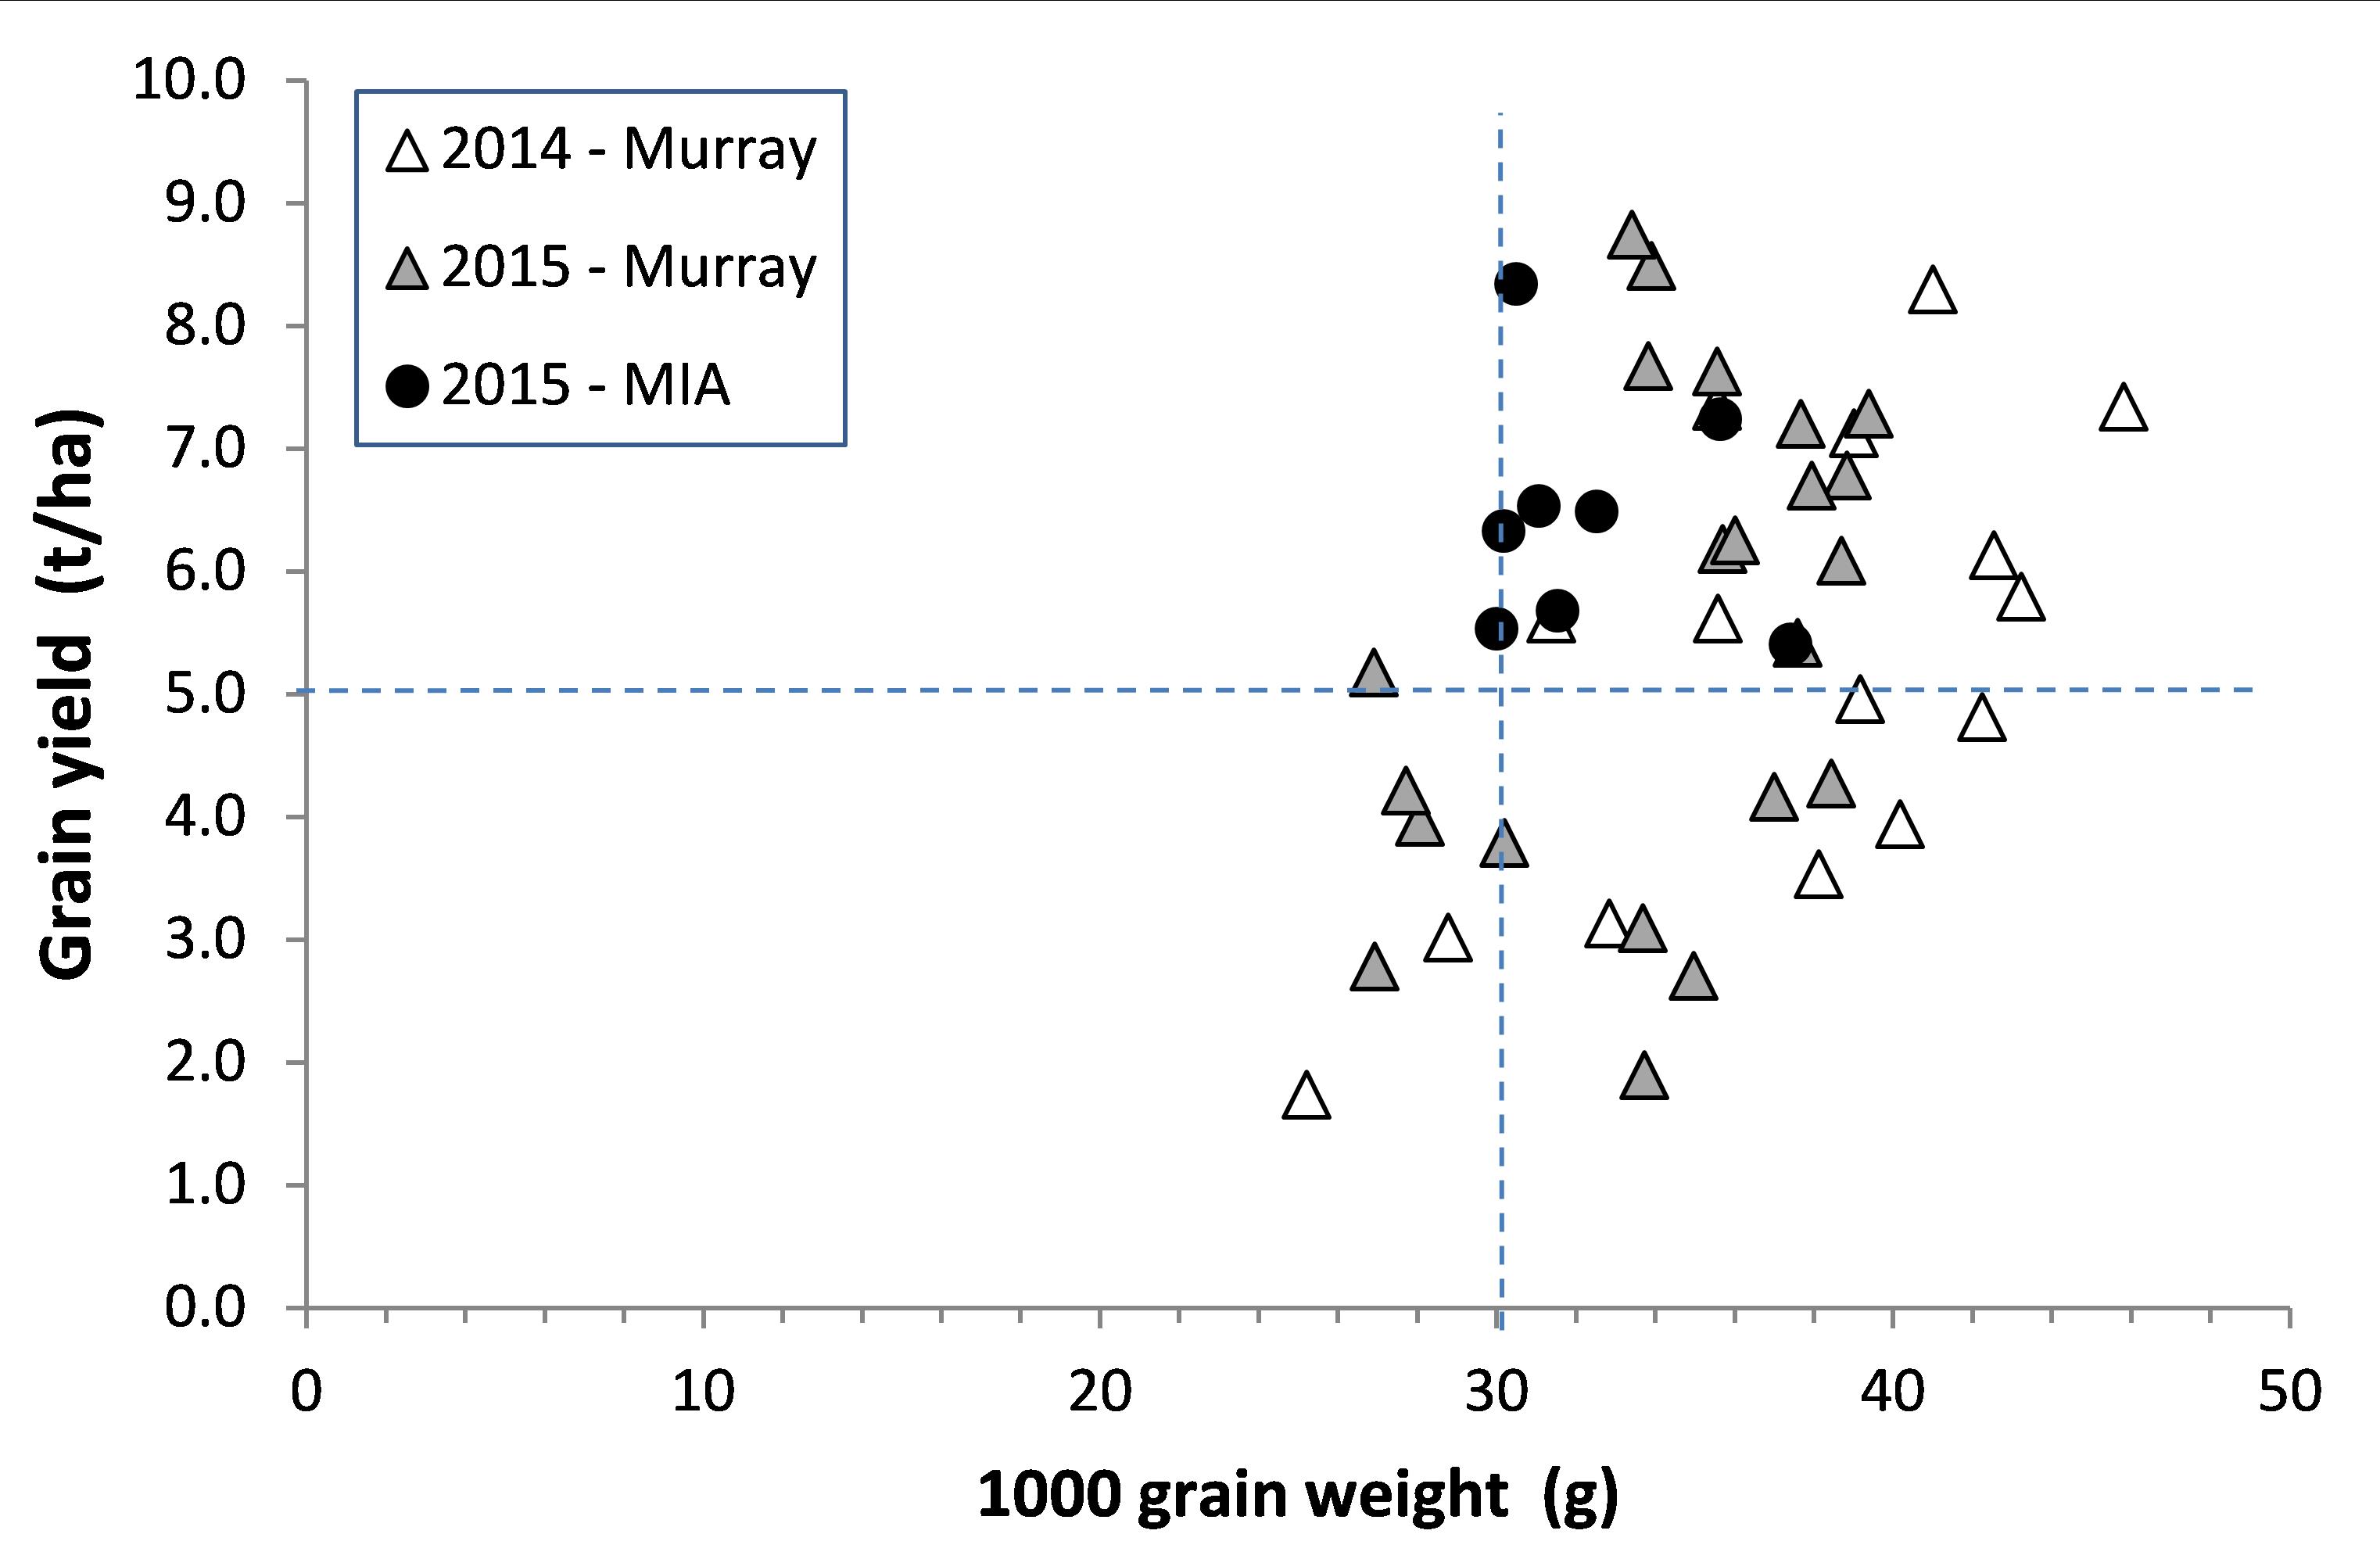
Figure 3: Plot of grain yield on 1000 grain weight from the quadrat cuts taken at physiological maturity in 2014 and 2015. The dashed lines indicate a minimum 1000 grain weight of 30g is required to achieve a yield of 5t/ha.
In regard to seasonal conditions, 2014 was wet in May and a number of crops became waterlogged following sowing. This reduced tiller numbers and hence final yield. Many irrigators may also remember the first week of October in 2015 when very hot weather coincided with flowering for many crops. Wheat doesn’t like temperatures > 27oC, and temperatures > 30oC reduce pollen viability and hence seed set. In 2015, there were five consecutive days (2-6 Oct) hotter than 27oC, four of which were hotter than 30oC. However, this was not dissimilar to the same period in 2014 when there were six days (4-6 and 10-12 Oct) hotter than 27oC, four of which were hotter than 30oC.
With spring irrigations, data on ponded water depth versus time was obtained from 22 individual surface irrigation events in 13 different layouts across four different systems (border check, beds –in-bays, V-bays, and lasered rice contours). Maximum ponded depths during these events ranged from 40-60mm in the border check systems, 100-130mm in the terraced beds-in-bays; 40-150mm in the V-bays; and 50-190mm in the contour systems. Ponding durations followed the same pattern as water depth (Table 1), with lower ponded depths generally equating to shorter irrigation times. In all basin systems (beds-in-bays, v-bays, contours), irrigation management appeared to be the key factor in determining ponded depth and duration, with cut-off times of around 12 or 24 hours suited to minimising labour rather than to minimising waterlogging risk or over-application of irrigation water.
Table 1: Layout types, maximum ponded depths (mm), and Irrigation and drainage times (hours) from 20 spring irrigations of crops in the Murray and Murrumbidgee valleys that were monitored by the project team in 2015.
| Layout type | Farm | Max depth water (mm) | Time to cut-off (hrs) | Time to drain (hrs) | Duration of ponding (hrs) |
|---|---|---|---|---|---|
| Border check |
A | 70 | 2 | 16-18 | 18-20 |
| Fi | 30-40 | 19.5-23 | 2-2.5 | 22-25 | |
| Md | 50-60 | 11-12.5 | 3-3.5 | 14-16 | |
| Beds in bays |
Bl | 120-150 | 6-11 | 15-20 | 26 |
| Bt | 110-120 | 7-9 | 3.5-29 | 12.5-38 | |
| Na | 250 | 10 | 40 | 50 | |
| V-bays |
K | 40-80 | 6 | 8-16 | 14-22 |
| L | 60-80 | 25 | 20 | 45 | |
| L | 120-150 | 10-13.5 | 35-46+ | 45-60+ | |
| Contour |
Ml | 10-12 | 42-50 | 54-60+ | |
| Ma | 20 | 38 | 58 | ||
| S | 18 | 30 | 48 | ||
| Fo | 16-20 | 60+ | 80+ | ||
| Mc | 110-140 | 30-40 | 10 | 40-50 |
Comparison of actual and potential yields for the 30 crops we currently have data (Figure 4) showed:
- Sixteen crops were water limited but yielded close to their water limited potential. These are the points close to the 1:1 (dashed) line within the ellipse.
- Three crops were water limited but did not yield to their potential. All three crops were late sown and un-irrigated. Drought stress prior to flowering reduced grains/tiller in two of these crops (Figure 2) and waterlogging after sowing then drought during grain fill reduced both tiller numbers and grain weight in the third crop which had been sown straight after rice.
- Nine crops yielded well below their potential because of waterlogging and other soil constraints. Waterlogging following sowing reduced tiller numbers in three crops in the Murray in 2014 and was a persistent problem following slow surface irrigations of crops on heavy clays (possibly sodic) at three sites used in both years. Cut areas reduced yield in one recently land-formed paddock in 2015.
- Two crops received four spring irrigations in 2015 and yielded 8-9t/ha. A large rain event in early November 2015 added water to these crops which was still in the profile at harvest, resulting in unrealistically high water limited potential yields.
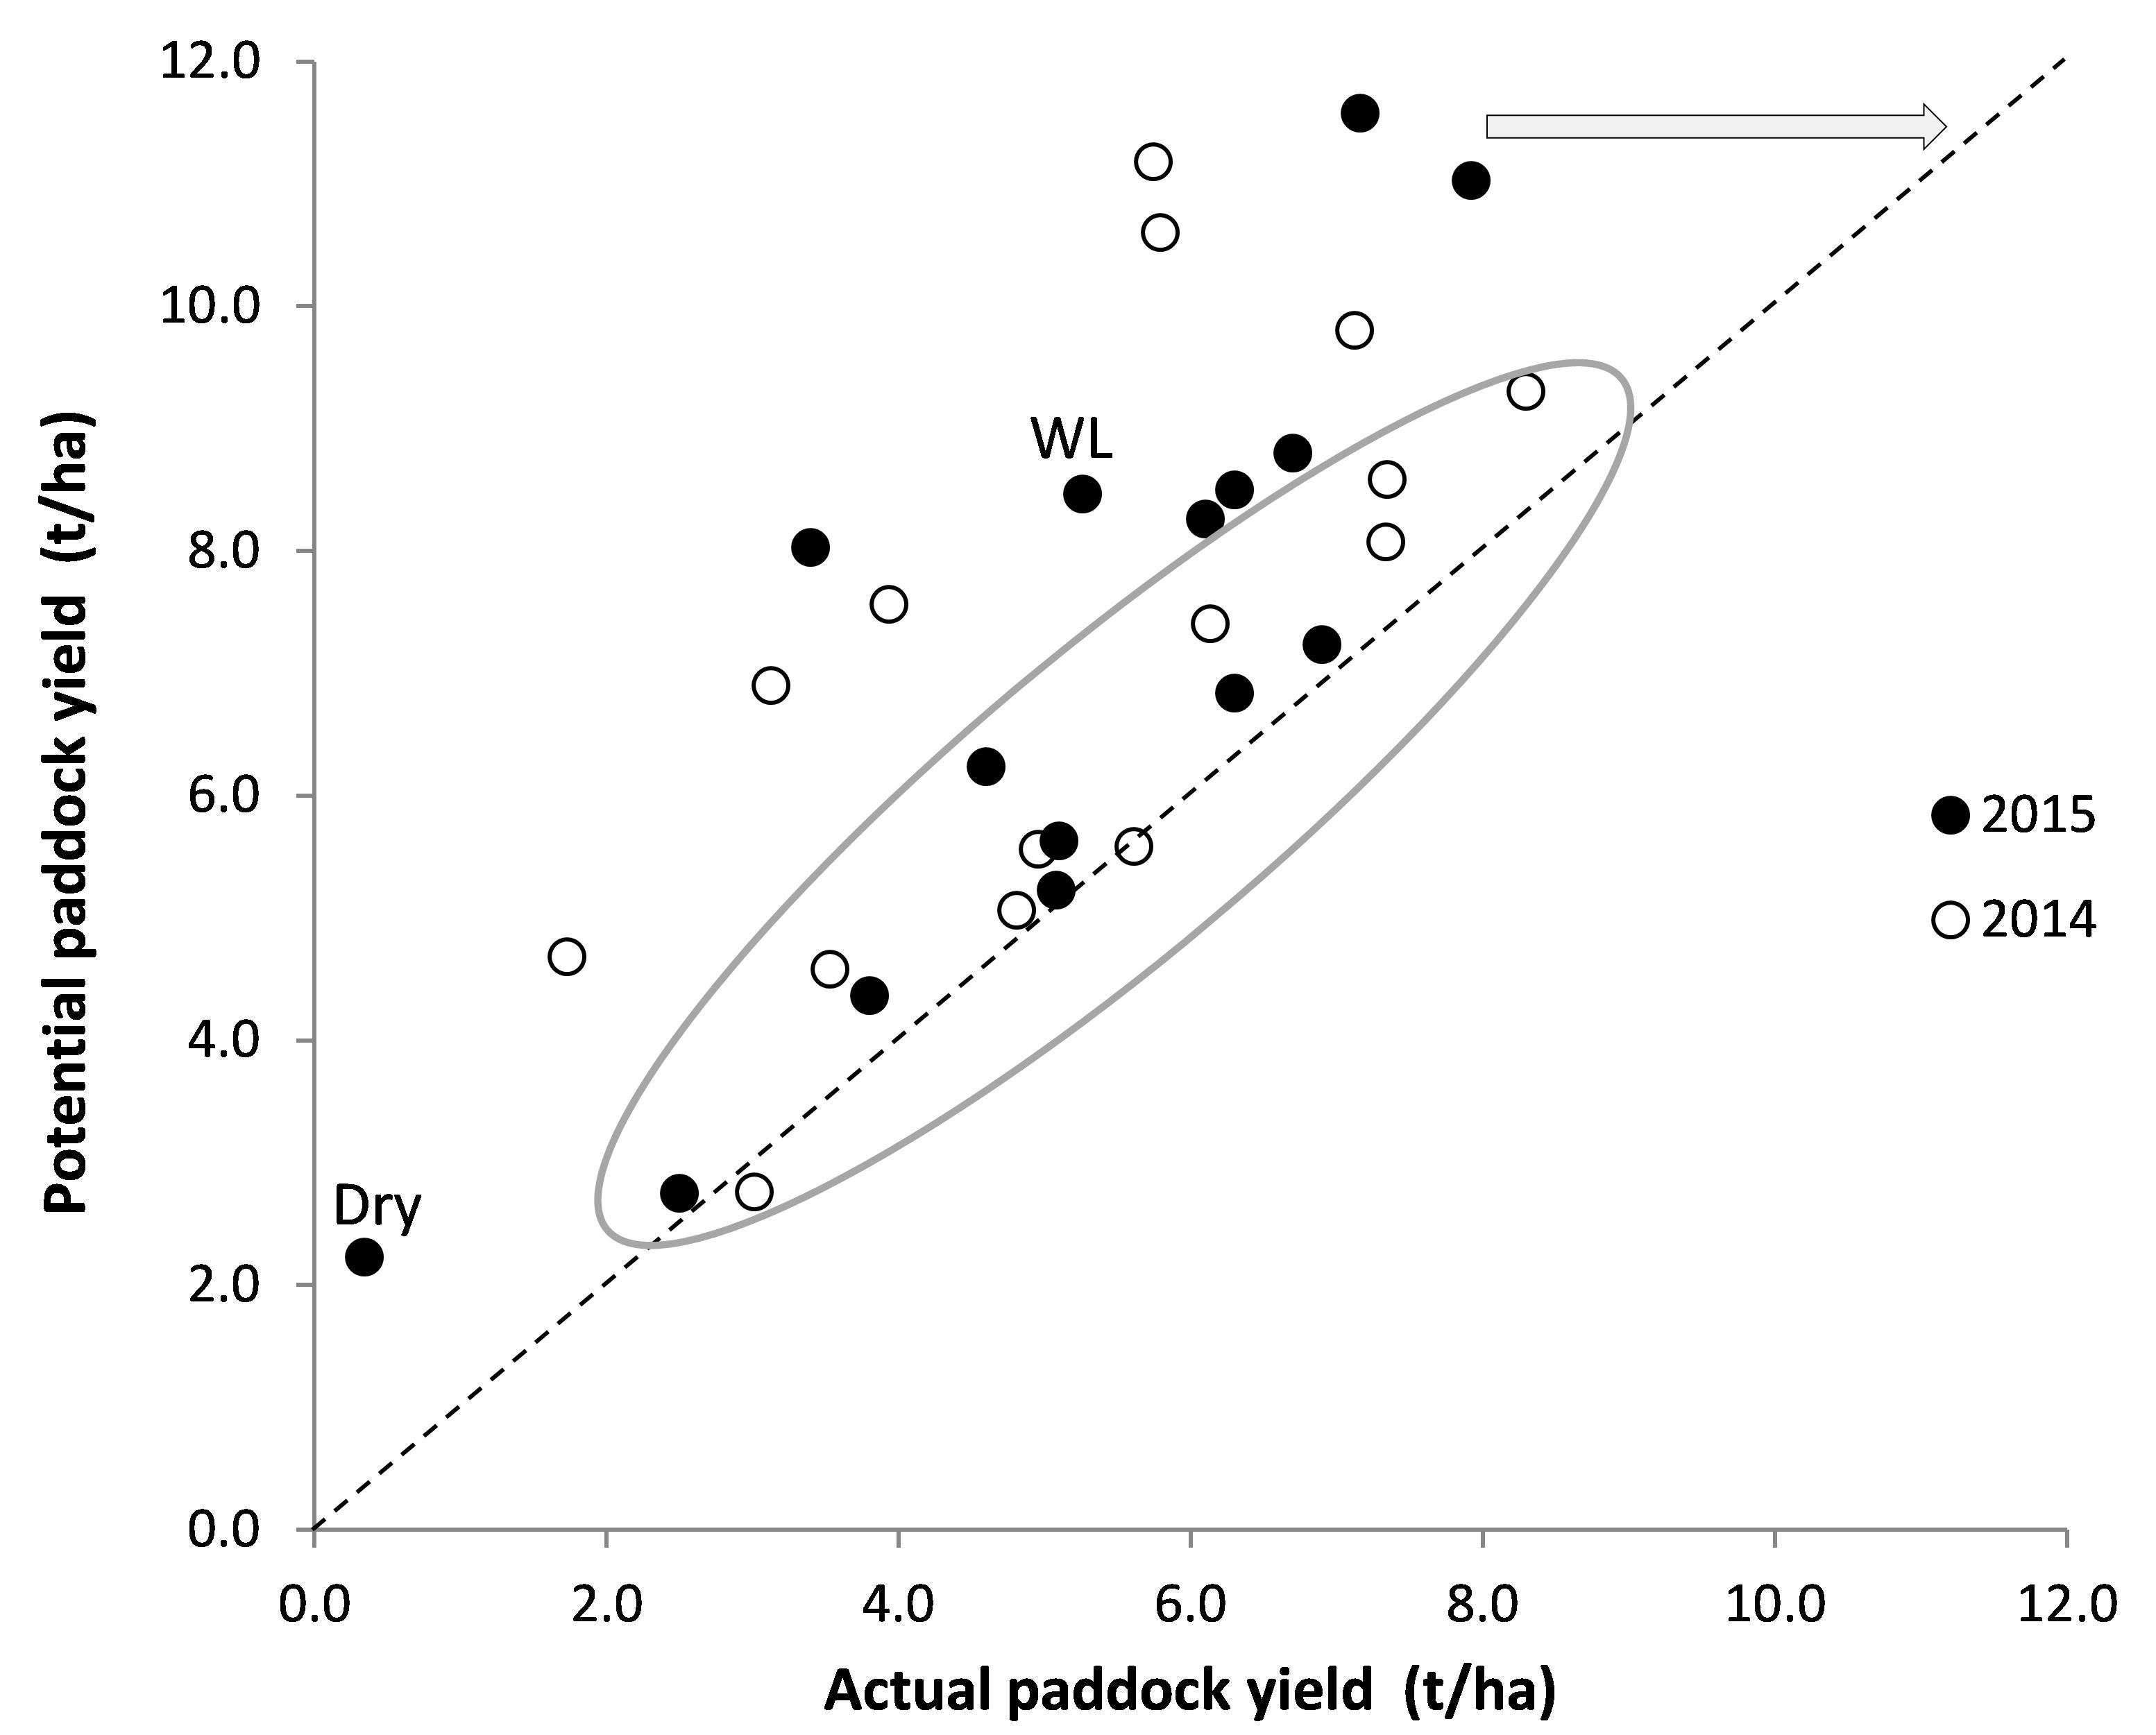
Figure 4: Plot of potential yield against the actual yield of wheat crops monitored in 2014 and 2015. Potential yield is the lower of the water limited potential estimated from water inputs using French & Schulz’s (1984) equation, and the physiological potential estimated from photothermal quotient for 30 days to mid-flower using Rawson’s (1988) equation.
Discussion
Water was the limiting factor for all bar two crops, yet half the crops monitored were managed so they yielded at or near their potential. This was achieved by having a stand density (tillers/m2) which matched the amount of water that these crops received and, for spring irrigated crops, by good irrigation timing. These spring irrigated crops were not water stressed in the 20 days prior to flowering, ensuring these crops had greater than 30 grains/tiller.
Advice to irrigators’ stresses the importance of having adequate moisture for cereals during the period from 20 days before to 10 days after mid-flowering. This equates to the time from flag leaf fully emerged (DC39) to the end of milky dough stage (DC80) when the spike develops and then flowers, and the kernel reaches its full size. It is important keep the crop ‘happy’ during this period because this is when the number of grains per spike is set and when yield formation is most sensitive to drought (Thompson and Chase, 1992). The maximum number of grains/spike is relatively fixed in cereals and is determined firstly by genetics and secondly by temperature and radiation interception during spikelet formation and stem elongation. Thus, whilst yield is reduced by the effect of drought or high temperature in this stage of crop growth because of the impact on grain formation (grains/spike), the opposite is not true if conditions are good. This is because it is not possible to increase the number of grains/spike above the maximum achievable for a particular variety in a given environment, even if the crop has access to all the water and nutrients it needs.
In the crops we monitored, grain number per tiller was relatively ‘constant’ (30 to 42 grains/tiller) and the main driver of yield was tillers/m2. This shows two things. Firstly, that the irrigators in this group generally understand the importance of irrigating crops early in spring to ensure adequate water availability from booting through early grain fill. Secondly, that most of these crops were managed so canopy size at flowering (i.e. tiller number) matched water availability from boot stage to maturity, given half the crops achieved yields at or close to their water limited potential.
For the crops which did not achieve near their potential yield, the two main contributing factors were waterlogging and drought. Waterlogging occurred both after winter rainfall, where it reduced plant and tiller numbers (which reduced yield potential in line with later water availability in some crops), and following slow irrigations on heavy clay (possibly sodic) soils (Table 1). The drought affected crops were all late sown. The problem here is not that these crops were unirrigated. Rather, that these crops were flowering later and filling grain at a hotter (drier) time and this severely reduced grains/tiller and grain weight.
There were other factors which contributed to less than potential yields, such as cut areas in recently land-formed paddocks and storm damage, but these were isolated rather than general cases. High temperatures at flowering may have been a factor, but it occurred in both 2014 and 2015 and it was mostly water that limited crops, not radiation and temperature. It does highlight the importance of sowing on time (and early in the recommended window) to ensure that flowering occurs at the end of September.
Lower grain weight, particularly in the Murrumbidgee, also contributed to lower yields in 2015, with average grain weights being 37g/1000 grains and 34g/1000 grains in 2014 and 2015 respectively. The drier spring in 2015 and the lower availability / higher price of irrigation water that year meant that crops were not irrigated, even though they needed an irrigation in late grain filling.
Conclusions
Set a target yield
The overall impression from our study to date is how well matched crops have been to the amount of water applied to them, with half the monitored crops in the study achieving at or close to their water limited potential yields. Because crop potential is water limited, it is very important to match canopy size (tiller number) to the anticipated amount of irrigation water available in spring.
We are seeing that it is easy to lose yield if a crop is not well watered, but to increase yield it is more important to firstly increase tiller numbers and secondly (if water and crop price make it profitable) to finish crops off properly (while flag is still green) and ensure large grains.
Waterlogging is a major ‘risk’ to consistently achieving higher yields
Waterlogging of crops by rainfall after sowing and by slow irrigations on heavy clay (possibly sodic) soils has been the major yield limiting factor in the crops we have monitored. The interaction of irrigation and soil type for these crops is being examined, but improved paddock drainage is certainly indicated if higher yields are to be achieved in these layouts.
Any water stress between early boot to milky dough will reduce cereal crop yields
The message about irrigating to ensure crops have sufficient water from booting though early grain fill seems to have been heard by most irrigators in this study. Crops that did experience drought stress through this time had severely reduced yields and this was exacerbated by late sowing.
References
French RJ and Schultz JE (1984) Water use efficiency of wheat in a Mediterranean-type environment. I. The relation between yield, water use and climate. Aust. J. Ag. Res. 35, 742-764.
Rawson HM (1988) Effects of high temperature on the development and yield of wheat and practices to reduce deleterious effects. Pp. 44-61. In: AR Klatt (ed.). Wheat production constraints in tropical environments. (CIMMYT: Mexico)
Thompson JA, Chase DL (1992) Effect of limited irrigation on growth and yield of a semi-dwarf wheat in southern New South Wales. Aust. J. Exp. Ag. 32, 725-30.
Acknowledgements
This research is a collaborative project between the GRDC and Murray Local Land Services. The research undertaken as part of this project is made possible by the significant contributions of growers through both trial cooperation and the support of the GRDC, the author would like to thank them for their continued support.
The project team comprises the following hardworking members: Rob Fisher (Irrigated Cropping Council), John Hornbuckle and Carlos Ballester (Deakin University); Tim and Peta Neale (Precision Agriculture); and Don Griffin and Jeremy Giddings (NSW DPI). The assistance of John Fowler and Adrian Smith (Murrray Local Land Services) and all our co-operators across northern Victoria and southern NSW is gratefully acknowledged.
Contact details
Sam NorthNSW DPI Regional Office, Deniliquin, NSW
03 5881 9926
samuel.north@dpi.nsw.gov.au
GRDC Project Code: ICF00008,