Canola agronomy and phenology to optimise yield
Take home messages
- Improved knowledge of how canola varieties develop in differing regions and the drivers behind development will assist growers in choosing the correct variety for a particular sowing opportunity.
- The development of site specific optimal flowering windows, where the balance between plant growth and frost and heat risks are accounted for, will allow growers and advisers to match canola variety selection with sowing opportunities.
- Nitrogen (N) is an important driver of canola yields in above average seasons. Low risk techniques to ensure adequate N supply are critical to capitalise on above average rainfall in the low rainfall zone.
Background
Research to better understand the yield drivers of canola in eastern Australia commenced in 2014, and continued in 2015 and 2016, focusing on improving the profitability of canola as part of the Optimised Canola Profitability (OCP) project. The research is targeted at low to medium rainfall zones of Eastern and Southern Australian cropping regions and is a collaboration between CSIRO, NSW DPI and GRDC, in partnership with SARDI, Charles Sturt University (CSU), Mallee Sustainable Farming (MSF) and the Birchip Cropping Group (BCG). The project links closely with similar GRDC supported projects in Western Australia (WA) and high rainfall zones (HRZ).
2016 season
The 2016 season in South Australia (SA) was typified by average to above average rainfall in most of the cropping region between April and August and then significantly higher than average rainfall in September and October. Average daily temperatures (daily maximum minus daily minimum divided by two) tended to be average to slightly warmer than normal between April and August and then considerably below average in September and October. Solar radiation was lower than normal (approx. 8% below average figures), placing 2016 as having one of the lowest cumulative totals of solar radiation for the growing season on record.
All of these factors had an effect on canola yields observed in 2016, challenging some of the results gathered by this project in previous years.
2016 results
Similar to 2014 and 2015, in 2016 three time of sowing (TOS) x variety experiments were conducted at Yeelanna (Lower EP), Hart (Mid North) and Lameroo (Murray Mallee), with grain yields shown in Table 1.
Variety | Yeelanna | Hart | Lameroo | ||||||
|---|---|---|---|---|---|---|---|---|---|
8-Apr | 20-Apr | 6-May | 15-Apr | 2-May | 16-May | 13-Apr | 28-Apr | 12-May | |
44Y89CL | 3.11 | 3.76 | 2.99 | 2.16* | 2.67 | 2.83 | 2.11 | 2.41 | 1.83 |
45Y88CL | 3.86 | 3.22 | 3.77 | 2.36* | 2.81 | 3.08 | 2.01 | 2.19 | 1.53 |
Archer | 3.72 | 3.87 | 3.43 | 2.80* | 3.17 | 3.05 | 2.14 | 1.86 | 1.27 |
ATR_Gem | 2.72 | 2.78 | 3.40 | 1.69* | 2.47 | 2.31 | 2.04 | 1.74 | 1.24 |
ATR_Stingray | 2.11 | 2.89 | 2.42 | 2.00* | 2.77 | 2.92 | 1.24 | 1.82 | 1.38 |
Hyola® 559TT | 3.45 | 3.49 | 3.78 | 2.47* | 3.03 | 3.05 | 2.18 | 2.31 | 1.61 |
Hyola® 575CL | 2.91 | 4.04 | 4.45 | 1.98* | 2.58 | 2.61 | 1.71 | 1.87 | 1.67 |
Hyola® 750TT | 3.53 | 3.42 | 3.20 | 2.23* | 2.81 | 2.39 | 2.09 | 1.65 | 1.17 |
Nuseed Diamond | 3.35 | 4.19 | 4.36 | 1.94* | 2.08 | 3.26 | 1.80 | 2.74 | 1.76 |
Average | 3.20 | 3.52 | 3.53 | 2.18 | 2.71 | 2.83 | 1.92 | 2.06 | 1.50 |
lsd 5% (TOS) | 0.16 | 0.18 | 0.17 | ||||||
lsd 5% (variety x TOS) | 0.47 | 0.53 | 0.52 | ||||||
p (variety x TOS) | <.001 | <.001 | 0.03 | ||||||
GS Rainfall (Jan-Mar) | 449mm (71mm) | 330mm (62mm) | 300mm (47mm) | ||||||
* Yield adjusted to account for bird damage
These data show that the secondand third sowing times at Yeelanna and Hart and yields in TOS1 and TOS2 at Lameroo resulted in the highest yields in 2016. This reflects the cooler and wetter finish to the season experienced in 2016.
The 2016 experiments showed that short season variety Nuseed Diamond sown at TOS3 gave the highest grain yields at Yeelanna and Hart. Longer season variety, Archer yielded well in TOS1, but failed to match the yields of Nuseed Diamond sown late.
It should be noted that early flowering varieties sown early suffered from higher levels of upper canopy blackleg and sclerotinia infection than later sowings. See paper by Marcroft et al. 2017 (Grains Research Update).
Given that experiments in previous years have demonstrated considerable benefits from sowing early, results from 2016 raise the question of how yields can be maximised in every season. 2016 was a usual year from an historical sense of the grain growing regions of SA, but demonstrated how vitally important it is to capitalise on the opportunities of late season rainfall.
The answer lies with gaining a better understanding of what triggers varietal development in canola and then using that information coupled with historical climate data for a particular locality to choose a variety that will perform to its maximum potential for the planned sowing window.
How do canola varieties develop and why is it important?
The most common and easily recognised stages of canola development are emergence, green bud, flowering, podding and maturity. To determine when to move from one growth stage to another, plants respond to environmental signals such as temperatures.
It is important that canola flowers within a particular window to avoid the high risk of winter frosts at one end of the season and risks of high temperature heat stress at the other. If planned sowing rains occur in a particular month, you can match a variety’s maturity to ensure its flowering inside the optimum window every year. An understanding of phenology for different varieties allows specific variety selection to ensure flowering occurs at the optimum time, and the risk of crop loss is reduced.
The development of canola crops is largely driven by temperature (thermal time), but is also affected by vernalisation and photoperiod to differing degrees in different varieties.
Thermal time
Day degrees are the units of a plant’s biological clock. They are a way of combining time and temperature into a single number. To calculate the thermal time target for a plant’s development stage, the day degrees are accumulated until a specific target is reached, for example, variety X accumulated 1,000 degree days between emergence and flowering.
Vernalisation
Vernalisation can be described as a low temperature promotion of flowering. For canola, if the average temperature is 2oC or below, then one vernal day is accumulated — no vernal days are accumulated if the average temperature is below 0 or greater than 15. Between 2oC and 15oC, only a proportion of a vernal day is accumulated.
There are two types of vernalisation — obligate and facultative.
Obligate vernalisation is the need for a plant to accumulate cold days before the day degree calculation can begin. This typically drives the development of winter type canola varieties.
Facultative vernalisation occurs in both spring and winter type canola. It simply means the more cold days the plant accumulates between sowing and floral initiation (stage before green bud), the lower the thermal time target required.
Photoperiod (day length)
Photoperiodism is the response of plants to increasing or shortening day lengths. Long day plants (canola) respond to increasing day length. As winter moves to summer, the days lengthen and the crop requires fewer day degrees to move between growth stages so flowers earlier.
Once the drivers of phenological development for a particular variety are understood, they can be used in models, such as APSIM, to determine how they will grow and develop in a particular environment. But to maximise yield, as discussed previously, an optimal flowering window for that environment needs to be developed and then an optimal sowing date for the variety extrapolated.
Optimal flowering period (OFP) for canola in SA
Crops which flower too early may have insufficient biomass or frost damage, while late flowering increases heat and water stress. Despite their importance, OFPs for canola have not been comprehensively defined for canola across eastern Australia’s cropping zone, especially for crops sown prior to the traditional sowing window (late April to early May). Identifying the OFP is a first step to establish appropriate variety by sowing date combinations to optimise yields in different environments.
Figure 1 shows how APSIM modelling can be used to develop an OFP for an example environment, where flowering ideally occurs when frost and heat stress risk are minimised. Once this is known, the ideal sowing date can be generated for a variety based on historical meteorological data and knowledge of the drivers of the variety’s phenological development.
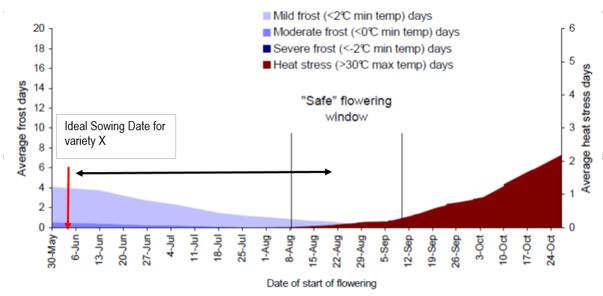
Figure 1. Example of how an optimal flowering period is generated and then an ideal sowing date is developed for a specific environment.
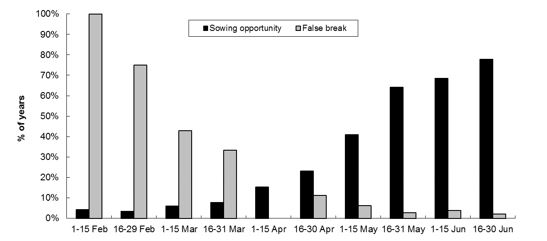
Figure 2. Sowing opportunities at Hart.For fortnightly periods, the frequency of years with a sowing opportunity (i.e. rainfall > pan evaporation over seven days) and the likelihood of a false break with no further effective rain (i.e. rainfall < pan evaporation over seven days) in the subsequent six weeks.
Figure 2 shows how, once an optimal sowing date for a particular variety is known, then historical meteorological data can be used to determine how likely a sowing opportunity within the optimal window occurs for that location.
The development of optimal flowering windows for SA is now well advanced. An increased understanding of the phenological drivers of recently released canola varieties is also being updated into crop models such as APSIM, meaning that growers and advisers will shortly have access to techniques that offer the potential to improve canola productivity in their region.
Low risk strategies for low rainfall canola
Research and grower experience have demonstrated the benefits of including canola in the crop rotation, as a highly effective tool to manage soil borne diseases (particularly rhizoctonia) and to control grass weeds. Cereal crops following canola in the low rainfall zone have consistently yielded up to 0.4t/ha more than maintaining continuous cereal, through reduced root disease and weed burdens. However, many growers in the low rainfall zone have been frustrated by the highly variable profitability of canola as a stand-alone crop. Dry springs, high input costs and episodic pest incursions have impacted the profitability of canola over the past five years. If canola is to be a sustainable, long term break crop option in low rainfall areas, growers require low risk management systems.
Trials conducted from 2013-2015 have indicated that TOS has had a far greater impact on canola productivity than establishment number, sowing depth and variety choice.
TOS | Dates | Average Yield (t/ha) |
|---|---|---|
1 | 15-25 April | 1.83 |
2 | 26 April- 6 May | 1.58 |
3 | 9-18 May | 1.26 |
4 | 19-29 May | 0.95 |
Trials at Minnipa and Mildura in 2015 also indicated that canola productivity was best with early N application, and unlike other environments, waiting until stem elongation for N application resulted in a 10-20% yield penalty.
Following these initial findings, a co-ordinated series of trials at three low rainfall locations (Mildura, Minnipa and Karoonda) were established in 2016 to evaluate options to manage risk in canola crops without yield penalty, such as:
- Delaying N inputs.
- Optimising N inputs according to soil type.
- Optimising sowing date (while keeping canola at the very beginning of the sowing program).
Preliminary results from these trials indicate that time of N application was not as important as the quantity available to the plant — again proving that N is an important driver of canola yields and must be managed in the low rainfall zone for the crop to be profitable.
Conclusion
The grain yields achieved in field experiments conducted at Yeelanna, Hart and Lameroo in 2016 showed that having the correct variety x TOS combination enabled yields to be maximised.
An increased understanding of how a canola variety develops can be used in combination with the development of optimum flowering windows for a particular location so that optimal sowing times can be generated.
Managing canola risk in low rainfall areas remains challenging if yields are to be maximised in above average rainfall seasons.
Useful resources
Acknowledgements
This work is a component of the 'Optimised Canola Profitability' project (CSP00187), a collaboration between NSW DPI, CSIRO and GRDC, in partnership with SARDI, CSU, MSF and BCG. The research undertaken as part of this project is made possible by the significant contributions of growers through both trial cooperation and the support of the GRDC — the author would like to thank them for their continued support.
Thank you to the numerous SA growers and Hart Field-Site group for making their land available for the field trials and to the technical officers of the SARDI New Variety Agronomy group for their assistance in conducting the field trials.
Contact details
Andrew Ware, PO Box 1783 Port Lincoln, SA 5606
0427 884 272
andrew.ware@sa.gov.au
GRDC Project Code: CSP00187,
Was this page helpful?
YOUR FEEDBACK