Stubble management recommendations and limitations for frost prone landscapes
Author: Rebecca Smith, Living Farm, David Minkey Western Australian No Till Farmers Association, Trent Butcher Consult Ag, Sarah Hyde Facey Group, Sarah Jackson, DAFWA, Karyn Reeves, DAFWA and Ben Biddulph, DAFWA | Date: 27 Feb 2017
Key messages
- Position in the landscape influences temperature variations, frost damage and yield more than management practices.
- Increasing stubble rates increases severity and duration of frost events and results in increased frost damage and decreased yield.
- In the absence of frost, once off stubble reductions do not reduce yield or yield components.
- Following multiple severe frost events, stubble reduction does not increase yield.
- The ability of stubble management to manage frost risk is site, season and landscape specific.
Aims
To determine whether reducing stubble load through various management practices can reduce the severity, duration and damage from frost in wheat crops in paddocks with low, medium and high frost severity in the low and medium production environments in WA.
Method
Paddocks with a high history of frost events over the last ten years were identified prior to seeding. Trials were sown using farmers’ broad acre seeding equipment, standard wheat cultivar, rotation and agronomic management.
Stubble Management: Stubble treatments of removed (either blanket burnt or raked and burnt), reduced (through various stubble management approaches such as windrow burning, slashing or mulching) or retained (full stubble retained) were replicated three times on plots 200m in length and 20–40m in width down the paddocks natural slope across 11 trials between 2014 and 2016 (Figure 1, Table 1).
Stubble Rate: Stubble residues were applied to a standing wheat crop in 10–15m2 plots at various rates from 0–8 t/ha. These treatments were replicated three times, across 7 trials over two years on a relatively uniform frost prone part of the landscape (Figure 2, Table 1).
Of these 18 stubble management and stubble rate trials, York (2015, 2016) Cunderdin (2015, 2016) and Corrigin (2016) will be discussed in further detail.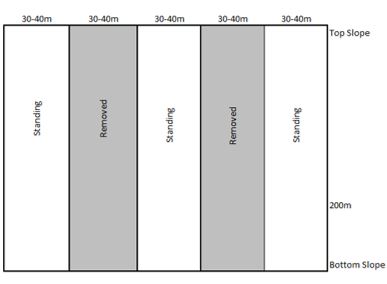
Figure 1: An example of a Stubble Management trial layout
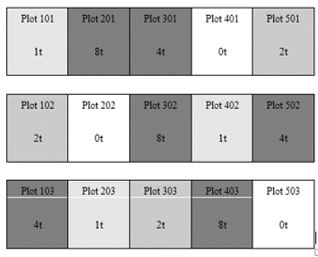
Figure 2: An example of a Stubble Rate trial layout
Table 1: Overview of trials conducted between 2014–2016
|
Trial Result |
Trial year and location |
|---|---|
|
Trials with insufficient frost damage due to site and/or season, where spring frosts did not occur during the vulnerable flowering window, with no significant difference between treatments. |
- 2014 Facey Group Stubble Management Wickepin - 2014 Facey Group Stubble Rate Yealering - 2014 WANTFA Stubble Management Corrigin - 2014 WANTFA Stubble Management Bolgart |
|
Trials with sufficient frost damage but no significant treatment effects due to confounding site spatial variability in microtopography and subsequent frost damage |
- 2014 WANTFA Stubble Rate Cunderdin - 2014 Facey Group Stubble Rate Yealering - 2015 Facey Group Stubble Management Wickepin - 2015 WANTFA Stubble Management Corrigin (Site 1) - 2015 WANTFA Stubble Management Corrigin (Site 2) - 2016 Facey Group Stubble Rate Yealering |
|
Trials with sufficient frost damage, significant temperature and yield effects between treatments. |
- 2014 Living Farm Stubble Management York - 2015 Facey Group Stubble Rate Cuballing - 2015 Living Farm Stubble Management York* - 2016 Consult Ag Stubble Management Meckering - 2016 Living Farm Stubble Rate York* |
|
Trials with too severe frost damage due to site and season with no significant reduction in frost damage between treatments. |
- 2015 WANTFA Stubble Rate Cunderdin* - 2016 Consult Ag Stubble Management Corrigin* - 2016 Facey Group Stubble Management Cuballing |
*Asterisks indicate trials discussed in further detail
Trial measurements
All sites were soil sampled for nutrition prior to sowing to a depth of 10 cm. Data loggers were installed within each plot to measure canopy temperature at a height of 600 mm every 15 minutes from canopy closure to senescence using unshielded Tiny Tag temperature loggers (TGP-4017). In stubble management trials these were placed high and low in the landscape in each plot, while in stubble rate trials they were placed in the middle of each plot. Plant counts were conducted 3 weeks after sowing at three randomly selected locations in each plot to assess crop emergence. From Zadok (Z) 40 (flag leaf sheath extending) onwards, plots were assessed weekly for crop developmental stage. At Z75 (early dough) 30 heads were collected from three locations near temperature sensors for floret induced sterility (FIS) assessments, irrespective of whether frosts occurred previously or not. Biomass cuts were collected at Z89 (hard dough) for harvest index, 1000 grain weight, hectolitre weight and screenings. At maturity, two harvest cuts were taken near temperature sensors using a small plot research header.
In order to conduct the economic analysis, a labour and nutrient removal component were determined for the cost of stubble management. For this exercise, the labour cost of removing stubble (through burning) is estimated to be $2/ha. Reducing stubble loads (by harvesting low and windrow burning, slashing or mulching) is estimated to be $6/ha and retaining stubble is assumed to cost $0/ha. The nutrient removal cost is calculated at 4kg of nitrogen per tonne of wheat stubble (Scott et al. 2010). The following assumptions were also made; nitrogen (in the form of Urea) approximate cost of $500/tonne and APW1 wheat prices of $250/tonne based on average prices across the three years the trials were conducted. It was also assumed removal of stubble was conducted optimally just prior to opening rains to ensure no potassium loss occurred (soil test results at seeding were consistent across treatments).
Results
Response to stubble management
The 18 stubble management trials have been grouped according to the level of frost damage, season and significant results between treatments (Table 1). Across all trial sites, no measurable effect of stubble treatment was evident on crop emergence or total crop maturity biomass. High stubble loads generally flowered 1–2 days later than the removed stubble treatments across all sites. This may be due to slightly lower canopy temperatures delaying phenology. The differences in floret induced sterility attributed to frost, were not due to frost escape, as other genetic work within the National Frost Initiative suggest, flowering date differences between treatments need to be greater than a week for this to happen (Leske et al., 2017).
Treatment effect without frost: In 2014, 4 out of 6 trials experienced very few frost events and therefore had very low levels of floret induced sterility (Table 1). In the absence of frost, the once off seasonal effect of removing or reducing stubble loads had no measurable effect on crop yield, or grain quality (data not presented).Landscape effect:
At some sites and across the three seasons, the position in the landscape affected where the frost damage occurred. In “low” frost years it only occurred lower in the landscape, in “moderate” frost years the damage is seen in the mid-slope position in the landscape, and in “severe” frost years the higher parts of the landscape were affected, as well as the lower landscapes. For example, the stubble management trial in York (2015), experienced ten frost events during flowering between the 14–29th September. There were no differences in severity between stubble treatments (Figure 3) or duration (Figure 4) of frost events. Lower and mid-slope positions in the landscape experienced more severe frost events than high in the landscape (Figure 5). Lower and mid-slope positions also had increased duration of hours the canopy temperature was below 0, -1 and -3°C (Figure 6). Lower parts of the landscape experienced colder and longer frost events.
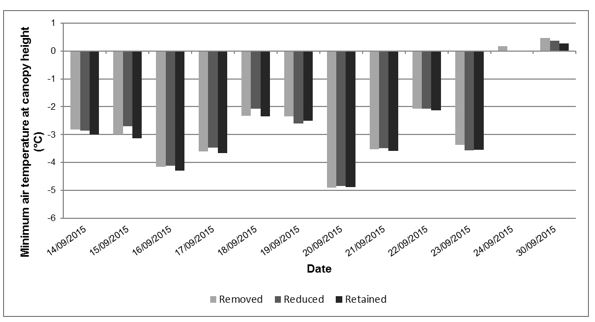
Figure 3: Minimum canopy temperature for frost events by treatment during flowering 2015 in York, recorded on Tiny Tag at 600 mm height. Significance indicated by letters based on unprotected Fisher LSDs (P<0.05) within each frost event.
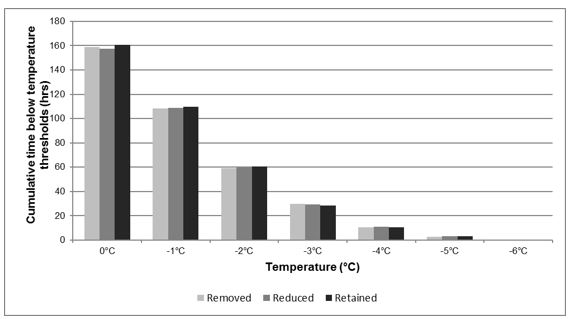
Figure 4: Number of hours below different temperature threshold for frost events by treatment between August and October 2015 in York, recorded on Tiny Tag (TGP-4017) at 600 mm height. Significance indicated by letters based on unprotected Fisher LSDs (P<0.05) within each frost event.
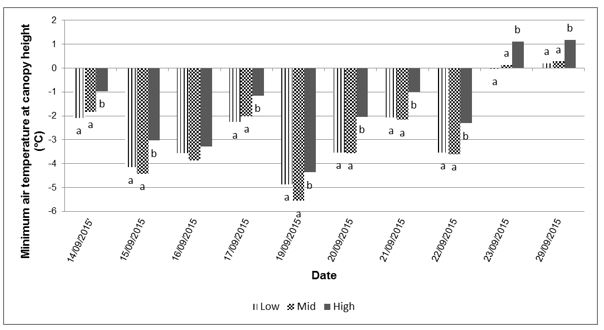
Figure 5: Minimum canopy temperature for frost events by slope during flowering 2015 in York, recorded on Tiny Tag at 600 mm height. Significance indicated by letters based on unprotected Fisher LSDs (P<0.05) within each frost event.
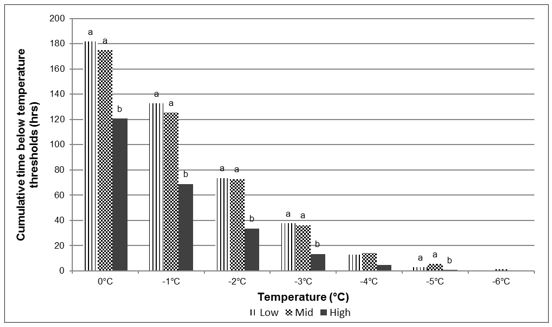
Figure 6: Number of hours below different temperature threshold for frost events across slope between August and October 2015 in York, recorded on Tiny Tag (TGP-4017) at 600 mm height. Significance indicated by letters based on unprotected Fisher LSDs (P<0.05) within each frost event.
Based on the maturity biomass and assuming a harvest index of 0.4 the grain yield at this site was estimated to be 5.3 t/ha, however, the actual final yield ranged between 1.10 and 2.38 t/ha. This was also reflected in low harvest index results of 0.26–0.30. Although temperature data showed no difference between stubble treatments, retained stubble yielded 1.58 t/ha which was significantly lower across the trial than the reduced or removed stubble treatments which yielded 2.10 and 2.05 t/ha respectively (Table 2). Assessments across the slope showed lower and mid-slope positions experienced more frost damage. The mid-slope position was higher than lower in the landscape (Table 3). At this site in 2015, the frost events were of moderate severity (33–65% FIS) and more frost damage occurred lower and mid-slope than higher in the landscape.
Table 2: Yield and grain quality data for Mace wheat at York 2015 by stubble treatment. Significance indicated by letters based on protected Fishers LSDs (P<0.05)
|
Stubble load |
Removed |
Reduced |
Retained |
LSD0.05 |
|---|---|---|---|---|
|
Yield (t/ha) |
2.05a |
2.10a |
1.58b |
0.37 |
|
Yield (t/ha) Map |
2.00 |
1.52 |
1.41 |
1.12 |
|
FIS (%) |
42a |
54b |
49ab |
12 |
|
Maturity Biomass (t/ha) |
1.96 |
1.96 |
2.01 |
0.18 |
|
HI |
0.27 |
0.26 |
0.24 |
0.06 |
|
1000 GW |
23.6 |
24.6 |
24.0 |
5.9 |
|
Screenings (%) <2mm |
5.5 |
5.0 |
5.4 |
1.2 |
Table 3: Yield and grain quality data for Mace wheat at York 2015 by landscape. Significance indicated by letters based on protected Fishers LSDs (P<0.05)
|
Landscape |
Low slope |
Mid slope |
High slope |
LSD0.05 |
|---|---|---|---|---|
|
Yield (t/ha) |
1.84 |
2.01 |
1.88 |
1.51 |
|
Yield (t/ha) Map |
1.82 |
1.76 |
1.35 |
1.16 |
|
FIS (%) |
44b |
63a |
37c |
2 |
|
Maturity Biomass (t/ha) |
2.14a |
1.95ab |
1.84b |
0.20 |
|
HI |
0.26ab |
0.21a |
0.30b |
0.07 |
|
1000 GW |
24.0 |
23.0 |
25.0 |
7.8 |
|
Screenings (%) <2mm |
5.4 |
5.4 |
5.0 |
1.6 |
Response to stubble rates
Throughout the three years of trial work, seven stubble rate trials have shown that increasing stubble rates increase the severity and duration of frost events. For example, the stubble rate trial in York 2016 experienced ten frost events during flowering between the 19–29th of September, with -6.2ºC the lowest temperature recorded. On three occasions, 4 t/ha stubble increased severity and was significantly colder than the 0, 1 or 2 t/ha stubble treatments (Figure 7). In total, there were 53 frost events at this site, and on 33 occasions the 4 t/ha stubble treatment increased frost severity. Across these 53 frost events, 4t t/ha stubble also increased the duration of the frost at 0, -1, -2 and -3ºC (Figure 8). This 2016 temperature data showed, that at York, in a medium to high production environment, decreasing stubble loads to 2 t/ha will reduce the severity and duration of frosts to a level similar to complete stubble removal.Final yields at this site were between 0.23 and 0.82 t/ha, approximately 4t/ha lower than the yield potential. The 0 t/ha stubble treatment yielded 0.82 t/ha, 2 to 3-fold higher than 2 and 4 t/ha stubble treatments at 0.39 and 0.23 t/ha (Table 4). The FIS for all treatments was >96%, demonstrating the severity of the frost damage during the season. Reducing stubble loads in frost prone environments at this site and season reduced frost damage and increase yield in frost prone parts of the landscape.
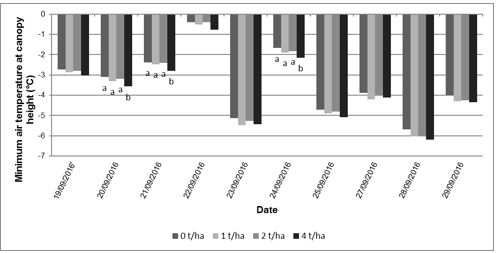
Figure 7: Minimum canopy temperature of frost events during flowering 2016 in York, recorded on Tiny Tag at 600 mm height. Significance indicated by letters based on unprotected Fisher LSDs (P<0.05) within each frost event.
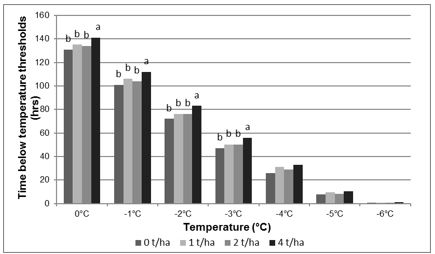
Figure 8: Number of hours below different temperature thresholds for frost events between August and October 2016 in York, recorded on Tiny Tag (TGP-4017) at 600 mm height. Significance indicated by letters based on unprotected Fisher LSDs (P<0.05) within each frost event.
Table 4: Yield and quality for Mace wheat at York in 2016. Significance indicated by letters based on protected Fishers LSDs (P<0.05)
|
Stubble Rate |
0t |
1t |
2t |
4t |
LSD |
|---|---|---|---|---|---|
|
Yield (t/ha) |
0.82a |
0.48ab |
0.39b |
0.23b |
0.46 |
|
FIS (%) |
96 |
97 |
98 |
99 |
3 |
|
Maturity Biomass (t/ha)* |
n.a. |
n.a. |
n.a. |
n.a. |
n.a. |
|
HI* |
n.a. |
n.a. |
n.a. |
n.a. |
n.a. |
|
1000 GW* |
n.a. |
n.a. |
n.a. |
n.a. |
n.a. |
|
Screenings (%) <2mm |
1.01a |
1.08a |
1.18a |
1.82b |
0.41 |
*Not available at time of paper submission
Severe frost events:
In seasons with very severe frosts, reducing stubble did reduce frost severity and duration, but not enough to reduce frost damage. For example, the stubble rate trial in Cunderdin 2015 experienced 8 frost events during flowering between the 30th August–7th September, with -6.2°C the lowest temperature recorded (Figure 9). High stubble rates of 2, 4 and 8 t/ha increased severity and duration compared to the 0 and 1 t/ha stubble treatments (Figure 10).
Based on the maturity biomass and assuming a harvest index of 0.4 the grain yield at this site was estimated to be 2 t/ha, however, the final yield was between 0.2 and 0.3 t/ha. No variation in yield was evident between the treatments (Table 5). The FIS results showed 1 t/ha reduced sterility compared to all other stubble rates, however, sterility across all treatments was >88%. Like the York stubble rate trial discussed above, reducing stubble loads, in this case to below 2.0 t/ha, could reduce the severity and duration of frost events. However, given the season had such severe events and the frost damage was so severe (>90% FIS), reducing stubble had minimal effect on final grain yield.
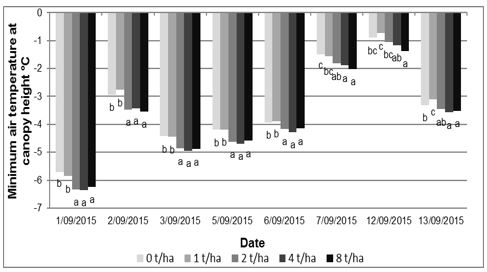
Figure 9: Minimum canopy temperature for frost events during flowering 2015 in Cunderdin, recorded on Tiny Tag at 600 mm height. Significance indicated by letters based on unprotected Fisher LSDs (P<0.05) within each frost event.
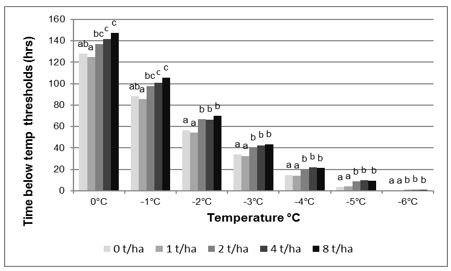
Figure 10: Number of hours below different temperature thresholds for frost events between August and October 2015 in Cunderdin, recorded on Tiny Tag (TGP-4017) at 600 mm height. Significance indicated by letters based on unprotected Fisher LSDs (P<0.05) within each frost event.
Table 5: Yield and quality for Mace wheat at Cunderdin in 2015. Significance indicated by letters based on protected Fishers LSDs (P<0.05)
|
Position |
0t |
1t |
2t |
4t |
8t |
LSD |
|---|---|---|---|---|---|---|
|
Yield (t/ha) |
0.30 |
0.23 |
0.26 |
0.26 |
0.20 |
0.17 |
|
FIS (%) |
94b |
88a |
99c |
98c |
99c |
4 |
|
Maturity Biomass (t/ha) |
4.9 |
5.5 |
4.7 |
5.8 |
5.0 |
1.1 |
|
HI |
0.09a |
0.10a |
0.07b |
0.05b |
0.08b |
0.04 |
|
1000 GW |
28ab |
26a |
32b |
28ab |
29ab |
5 |
|
Screenings (%) <2mm |
8.6 |
11.1 |
7.4 |
7.6 |
6.6 |
7.3 |
Similarly, the stubble management trial at Corrigin in 2016 experienced severe frost damage. The treatments at this site comprised of removed stubble (0 t/ha), retained short stubble (5.8 t/ha) and retained tall stubble (5.8 t/ha). This trial experienced 13 frost events during flowering between the14–29th September, with -6.6°C the lowest temperature recorded (Figure 11). On nine of these events, the retained stubble treatments increased the severity and duration compared to the removed stubble treatment. Similarly, the retained stubble treatment spent longer at each temperature threshold (Figure 12). No significant difference was observed between retaining short or tall stubble.
Based on maturity biomass and assuming a harvest index of 0.4 the estimated grain yield for this site was estimated to be 3 t/ha (maturity biomass to be processed), however frost damage was so severe that all treatments yielded between 0.08–0.2 t/ha, however the removed stubble was still significantly higher yielding than either retained stubble treatment (Table 6). The FIS for all treatments was >84% with the removed stubble treatment showing lower FIS results. However, like with the Cunderdin trial in 2015, given the season had such severe frost events, the removal of stubble had minimal effect on grain yield. In season assessment (22nd September 2016) of FIS indicated treatment effects with removed stubble treatments showing lower FIS than retained stubble treatments (12 to 64%). Subsequent frost events damaged this grain further, reducing grain quality.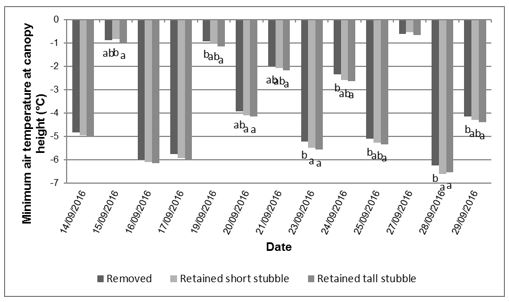
Figure 11: Minimum canopy temperature for frost events during flowering 2016 in Corrigin, recorded on Tiny Tag at 600 mm height. Significance indicated by letters based on unprotected Fisher LSDs (P<0.05) within each frost event.
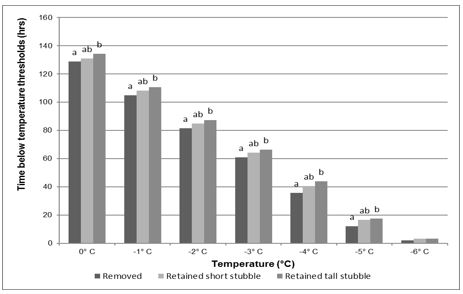
Figure 12: Number of hours below different temperature thresholds for frost events between August and October 2016 in Corrigin, recorded on Tiny Tag (TGP-4017) at 600 mm height. Significance indicated by letters based on unprotected Fisher LSDs (P<0.05) within each frost event.
Table 6: Yield and quality for Mace wheat at Corrigin in 2016. Significance indicated by letters based on protected Fishers LSDs (P<0.05)
|
Position |
Removed |
Retained short stubble |
Retained tall stubble |
LSD |
|---|---|---|---|---|
|
Yield (t/ha) |
0.19b |
0.08a |
0.09ab |
0.10 |
|
FIS (%) |
84a |
99b |
93ab |
9.4 |
|
Maturity Biomass (t/ha)* |
n.a. |
n.a. |
n.a. |
n.a. |
|
HI* |
n.a. |
n.a. |
n.a. |
n.a. |
|
1000 GW* |
n.a. |
n.a. |
n.a. |
n.a. |
|
Screenings (%) <2mm |
4.16a |
6.52b |
4.96ab |
1.64 |
*Not available at time of paper submission
Economic analysis
The sites that experienced moderate frost damage, stubble management reduced severity, duration and damage. An example of this was shown in York 2015 and 2016 where there was between $60 and $200/ha increase in gross margin by reducing stubble to below 2 t/ha (Table 7 and 8). The sites where frost damage was too severe, there was no negative impact of stubble removal on gross margin (Table 9 and 10). Where sites experienced no frost damage, there is an economic cost of removing stubble and this cost is higher in the higher rainfall environments (Table 11).
Table 7: Economic analysis of stubble management trial York 2015.
|
Stubble management |
Removed |
Reduced |
Retained |
|---|---|---|---|
|
Stubble load |
0 |
2.46 |
3.77 |
|
Cost of stubble management ($/ha) |
2 |
6 |
0 |
|
Nitrogen removal (kg) |
15 |
1.3 |
0 |
|
Nitrogen removal cost ($) |
7.50 |
0.65 |
0.00 |
|
Yield (t/ha) |
2.05 |
2.10 |
1.58 |
|
Wheat return ($) |
512 |
525 |
395 |
|
Gross Margin ($/ha) |
503 |
518 |
395 |
Table 8: Economic analysis of stubble rate trial York 2016
|
Stubble load |
0 t/ha |
1 t/ha |
2 t/ha |
4 t/ha |
|---|---|---|---|---|
|
Cost of stubble management ($/ha) |
2 |
6 |
6 |
0 |
|
Nitrogen removal (kg) |
16 |
12 |
8 |
0 |
|
Nitrogen removal cost ($) |
8 |
6 |
4 |
0 |
|
Yield (t/ha) |
0.82 |
0.48 |
0.39 |
0.23 |
|
Wheat return ($) |
205 |
120 |
97 |
57 |
|
Gross Margin ($/ha) |
195 |
108 |
87 |
57 |
Table 9: Economic analysis of stubble rate trial Cunderdin 2015
|
Stubble load |
0 t/ha |
1 t/ha |
2 t/ha |
4 t/ha |
8 t/ha |
|---|---|---|---|---|---|
|
Cost of stubble management ($/ha) |
2 |
6 |
6 |
6 |
0 |
|
Nitrogen removal (kg) |
32 |
28 |
24 |
16 |
0 |
|
Nitrogen removal cost ($) |
16 |
14 |
12 |
8 |
0 |
|
Yield (t/ha) |
0.30 |
0.23 |
0.26 |
0.26 |
0.20 |
|
Wheat return ($) |
75 |
57 |
65 |
65 |
50 |
|
Gross Margin ($/ha) |
57 |
37 |
47 |
51 |
50 |
Table 10: Economic analysis of stubble management trial Corrigin 2016
|
Treatment |
Removed |
Retained short stubble |
Retained tall stubble |
|---|---|---|---|
|
Stubble load (t/ha) |
0.0 |
5.75 |
5.80 |
|
Cost of stubble management ($/ha) |
2 |
6 |
0 |
|
Nitrogen removal (kg) |
23 |
0.2 |
0 |
|
Nitrogen removal cost ($) |
11.5 |
0 |
0 |
|
Yield (t/ha) |
0.19 |
0.08 |
0.09 |
|
Wheat return ($) |
47 |
20 |
23 |
|
Gross Margin ($/ha) |
34 |
14 |
23 |
Table 11: Economic cost of stubble management in the Low, Medium and High rainfall zones
|
Rainfall Zone |
Low |
Medium |
High |
||||||
|---|---|---|---|---|---|---|---|---|---|
|
Treatment |
Removed |
Reduced |
Retained |
Removed |
Reduced |
Retained |
Removed |
Reduced |
Retained |
|
Reduced stubble load (t/ha |
0 |
1.5 |
3 |
0 |
2.5 |
5 |
0 |
3.5 |
7 |
|
Cost of stubble management ($/ha) |
2 |
6 |
0 |
2 |
6 |
0 |
2 |
6 |
0 |
|
Nitrogen removal (kg) |
12 |
6 |
0 |
20 |
10 |
0 |
28 |
14 |
0 |
|
Nitrogen removal cost ($) |
6 |
3 |
0 |
10 |
5 |
0 |
14 |
7 |
0 |
Conclusion
Trials conducted over three years identified four key learnings associated with frost damage and stubble management; the effect of stubble management with and without frost, the effect of stubble management in various parts of the landscape, stubble rate response with and without frost and effects under severe frosts. Temperature variations, frost damage and yield were influenced more by position in the landscape than the implementation of stubble management practices. When stubble management practices were implemented in moderate frost environments, higher stubble rates showed an increase in the severity and duration of frost events, resulting in more frost damage and decreased yield. Seasons with minimal frost damage, a one-off stubble reduction did not reduce yield or quality, conversely in seasons with multiple, severe frost events, stubble reduction also did not increase yield. Stubble height had no effect on temperature, frost damage or final yield when total stubble biomass remained the same. Reducing stubble had no negative impact on gross margin in frost free seasons or severe frost seasons, but could improve gross margins in moderate frost seasons. Breakeven point is likely to change across the landscape from year to year depending on the severity of the season. Stubble management can be used as a tool as part of a comprehensive frost management plan (GRDC, Frost Management Tips and Tactics).
Acknowledgments
GRDC National Frost Initiative for funding of the project. Peter Hansen, The weatherlogger for installation, maintenance and data acquisition of onsite weather stations. Steve Curtin, Geoff Fosbery and Brad Joyce from Consult Ag, Sheree Bletchynden, Georgia Oliver and Chloe Turner from Facey Group, Cecelia Duplesses from DAFWA Merredin/MADFIG and Sally Major from FBG for conducting and managing trials throughout the project. All growers who hosted and assisted with the implementation and management of the trials throughout the year and project.
References
Leske et al., 2017. Optimising sowing time in frost prone environments is key to unlocking the yield potential of wheat. GRDC Crop updates 2017.
Scott et al., 2010. Stubble Retention in Cropping Systems in Southern Australia: Benefits and Challenges. Charles Sturt University https://www.csu.edu.au/__data/assets/pdf_file/0007/922723/stubble-retention.pdf
Paper reviewed by: Glen McDonald, Sue Knights
GRDC Project Code: DAW00241,
Was this page helpful?
YOUR FEEDBACK