Understanding biological farming inputs
Take home messages
- This project has investigated the chemical variability and performance (pot and field) across a range of biological amendment classes (biostimulants, humates, organic amendments, alternative fertilisers).
- It is difficult to make generalisations or predictions as to potential performance of biological amendments due to wide variability in chemical composition between and within classes (based on assessment of greater than 80 amendments).
- No single amendment or amendment class consistently performed better than district practice fertiliser treatments across eight field trials established in 2015. Results from 2016 will provide an opportunity to assess cumulative effects under a more favourable rainfall season.
- On-farm testing of amendments across a decile range is required in order to understand which amendments have more potential in supporting productivity under variable environments and associated stresses.
Background
Biological inputs include a wide range of products aimed at supporting soil fertility, biological activity, and plant growth. They include microbial inocula (such as rhizobia), biostimulants that promote favourable microbial populations and plant growth, composts and compost teas, manures, and biochars. These inputs are often used with the broad aim of reducing the use of traditional chemical fertilisers and agro-chemicals, but they may also form the backbone of organic farming systems.
As pressures rise on the farming community to maintain or increase outputs to feed a rising global population, while also reducing their impact on the land and wider environment, and potentially dealing with an increasingly uncertain climate, growers continue to seek innovation to help maintain and potentially grow their businesses. Many biological inputs are marketed as an innovative way to extract more output from the farm while reducing impact, particularly on soil health, either as a substitution for, or in addition to conventional fertiliser or pest control inputs. In 2013 and 2014, soil ‘enhancers’, including composts, manures and biochars were applied to 3.4m ha (ABS, 2015).
Project aims
The aims of this project include:
- Collating existing knowledge on the success of biological inputs across a wide range of agricultural settings and identifying knowledge gaps for the Australian broadacre grains industry.
- Capturing and quantifying the chemical variability in a wide range of biological inputs available to growers in Australia.
- Screening a wide range of these inputs through a glasshouse experiment under drought stress to establish whether any groups of amendments provide particular improvements in such an environment.
- Probing mechanisms and modes of action of some biological inputs through laboratory and glasshouse experiments to gain a better understanding of how they might improve the soil processes involved in nutrient delivery.
- Testing a range of biological inputs across eight field sites in five states to quantify in-field performance relative to district practice conventional fertiliser treatments.
- Producing a practical guide to aid the design of on-farm tests of biological inputs by growers.
This paper reports results from three stages of this work: 1) amendment characterisation, 2) pot-scale screening, and 3) results from the first year of field experiments.
Method
Three components of the research conducted within the wider scope of the project are presented here. These form the backbone of the work carried out. Other targeted experiments with the aim to better quantify mechanisms and modes of action of amendments are also underway, as is an extensive review and practical guide for on-farm testing of biological inputs.
Biological input characterisation
More than 80 biological inputs were sourced from a variety of suppliers across Australia. These include: 1) a range of traditional organic amendments such as composts and manures, as well as some innovative compost blends, 2) microbial inocula, 3) solid, soluble, and liquid humates and humic substances, 4) liquid biostimulants (defined as having a plant stimulatory input above and beyond their direct nutrient input, but with main mode of action other than through the input of a viable microbial component), and 5) alternative fertilisers marketed as being ‘less harsh’ on the soil microbial community than conventional fertilisers.
Chemical analyses were carried out on these products including pH, electrical conductivity (an index of salinity) and nutrient content. In addition, high-end spectral techniques (nuclear magnetic resonance (NMR)) were used on appropriate inputs to better understand the chemistry of the organic matter contained within them.
Pot-scale screening experiment
This was a large experiment involving 60 treatments and totalling 240 individual pots. Wheat (Trojan) was sown in 2.7L pots, with 3kg (wet weight) soil, maintained at 30% water holding capacity (equivalent to 2.47kg dry weight). The soil was a Chromosol, sourced from a paddock near Freeling, SA. Four seeds were sown in the pot, together with an application of amendment at either the manufacturer’s specified rate, or, where none was given, a rate drawn from literature and application rates of similar amendments. The treatments were either applied in the seedbed with the seed, or surface applied, depending upon manufacturer directions. Where no directions were given, application was as per similar treatments.
No fertiliser treatment was added to any of the biological treatments, given the relatively high fertility of the soil used in this study. This is because it was taken from the more fertile 0-10 cm surface layer, and the disturbance involved in its handling, homogenisation and manipulation of the soil would likely release bound nutrients in the soil akin to a tillage event. Control treatments included a zero-fertiliser control and diammonium phosphate (DAP) at rates of 50, 100, 150 and 200kg/ha. District practice for this area and soil type is 100kg DAP/ha (G. Butler, pers comm). Seedlings were thinned to two per pot at the three-leaf stage and the remaining seedlings were grown to maturity before harvest at 118 days after seeding.
The rationale for the 30% water holding capacity moisture regime was because pot experiments cannot easily be maintained with simulated growing season rainfall. Consequently, decisions made for drought treatments were drawn from previous studies (Farooq et al., 2013; S. R. Singh and H. P. Singh, 2006). Selecting a drought treatment meant that the plants were likely to be under moderate water stress and as a result, treatment effects from amendments were expected to be more apparent.
The pot experiment was established in late February 2015 and was harvested in June. At harvest, above- and below-ground plant parts were separated, with above-ground material dried at 60°C for 72 hours before being separated into leaves, stems and heads. The grain was then manually threshed and its dry weight recorded. Roots were manually washed free of soil before also being dried at 60°C for 72 hours. Total biomass, grain, above- and below-ground biomass weights were recorded.
Plot-scale field experiments
Site locations and background
Eight field experiments were established for two consecutive growing seasons across the three GRDC grain growing regions. The field sites were situated on a diverse range of soils in order to gain greater understanding of the specificity or broader applicability of individual amendments. Site details are provided in Table 1. Due to the bushfire in this region in late November2015, no yield results were obtained for the Freeling experiment. While the remaining seven sites were re-sown and had their treatments re-applied for the 2016 growing season (except Paskeville, where the plots were relocated to another location in the same paddock), the Freeling site was replaced with one in the Jamestown area of SA to provide a better contrast to the Paskeville site.
Region | State | Nearest town | Soil type | Soil pH | MAP | GSR |
|---|---|---|---|---|---|---|
W | WA | Dalwallinu | Tenosol | Acid | 325 | 250 |
S | SA | Paskeville | Calcarosol | Calcareous | 381 | 317 |
S | SA | Freeling* | Chromosol | Neutral | 483 | 394 |
S | SA | Langhorne Creek | Kandosol | Neutral | 369 | 296 |
S | VIC | Inverleigh | Dermosol | Acid | 552 | 380 |
N | NSW | Rankins Springs | Kandosol | Calcareous | 400 | 220 |
N | NSW | Parkes | Vertosol | Neutral | 589 | 388 |
N | QLD | Mt Tyson | Vertosol | Calcareous | 650 | 210 |
*The Freeling site was lost in the Pinery bushfire in 2015 and no harvest was possible. The Freeling trial was relocated to Jamestown for 2016.
Field trial method
Each field site had 88 plots, approximately 2m × 12m in size, and was established, maintained and harvested by grower groups. Plots consisted of 22 treatments replicated four times in a randomised complete block design to allow for environmental and soil variability. Of these 22 treatments, eight consisted of conventional treatments based upon district practice. These control treatments allowed for yield-response curves to be generated and thus provided a more accurate comparison of the results from a biological amendment with those from conventional inputs.
The remaining 14 treatments consisted of biological inputs. These were chosen on the basis of grower group input, guided by laboratory and glasshouse derived data from the present project. Several commonly available products were included to be tested at all sites. Each biological input was applied at the supplier’s recommended rate and was applied on top of a ‘base’ conventional fertiliser representing 50% of local district practice. Treatments were applied according suppliers’ instructions, being banded, surface spread, or liquid injected as appropriate and where possible with local field machinery. All organic amendments were applied at a rate of 3t/ha, reflective of a compromise in application rates across all the local regions covered.
Measurements: Grain yields were measures at harvest in-field. Nitrogen (N) concentration was measured on a subsample of grain from each plot by Leco dry combustion analysis. Soil samples were taken from each plot six to eight weeks after trial establishment in the first year and a basic analysis was performed (water soluble nutrients). In the second year (data not yet available), a more thorough chemical analysis including assessments of microbial biomass size, exchangeable organic and inorganic N, and extractable phosphorus (P) was conducted. Treatments identified of particular interest will be subject to an in-depth microbial analysis to ascertain whether the inputs have altered microbial community structure and function in relation to soil chemistry and eventual crop yield.
Results and discussion
Biological input characterisation
The chemistries of the biological inputs vary both between and within types (Figure 1). The alternative fertilisers generally had the lowest carbon (C) concentrations (average 116mg C/g), similar to the microbials (average 89mg C/g), though this average is driven by one particularly high value of 252mg C/g. Composts and manures tend to have a similar C concentration (averages: composts 257mg C/g, manures 272mg C/g) relative to the higher C concentration of the humates (366 mg C/g), although N concentration is typically higher in the manures and composts (23 and 17mg N/g) relative to the humates (11mg N/g). The biosolid and biochar samples used in this project appear as outliers relative to the main dataset, with particularly high N or C concentrations, respectively.
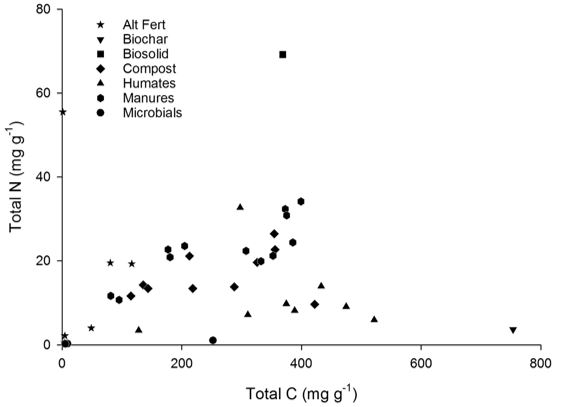
Figure 1. Carbon and nitrogen concentrations of a selection of biological inputs investigated.
Solid state NMR spectroscopy was used, consistent with work carried out in the national Soil Carbon Research Program (SCaRP) and other national projects (Baldock et al., 2013) to investigate organic matter chemistry of the biological inputs collected as part of this project. A preliminary plot of this data is presented in Figure 2 to highlight differences and similarities in the 37 biological inputs analysed to date. Markers that are close together indicate similarity in organic matter chemistry, whereas those that are separated by greater distance exhibit less similarity.
There are three main drivers of the distribution of samples in the principal components analysis (PCA): aryl-C, alkyl-C, and o-alkyl-C (Figure 2). In particular, the humates and alternative fertilisers follow a gradient of increasing aryl-C content, indicating that differences in aromatic C content separate these inputs from one another. Composts and manures (and to a lesser extent humates) also separate out along the alkyl:o-alkyl continuum. This is a traditional measure of the extent of microbial degradation and processing imparted on organic matter (Baldock and Preston, 1995).
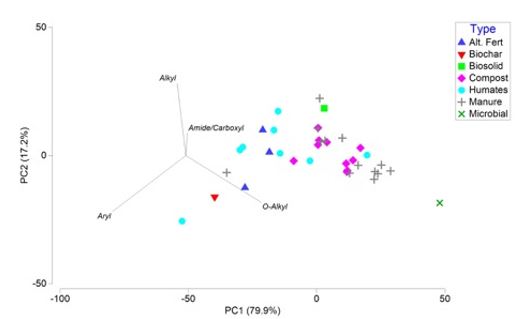
Figure 2. Principal components analysis of NMR data. The closer the data points, the more similar the samples.
The wide variabilities in relative nutrient:organic matter concentrations (here shown as C versus N, Figure 1) and also in the organic matter chemistry as quantified by NMR (Figure 2) within each category of the biological inputs analysed demonstrate the difficulty of predicting the chemistry of an individual product from its classification alone. For the (mainly) solid amendments analysed here, this would tend to indicate that the resultant performance of a product could be difficult to predict. This is especially pertinent in the context of interactions between different soil types and the different constraints they impose on crop production and the input type in question.
Screening pot experiment
The range of conventional DAP fertiliser applications resulted in a typical fertiliser response curve for grain yield (Figure 3), whereby particularly high fertiliser additions (200% of district practice) caused a noticeable drop in yield. Yield at district practice (100kg/ha DAP) was 0.735 ± 0.063g/stem, while yield from the zero fertiliser control treatment was lower (0.589 ± 0.095g/stem). There was much variability within the seven biological input classes tested, with the mean for most input classes falling slightly above the yield from the zero DAP control. Investigating the individual treatments within each product indicates that no single treatment fell well above the limits of what was achieved by conventional fertiliser addition to some level. While there is between-treatment variation within each product category, results indicate that some individual products within the categories of alternative fertilisers, humates, composts, and manures did perform at a level similar to that achieved with conventional fertiliser additions, though the data are highly variable.
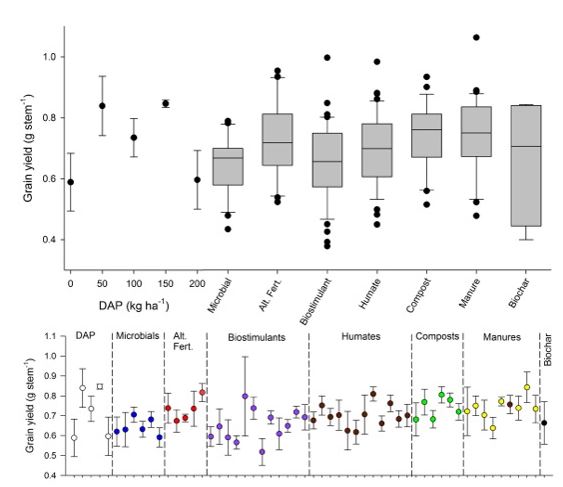
Figure 3. Grain yield (g/stem) in the screening pot experiment. The top panel shows the five conventional fertiliser applications ± standard error of the mean (SEM), and box-whisker plots show the variation of yield across all product types within each given category. The bottom panel shows grain yield response for each product within the categories ± SEM.
In contrast to the grain yield data, quite striking increases in total plant biomass were observed with the addition of DAP at all rates, ranging from 1.62 ± 0.12g/stem in the zero control to 2.85 ± 0.21g/stem in the 200kg/ha DAP treatment (data not shown). As with grain yield, total biomass results were variable within biological input classes, and tended to centre between the zero control and lowest conventional fertiliser treatment (50kg/ha DAP). In a water-constrained growing environment such as that simulated by the watering regime used in the present experiment and potentially typical of much of the Australian dryland grain systems, water losses through evapo-transpiration are also important. In the conventional fertiliser treatments, water use increased significantly where DAP was applied. This closely follows total biomass production and is largely due to increased transpiration from the larger plants that grew with greater nutrient availability. When considering the input classes as a whole, water use generally fell between the zero control and the 50kg/ha DAP treatment.
Though grain yield data from a pot experiment are unlikely to be fully representative of those that might be observed in a field situation, the purpose of this experiment was to screen a large number of biological inputs under standardised conditions. By inducing drought-like conditions and eliminating conventional fertiliser inputs, stresses were imparted on the wheat plants to provide opportunity for the biological inputs to have an effect. In line with the chemistry data presented in the characterisation (though noting that not all amendments analysed in the data presented here are present in both sections), wide variability was observed within the categories examined. As with the findings from the characterisation data, these data again make it apparent that recommendations for the use of certain classes of biological inputs are likely to be difficult to make and that specific product and situation testing should be conducted.
Field experiments
Of the eight field experiments established in 2015 in WA, SA, VIC, NSW and QLD, seven were harvested and one (Freeling, SA) was lost due to a fire in November 2015. Data and grain samples are still being collected and processed from the 2016 trials and thus only the 2015 data are discussed here.
Growing conditions varied across the country, with some sites having significant in-season rainfall (290mm at Parkes), or being able to draw on good pre-season soil moisture (237mm at Langhorne Creek, 332mm at Mt Tyson). Other sites such as Paskeville had very little pre-season or growing season rainfall (108 and 175mm, respectively) and thus yields were markedly lower. Average yields of grain across all plots ranged from 1.2t/ha at Paskeville to 4.8t/ha at Rankins Springs. Grain N concentration ranged from an average of 1.74% at Buntine to 2.30% at Paskeville, with the highest yielding site, Rankins Springs also producing grain with a high N content (average 2.29% across all plots). Assuming a conversion factor of 6.25, protein levels therefore ranged from 10.9% to 15.0%, indicating a wide range of grain quality. Unlike the yield data, there were occasionally striking differences between individual biological inputs where grain N concentration was elevated relative to other inputs in the same category, though these were very site and amendment specific. In the majority of these cases (an organic amendment in the Parkes trial in NSW being the only exception), increases from the biological input treatments did not exceed those obtainable using conventional fertiliser at increased rates relative to the 50% district practice control treatment.
When considering only the biological input treatments and investigating relationships between yield and N concentration (Figure 4), clear clustering is seen for most of the sites, highlighting the importance of local soil and climate factors. Within each of the sites, statistically significant negative relationships between grain yield and N concentration were observed for all but the two NSW sites. However, though strongly statistically significant (P=0.0034 for the least statistically significant relationship), even in the best relationship between the two variables observed at the Inverleigh trial in VIC, only 25% of the variability in grain N could be explained by the yield (P<0.0001). So, while there is clearly some dilution penalty in N concentration and thus protein with increased yield at most of these sites, yield alone had limited explanatory power for N concentration.
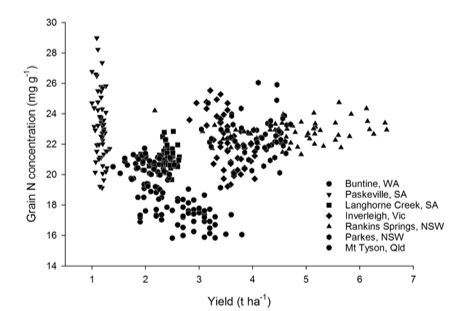
Figure 4. Yield versus grain N concentration for the biological treatments across the seven harvested sites in 2015.
Due to the large amount of data generated across all seven harvested sites, it is beyond the scope of this paper to present it all here. Across all seven harvested sites, there was high variability within each treatment and very few treatments approached a significantly different threshold to the 50% district practice control. Those that did were mostly organic inputs and these were applied at a much higher rate relative to the other input types. However, this 3t/ha was broadly reflective of an average application across the seven local regions where trials were located.
Given that the Inverleigh site demonstrated the strongest relationship between yield and N concentration (Figure 4), the data from this site are presented here (Figure 5). A typical fertiliser response curve was observed, increasing from 3.29t/ha in the zero-control to 3.75t/ha at the 125% district practice level (100kg/ha monoammonium phosphate (MAP)), before curving down slightly at the higher conventional fertiliser application rates. There was variation within all five classes of biological inputs tested, with the largest differences being seen within the organic amendment classes (3.85t/ha for organic A, 3.41t/ha for organic D).
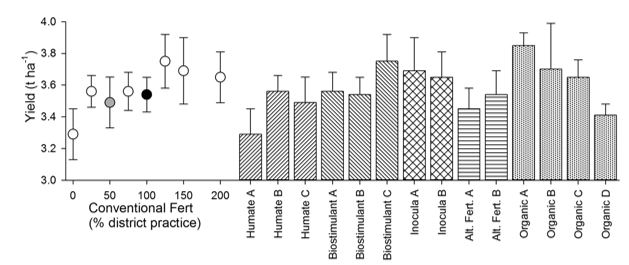
Figure 5. Grain yield for the field experiment at Inverleigh, VIC in 2015. Values are means (n=4) +/- SE. The fertiliser response curve (dots) ranges from 0 to 200% district practice (where 100% district practice was 80kg/ha MAP). The grey dot is the response to 50% district practice that underlies all the biological input treatments and is thus the true control. The black dot is 100% district practice. Note the expanded Y-axis to enable patterns between treatments to be more easily compared.
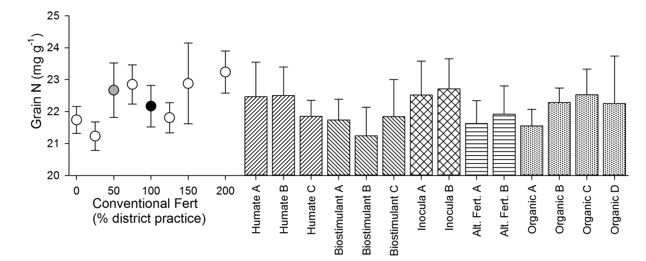
Figure 6. Grain N concentration for the field experiment at Inverleigh, VIC in 2015. Values are means (n=4) +/- SE. The fertiliser response curve (dots) ranges from 0 to 200% district practice (where 100% district practice was 80kg/ha MAP). The grey dot is the response to 50% district practice that underlies all the biological input treatments and is thus the true control. The black dot is 100% district practice. Note the expanded Y-axis to enable patterns between treatments to be more easily compared.
As with the yield data, only the grain N concentration data for the Inverleigh site is presented here (Figure 6). The Inverleigh field experiment showed a general trend of increasing grain N concentration with increasing conventional fertiliser application (Figure 6), mirroring the same trends seen for grain yield. Within-treatment variation was high for all treatments (conventional and biological) at this site, with little response of grain N to any of the treatments tested.
Given the high within-treatment variation even across the four replicates from trials placed on relatively uniform portions of paddocks, it is difficult to draw firm conclusions from this first year of field trial data. Over the seven harvested trials, five showed statistically significant yet relatively weak relationships between yield and grain N concentration with the eight conventional fertiliser treatments excluded from the analysis, indicating some level of protein dilution as a result of increased yield. The two trials that showed no relationship between yield and grain N were both in NSW and were both high-yielding relative to the other five trials. While this indicates that at these two sites higher yields from individual plots did not affect yield quality, the lack of systematic differences between treatments shows that it is unlikely that the biological inputs were the main factors driving yield differences in this first year’s data.
Conclusion
The data presented here highlight the wide variability in the chemistry of biological inputs, but also the limited responses of wheat to suppliers’ recommended rates of addition of these inputs in both glasshouse and field studies. The absence of consistent results for any one class of amendments makes the recommendation for certain situations based upon their type difficult from a basic chemical perspective. Instead, growers should consider the constraints they are aware of that are known to affect crop performance in their specific soil/climate situation before electing to integrate a product into a specific farming system. On-farm testing using replicated strip trials should be conducted to assess the efficacy and potential economic returns of a product (Farrell et al., in prep).
While such an on-farm testing approach would allow growers to investigate whether short term benefits are found from the use of an amendment, this approach would not provide any insight on whether more subtle results might be observed over the longer term through potential soil-based mechanisms that may only occur over a number of years. It is unfortunately very difficult to assess such longer term effects without long term experiments. Although some more labile inputs such as some of the biostimulants may only be expected to have shorter term impacts on crop performance, inputs that aim to alter soil properties, such as organic matter content or more permanent changes in microbial community composition, may take several years to show significant results. Within growing season variation, such as rainfall and number of biologically active days, will also alter the response of crops to biological inputs, and thus response will vary between years, especially if different crop stressors exist as a result of changes in, for example, water availability.
References
ABS, 2015. Land Management and Farming in Australia, 2013-14 [WWW Document]. Australian Bureau of Statistics. URL (accessed 2.23.16).
Baldock, J.A., Preston, C.M., 1995. Chemistry of carbon decomposition processes in forests as revealed by solid-state carbon-13 NMR, in: McFee, W.W., Kelly, J.M. (Eds.), Carbon Forms and Functions in Forest Soils. Soil Science Society of America, Madison, WI, pp. 89–117.
Baldock, J.A., Sanderman, J., Macdonald, L.M., Puccini, A., Hawke, B., Szarvas, S., McGowan, J., 2013. Quantifying the allocation of soil organic carbon to biologically significant fractions. Soil Research 51, 561–576. doi:10.1071/SR12374
Farooq, M., Irfan, M., Aziz, T., Ahmad, I., Cheema, S.A., 2013. Seed Priming with Ascorbic Acid Improves Drought Resistance of Wheat. Journal of Agronomy and Crop Science 199, 12–22. doi:10.1111/j.1439-037X.2012.00521.x
Farrell, M., Webb, M.J., Wong, M., Abbott, L., Macdonald, L.M. (in prep) Biological Farming Inputs – A practical guide to on-farm testing. On line, availalable from www.soilquality.org.au.
Singh, S.R., Singh, H.P., 2006. Effect of AM fungi and moisture levels on root colonization, plant growth and nutrient uptake of wheat. Environment and Ecology 24S, 776–780.
Acknowledgements
The research undertaken as part of this project is made possible by the significant contributions of growers through both trial cooperation and the support of the GRDC — the author would like to thank them for their continued support. Technical assistance in the field from the associated grower groups (The Liebe Group, SANTFA, SFS, AgGrow Agronomy and NGA) and in the laboratory (Thomas Carter, CSIRO, Steven Szarvas, CSIRO; Ian Waite, UWA) is also acknowledged.
Contact details
Mark Farrell, CSIRO Agriculture & Food, PMB2, Glen Osmond, SA 5064
08 8303 8664
mark.farrell@csiro.au
GRDC Project Code: CSO00044,
Was this page helpful?
YOUR FEEDBACK