Groundcover and stubble type impact on fallow efficiency
Author: Brendan Burton, Northern Grower Alliance | Date: 07 Mar 2017
Take home message
The impetus for this trial work came following three consecutive dry seasons from 2013-2015 where little to no winter crop was planted in the Walgett district. Growers and consultants wanted proof of concept that going beyond current no-till farming practices to increase the percentage groundcover can improve fallow efficiency and safe guard soil moisture against evaporative losses.
Current soil water models show upper most limit at 100% groundcover. NGA set out to determine how much additional soil water could be accumulated by going beyond 100% groundcover, by applying additional straw to the system and hence increasing the thickness layer of straw on the soil surface.
Small plot trials initiated by NGA in both 2014 and 2015 indicated that the addition of extra ground cover can increase the depth of accumulated soil water by up to 50-60cm when compared to standard standing stubble, with reduced evaporation losses considered the most likely cause.
While stubble load is important for accumulating soil water, the type of stubble appears to have a major impact on fallow efficiency. Results from a trial site at Macalister demonstrated that barley stubble had double the fallow efficiency compared to faba bean stubble given the same length of fallow period and rainfall.
Background
Following two consecutive years of drought during 2013 and 2014, with little to no winter crop planted in the western districts of northern NSW, growers and consultants from the Walgett area made maximising soil water accumulation their top priority during the NGA’s local research group meetings. Consequently, two small plot trials were established in 2014 to begin looking at the effect of applying additional groundcover to the current standing stubble in an attempt to quantify how much additional soil water could be gained by applying additional groundcover in the form of baled straw.
In addition to the small plot stubble cover trials, there was interest from the Liverpool Plains Local Research Group in comparing the fallow efficiency of different stubble types. Consultants believed that stubble type had a major impact on how quickly the soil moisture profile could be refilled after harvest. Consequently, NGA evaluated a range of different stubble types following harvest to determine their fallow efficiency.
2014 small plot trials
Two trials were established in 2014. Both trials had the same six treatments with four replicates. Each treatment plot was 2m x 2m in size with a 2m x 2m buffer area between each treatment plot. Chicken wire was used to hold additional straw in place during the trial period.
Table 1. 2014 small plot trials
|
Trt |
Product |
Bullarah |
Walgett |
||
|
% Groundcover |
Mulch layer thickness (cm) |
% Groundcover |
Mulch layer thickness (cm) |
||
|
1 |
UTC. Standing stubble. |
33
4.4t DM/ha
|
0 |
31
4.6t DM/ha
|
0 |
|
2 |
Bare ground. Stubble removed |
7 |
0 |
7 |
0 |
|
3 |
Additional 5t/ha straw added to existing stubble |
94 |
1 |
88 |
1 |
|
4 |
Additional 10t/ha straw added to existing stubble |
99 |
3 |
98 |
2 |
|
5 |
Additional 20t/ha straw added to existing stubble |
100 |
9 |
100 |
4 |
|
6 |
Additional 40t/ha straw added to existing stubble |
100 |
11 |
100 |
5 |
One of the trial sites was setup at Bullarah on the 13th January 2014, where the paddock had already been fallowed for a period of 14 months, following wheat in 2012. Initial gravimetric soil samples (to 120cm depth) were taken at trial initiation to ensure soil moisture across the trial site was uniform. Starting soil water was calculated as 11mm of plant available water (PAW). Final gravimetric soil samples were taken in May 2015, approx. 16 months after trial initiation. Total rainfall received during this period was 551mm.
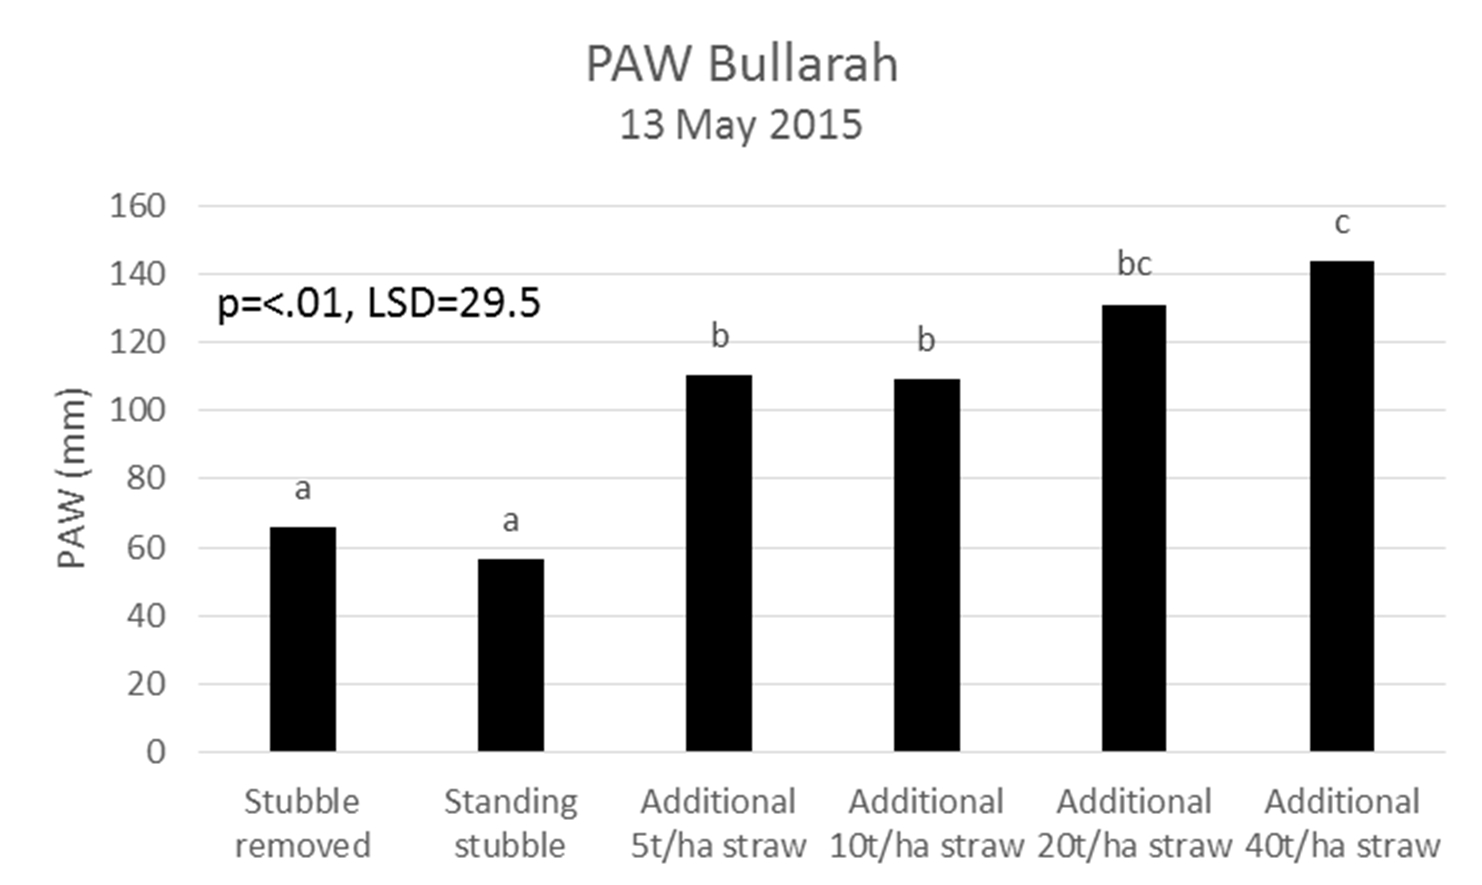
Figure 1. An additional 53mm of PAW was stored where 5t/ha of straw was applied compared to standing stubble alone. Additional 40t/ha straw resulted in extra 87mm PAW compared to the standard standing stubble. Based on water use efficiency (WUE) (wheat) of 15kg/mm/ha, an extra 87mm of PAW could result in an additional 1.3t/ha of grain.
The second site was setup up on the 15th January 2014, 5km east of Walgett, and similarly was fallowed for a period of 14 months from wheat in 2012. Initial gravimetric soil samples were taken to confirm soil moisture uniformity across the trial site. Final gravimetric soil samples were taken in January 2016 with a total rainfall of 640mm received during the trial period. Interestingly, only six significant rainfall events (>25mm within 24hr) occurred during the two year trial period.
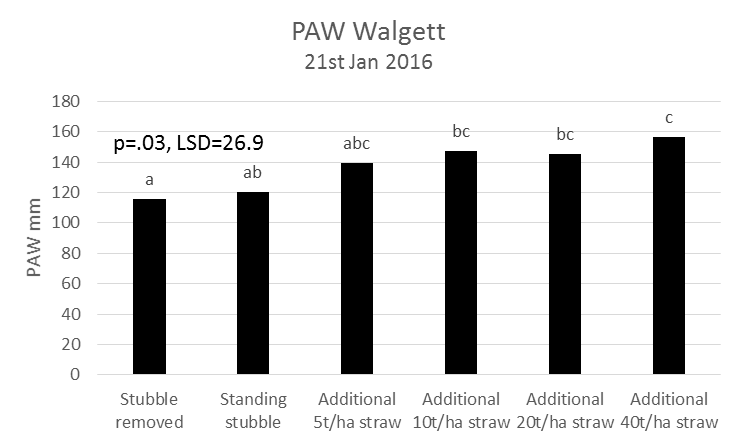
Figure 2. An extra 19mm of PAW accumulated where additional 5t/ha straw added, compared to the standing stubble. Where 40t/ha straw was applied, an extra 37mm of PAW stored compared to standing stubble. Based on WUE for wheat this could equate to an extra 550kg/ha of grain.
2015 small plot trials
An additional two small plot trials were established in 2015 following the promising initial results. The 2015 trials had eight treatments in total by four replicates. Each treatment plot was 2m x 2m in size with a 2m x 2m buffer area between each treatment plot. Sheets of galvanised mesh were placed on top of those plots where additional straw was added to keep the mulch layer in place during the trial period.
Table 2. 2015 small plot trials
|
Trt |
Product |
Bullarah |
Mungindi |
||
|
% Groundcover |
Mulch layer thickness (cm) |
% Groundcover |
Mulch layer thickness (cm) |
||
|
1 |
Stubble removed, surface left rough/cracked |
9
5.4t DM/ha
|
0 |
8
3.1t DM/ha
|
0 |
|
2 |
Stubble removed, surface raked level & smooth |
5 |
0 |
3 |
0 |
|
3 |
Standing stubble, stubble cut to 50% height |
28 |
0 |
24 |
0 |
|
4 |
UTC. Standing stubble |
34 |
0 |
37 |
0 |
|
5 |
Additional 5t/ha straw added to existing stubble |
89 |
0.5 |
97 |
3 |
|
6 |
Additional 10t/ha straw added to existing stubble |
100 |
1 |
100 |
5 |
|
7 |
Additional 20t/ha straw added to existing stubble |
100 |
3 |
100 |
11 |
|
8 |
Additional 40t/ha straw added to existing stubble |
100 |
5 |
100 |
18 |
One of the 2015 trials was established on the same property from the previous year at Bullarah, but in a different paddock on the 9th Nov 2015, some two weeks after the wheat harvest on the 25th Oct 2015. Initial gravimetric soil water samples were taken to confirm soil water uniformity across the trial site. Stubble height was ~25-30cm.
Total rainfall of ~550mm was received during the trial period from Nov 2015 until the 27th Oct 2016. There was no significant treatment affect at this site. The site received 42mm of rainfall during the fortnight between harvest and trial initiation. Capacitance probe results, following an early January rainfall of ~100mm, indicated that soil moisture had reached a depth of >40cm in both the standing stubble and 40t/ha straw treatments. There were no differences observed between treatments in subsequent assessments using moisture probes, EM38 or in final gravimetric soil water.
The second 2015 site was setup up on the 10th Nov 2015 approx. 30km north west of Mungindi, and similar to Bullarah had recently been harvested. Initial gravimetric soil water samples were taken to confirm trial site uniformity. Stubble height was recorded at 30-35cm. A total of 544mm of rainfall was received during the trial period from the 10th Nov 105 until the 11th Oct 2016.
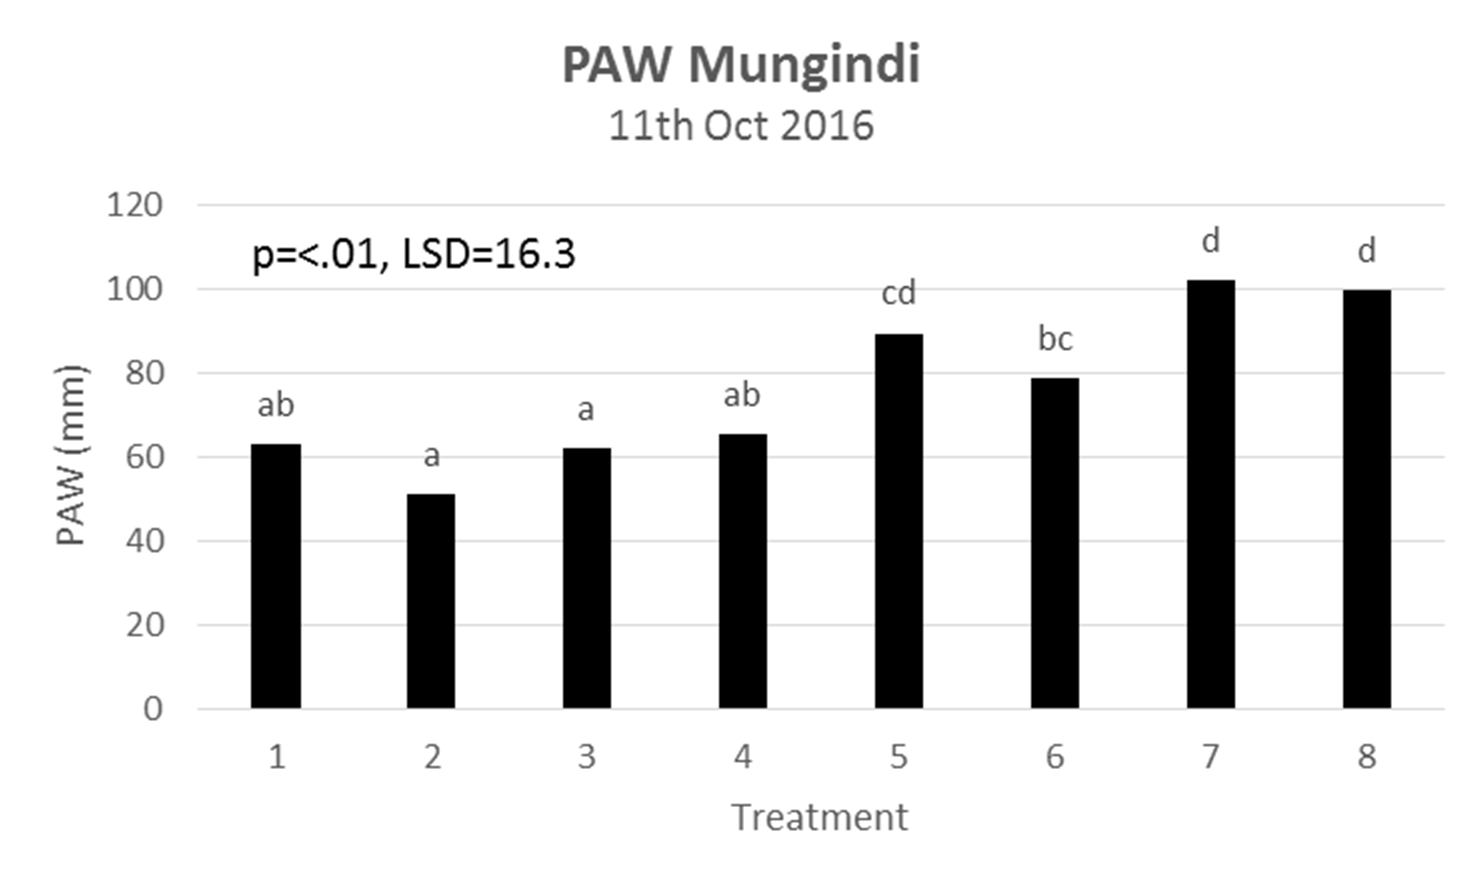
Figure 3. An additional 24mm of PAW was stored where an extra 5t/ha of straw had been added to the standing stubble, i.e. Treatment 4 versus Treatment 5.
Assumptions for soil bulk density and crop lower limits have been made for this particular site to calculate plant available water. Values for bulk density and crop lower limits were taken from the nearest soil-characterised site at Thallon. While the absolute figures may not be correct, the relative treatment differences remain.
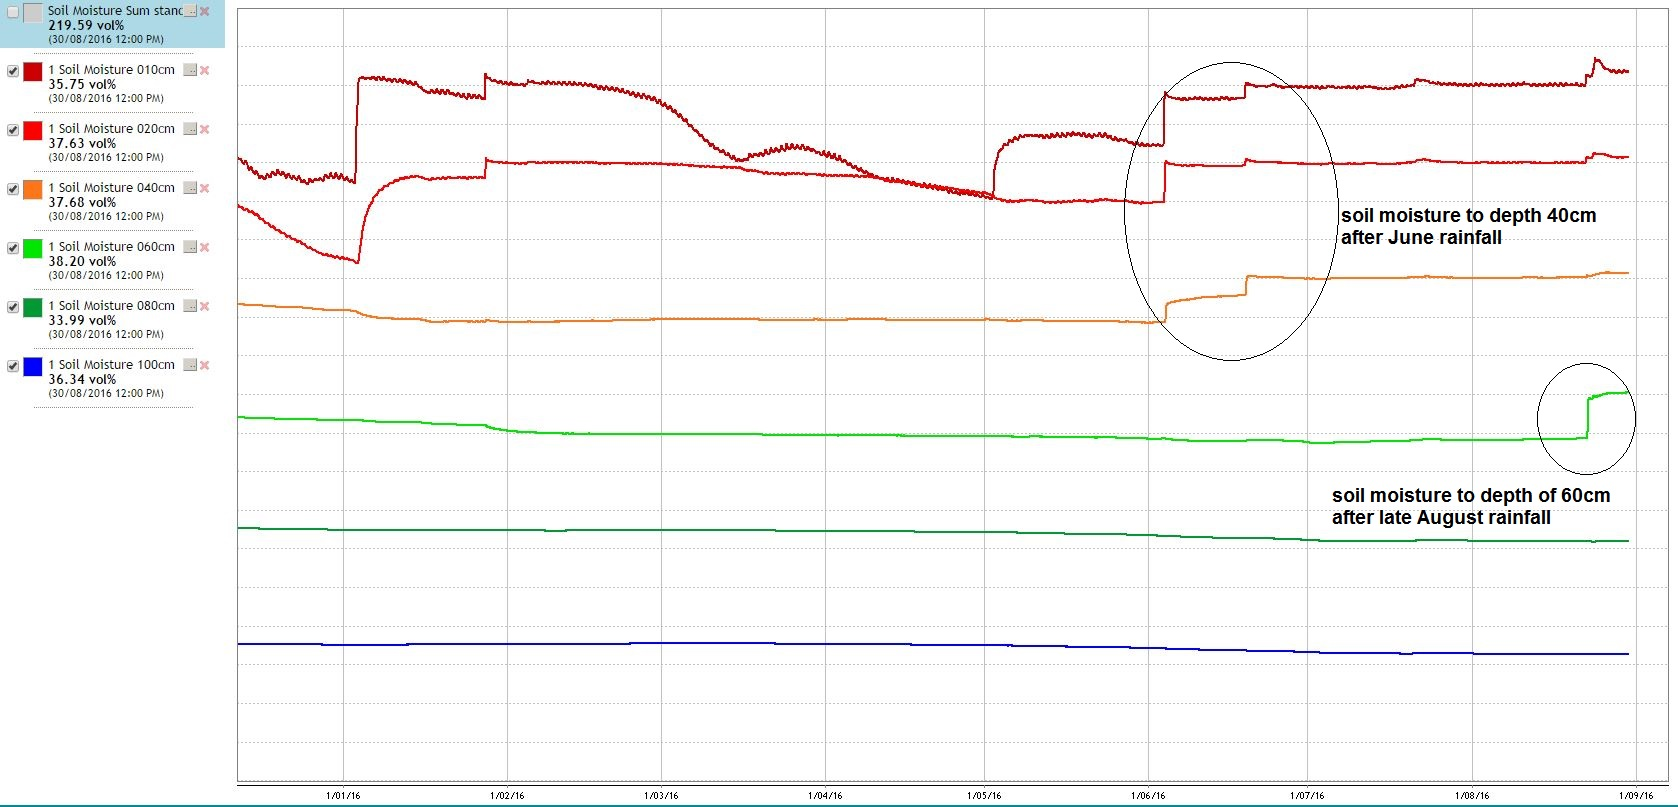
Figure 4. Standing stubble. January rainfall wet the top 20cm, but was rapidly lost due to evaporation during a drier March/April. An extra 100mm of rainfall was required in the standing stubble compared to 40t/ha straw to get the same moisture level down to 60cm.
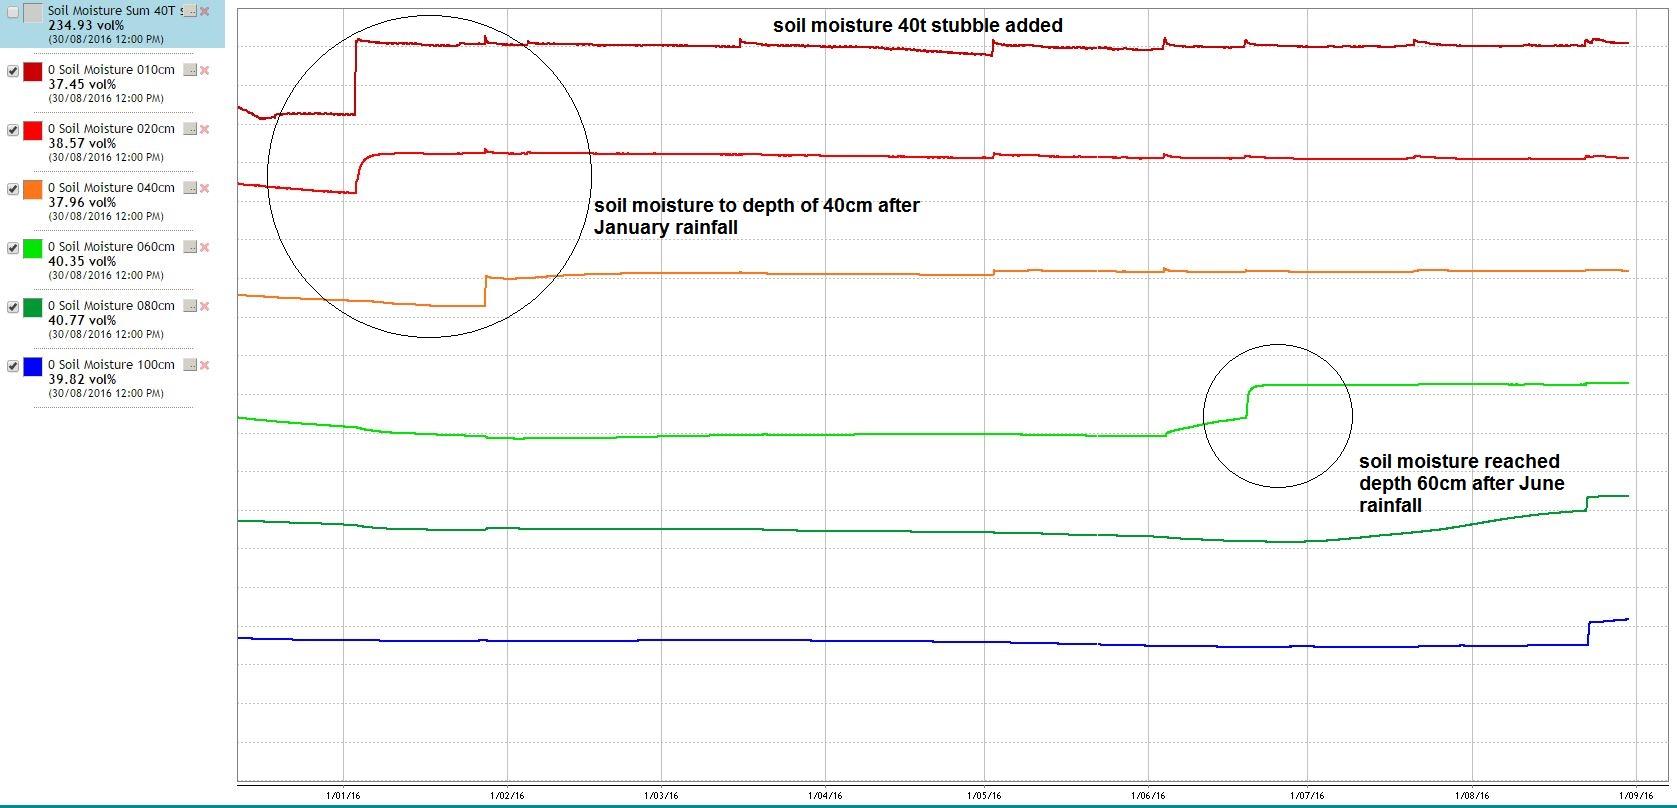
Figure 5. Standing stubble plus an extra 40t/ha straw added. Following the January rainfall, the surface moisture layers remained wet. The mulch layer appeared to reduce evaporative losses, and consequently the soil profile filled more quickly.
Fallow efficiency x stubble type
Following the harvest of winter trials in 2015 at a P thornei trial site at Macalister, NGA collected Dual EM data on 27th Nov 2015 from plots recently harvested. Data was collected with a minimum of four readings per plot (6m long x 2m wide plot dimensions). Dual EM data was recorded at four separate depths: 50cm, 100cm, 150cm and 300cm. During data collection, the Dual EM emitter/receiver was suspended approx. 30cm above ground level naturally altering the depth to which the Dual EM measured. The corresponding depths of measurement were now 20cm, 70cm, 120cm and 270cm.
In order to convert the Dual EM data into millimetres of plant available water a calibration curve had to be developed. Fortunately, the paddock had a previous soil characterisation carried out so figures for bulk density and crop lower limits were used. Specific plots within the trial area that were known to have different water contents were initially measured using the Dual EM and accurately marked for later soil sampling. Physical soil samples were taken from the identical location to the Dual EM readings to obtain the gravimetric soil water percentage. The appropriate bulk density and crop lower limits were applied to the calculation to determine the PAW down to a depth of 120cm.
Following the first Dual EM run, data for each plot was collected and averaged for later analysis. This data provided an indication to the differences in soil water remaining in the profile following each crop, and differences within the same crop type when moving from low to high Pt levels.
A second Dual EM run on the 1st September 2016 determined the quantity of soil water accumulated during the fallow period. A total of 342mm of rainfall was received during this ten month fallow period. Further reference points were recorded with the Dual EM and sampled to add additional points to the calibration curve.
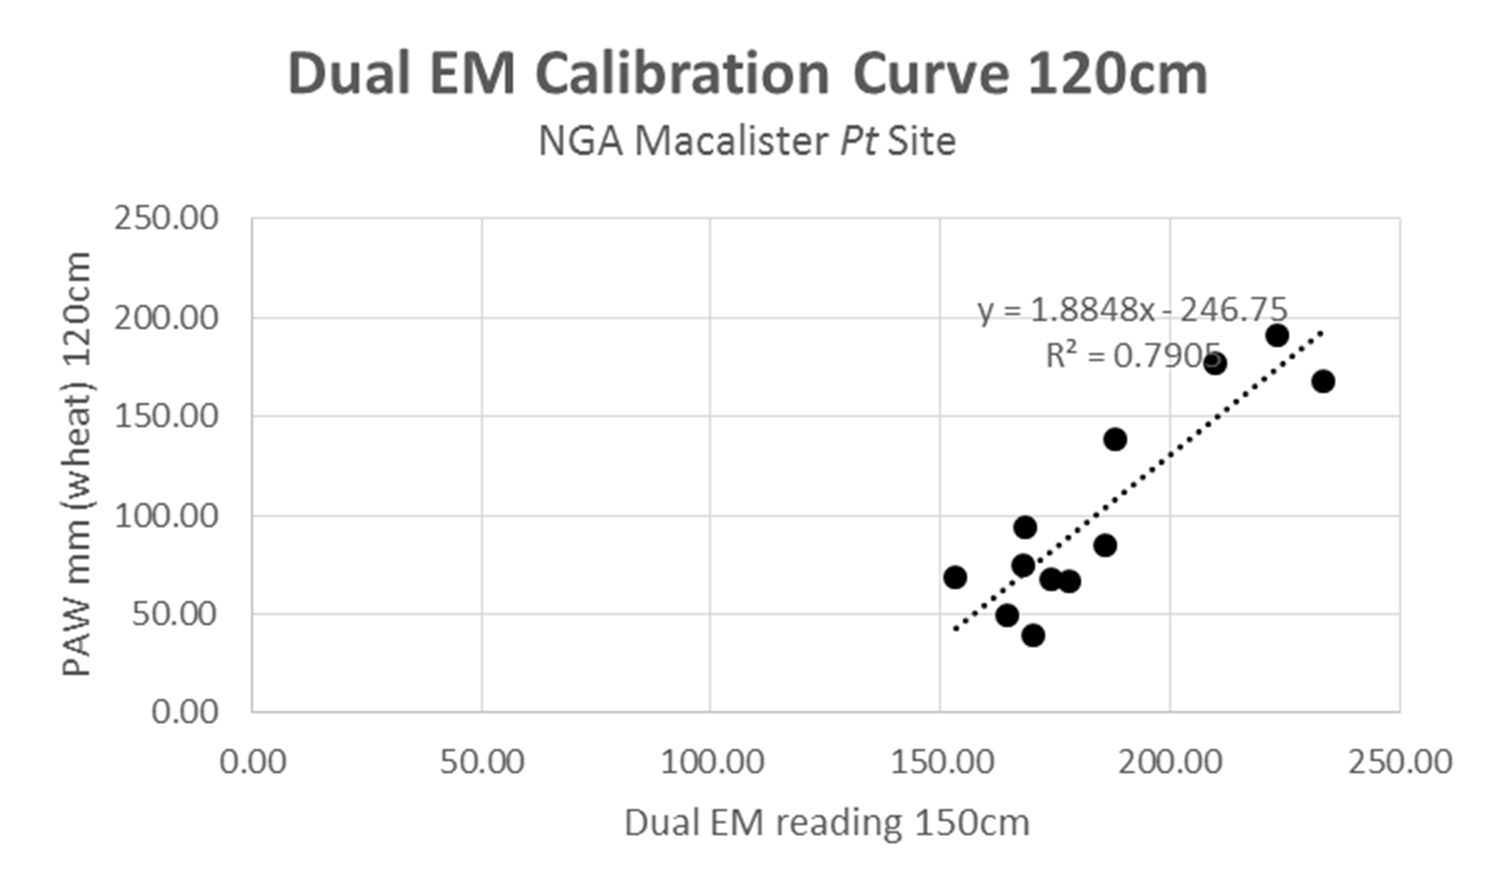
Figure 6. Accuracy of converting dual EM data into PAW is highly dependent on sampling a range of points with different soil moisture levels, and having good soil characterisation data.
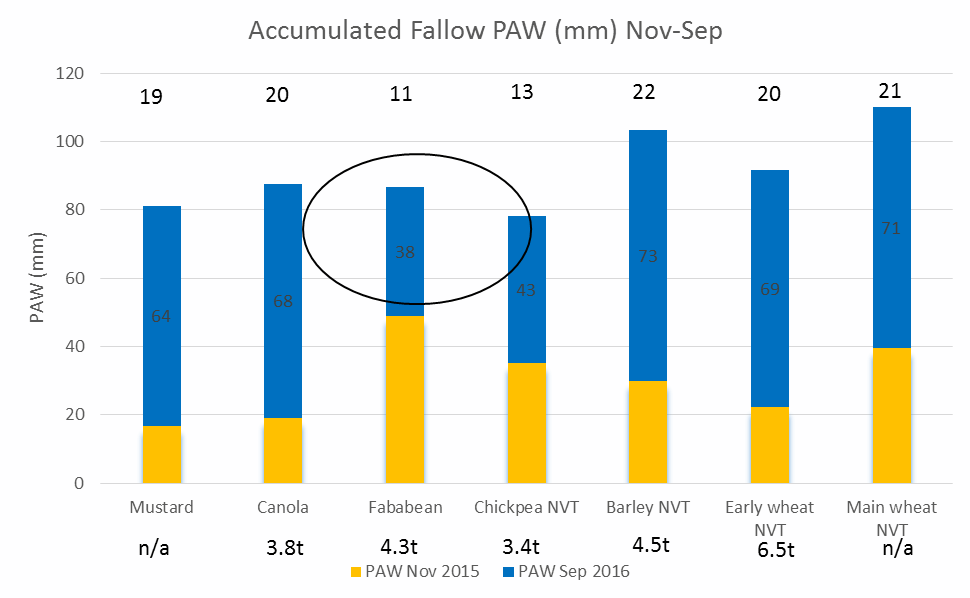
Figure 7. Stacked column graph indicates the PAW at the two dual EM timings for each stubble type. The yellow column illustrates the PAW remaining in the soil after harvest, i.e. start of fallow PAW. The blue column represents the PAW at the end of the fallow, with the number inside the blue column representing the gain in mm of PAW during the fallow period. The number above the blue column is the fallow efficiency percentage for each stubble type. A total of 342mm of rainfall was received during the fallow period.
It appears the range in fallow efficiency figures are influenced by stubble type, the amount of stubble, how easily the stubble is broken down, and whether the stubble is standing or lying flat on the soil surface. For example, both the faba bean and chickpea stubble began the fallow period with 4.3t and 3.4t DM/ha respectively, but by the end of the fallow period very little stubble remained. The low C:N ratio of these legume stubbles allow rapid microbial breakdown, which may be a possible cause of the relatively low fallow efficiency compared to the cereal and canola stubbles.
Conclusion
Accumulating groundcover to beyond 100 % appears to offer significant benefits in both capturing and retaining soil water. NGA’s trial work has demonstrated that real benefits in the accumulation of soil water can occur once 100 % ground cover is reached, which generally coincides with approx. 10t of dry matter per hectare. Trial results have demonstrated that the amount of soil water is related to the amount of groundcover, with significant gains occurring once 100 % groundcover is reached and the thickness of mulch layer on the soil surface accumulates. These gains are most likely the result of reduced evaporation losses from the soil surface, particularly the top 20cm.
The challenge for growers now is how to achieve such levels of stubble cover and still maintain the ability to plant the following crop through high levels of trash. Further work needs to be done to determine whether the same benefit is achieved depending on whether the stubble is standing or lying flat on the ground. Consequently, a large scale trial was initiated in the Walgett district in December 2016 evaluating the impact of stubble height and standing versus lying flat on soil water accumulation.
The use of Dual EM technology has provided an efficient and cost effective way of providing an objective measure of soil water. However, in order to obtain meaningful results from EM soil water monitoring devices accurate soil characterisation data, and a good spread of soil water contents are required to produce a useful calibration curve.
Following the Dual EM results from our Macalister Pt site, it would appear that canola/mustard are extremely efficient in extracting soil moisture from the profile during the growing season. This can explain the difficulty growers face in trying to refill the profile following such crops.
In terms of fallow efficiency of different stubble types, legume based stubble appears to be less efficient in capturing soil water compared to cereal/canola stubble. The type, amount and whether the stubble is standing or lying flat appears to effect the overall fallow efficiency of each stubble type.
Acknowledgements
The research undertaken as part of this project is made possible by the significant contributions of growers through both trial cooperation and the support of the GRDC, the author would like to thank them for their continued support.
Contact details
Brendan Burton
Northern Grower Alliance
PO Box 78, Harlaxton Qld 4350
Mob: 0428 979 170
Email: Brendan.burton@nga.org.au
GRDC Project Code: NGA0004,
Was this page helpful?
YOUR FEEDBACK