Reducing yield losses from waterlogging by improving drainage in melon hole country
Reducing yield losses from waterlogging by improving drainage in melon hole country
Author: Tim Neale | Date: 18 Jun 2017
Take home message
Up until a few years ago, land levelling was out of reach for many dryland grain growers trying to manage water logging problems, especially in melon hole country.
With recent major advances in GPS technology and new software solutions, there is compelling evidence to show the return on investment from reducing waterlogging in dryland grain production.
The cost of waterlogging
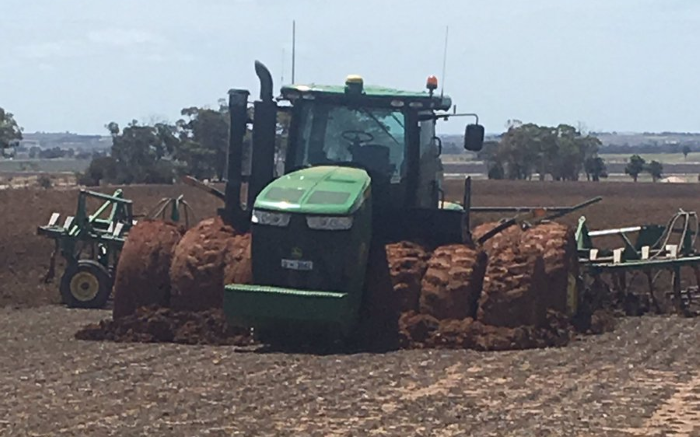
Work on the Darling Downs of Queensland has shown that waterlogging can cost as much as $1200/ha in a single year (from yield reduction), and that’s not even considering the losses of nitrogen that can occur. In melon hole country, wet areas can cover more than 50% of the field meaning selecting the ideal time to plant is challenging. Besides this, growers know how much of a pain a wet spot in the paddock can be, as shown on Twitter regularly (source @TrentCosgrove).

Figure 1. Effect of a wet spot in the paddock (source: @TrentCosgrove)
How technology can help
In the past, farmers have used grader boards, dozers, land planes, even railway iron to try and pull the tops of melon holes down to try and alleviate the problem. However, this doesn’t necessarily fix the issue completely and soil cannot be moved very far. There was also a period of laser buckets used in the irrigated cotton industry, but these work without the ability to strategically cut and fill soil and the finished surface is a series of flat planes which were connected together.
The advent of high accuracy RTK (Real-Time Kinematic) GPS systems has revolutionised earthmoving in a range of industries. With accuracies less than a few centimetres horizontally and vertically, and the fact that the system knows where it is on the earths’ surface, means that soil can be shifted precisely from one point to another.
Some available hardware systems include Trimble (including VerticalPoint RTK grade control), John Deere iGrade, PCT Terra-Cutta, Agleader Intellislope, Topcon AgForm, and Farmscan LevelGuide.
Coupled with these advances is also the ability of computer software to automatically determine the cut and fill areas, which in the past was a very manual task only done by experienced operators. Typical cut:fill volumes for a laser levelled job in the past could easily creep over the 500-1000 cubic metres per hectare, and at $2 per cubic metre, that gets very expensive in anything but irrigation country. With new software, many levelling jobs can now be achieved at around 100-200 cubic metres per hectare.
Software that is available includes Optisurface, TerraCutta, AgForm 3D, LevelGuide, Multiplane, and SMS Advanced.
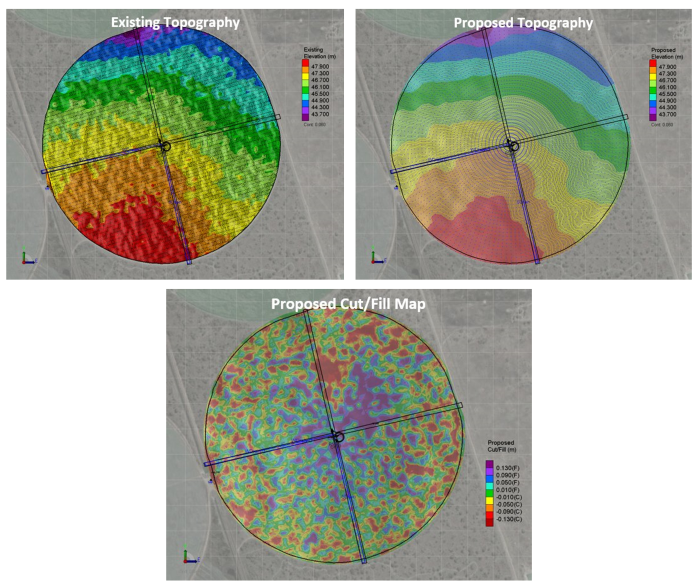
Advances in software means the natural surface/terrain is considered instead of trying to make the land ‘billiard table’ flat – in other words making the field drain whilst shifting as little soil as possible. An example of a melon hole field is shown in the following images, starting with the original topography, the proposed topography, and the resultant cut:fill map (source: @Optisurface).

Figure 2. An example of a melon hole field, starting with the original topography, the proposed topography, and the resultant cut:fill map (source: @Optisurface).
The process
- The first step starts back in paddock and crop selection. Paddocks with high levels of stubble remaining before land preparation will take extra work to reduce this. Heavy stubbles such as sorghum tend to inhibit the land levelling blade. It is best to level either after a low cover crop such as chickpea, or cotton where you are required to pupae bust. Try to avoid periods of high erosion risk when doing this.
- The next step in the levelling process is to prepare the land with heavy cultivation. This achieves several outcomes. Firstly it removes more stubble allowing earthmoving buckets to work most effectively, secondly it provides deep tilth helping the operator cut the soil, and thirdly it levels any old wheel tracks which cause problems with the survey.
- It is highly recommended before commencing levelling in melon holed areas that a soil test be conducted first to try and identify any sodic or saline subsoils that may be exposed. There have been many examples of where poor soil exposed have led to long lasting low production ‘scalds’ covering large percentages of fields. Tests in the tops of the melon holes is most critical as this is where most of the soil will come from.
- Conduct the RTK GPS survey once the cultivation is completed, as near as practical to the land levelling operation. This may not always be the case with the erratic rainfall patterns of Australia. Please keep in mind that drone derived data will not be accurate enough. LiDAR data if available could be used. Swath widths of the survey need to be varied depending on the nature of the topography. Small melon hole country or that with lots of elevation changes (eg erosion) may need surveying swaths as narrow as 10m apart, whereas rolling landscapes can be extended up to 40m swaths. Ensure you capture plenty of temporary benchmarks throughout the survey along with a designated master bench mark for the operator to site on.
- The survey data is loaded into the computer software and the operator enters required information, such as minimum and maximum grades, as well as the cut:fill ratios and flow paths. Several decisions will need to be made at this step with regards to how the field is planned to be farmed into the future. Do you want all the water to flow in one direction to the end of the field, or is it more important that the water simply exits the field in the shortest distance? Are there any drains planned? Where will the water exit the property – will this cause issues with neighbours? Which direction will you run your CTF lines?
- The cut:fill file is then loaded into the machine to being the levelling process. The operator should refer to the benchmarks regularly through the survey, as vertical drift (inaccuracies) can occur due to the nature of GPS systems. New technology such as Trimble’s Vertical Point RTK technology has greatly improved vertical accuracies, and reduced the period when vertical accuracies are outside tolerance limits. It does this by having stationery rovers in the field as reference points in addition to the base station.
- In deeply melon holed country it is most cost effective to shift large volumes of soil with a dozer first. Some farmers have even used equipment called a PullDozer – the name is self-explanatory. Then the final trims are done with a levelling (laser) bucket. With RTK GPS levelling jobs, it is important that the base station is near the machinery operating in the field – check with the manufacturer regarding the recommended base lines. One software company offers the work to be completed with a dozer, using technology developed for the mining industry (3DdataGuidance.com).
- After the process has completed it is important to get crop cover back in as soon as possible. This reduces the risk of erosion and also helps alleviate compaction caused by the heavy machinery during the process. As mentioned previously it is important to consider the direction of your CTF lines and the interaction with the levelling job. In some cases, it may not be feasible to drain the country in the same direction as your runlines, thereby causing some localised wheeltrack wetness.
- If some more-hostile subsoils (such as sodic soils) are exposed during the levelling process, then the cut:fill map can be used as a cost effective way to variable rate application of gypsum. Clearly a soil test is needed at the cut points to determine the rate of gypsum required.
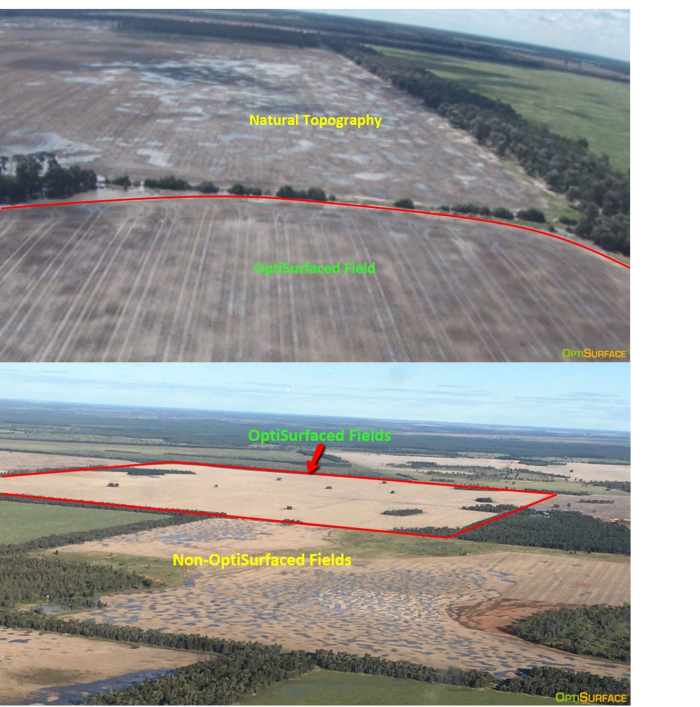
Once complete, the difference in production and accessibility is greatly increased, as shown in the photos in Figure 3 (source OptiSurface™).

Figure 3. The difference in production and accessibility with land levelling (source OptiSurface™)
Acknowledgements
Thanks to OptiSurface™ for the land leveling images used in the paper.
Contact details
Tim Neale
O2group
Mb: 0409 634 006
Email: tim.neale@o2group.com.au
™ Trademark
