Amelioration of sandy soils - opportunities for long term improvement
Author: Sam Trengove, Stuart Sherriff (Trengove Consulting) | Date: 20 Feb 2018
Take home messages
- Treatments combining deep ripping with surface applied nutrition (synthetic fertiliser or chicken litter) delivered the highest marginal returns (additional income less treatment costs), ranging from $934/ha to $1249/ha over three years.
- Depending on treatment cost, these delivered return on investment (ROI) ranging from 142% to 521% over three years.
- Placement of high rates of chicken litter (20t/ha) or matched synthetic fertiliser placed in the subsoil did not provide any yield advantage over surface application of same.
Background
Sandy dune soils are an important feature of the dune swale landscape of the northern Yorke Peninsula, SA. Common characteristics of these sands include low plant available water holding capacity, low organic matter, low nutrient availability, compaction, non-wetting and high risk for wind erosion. In 2015, a trial site was established on a sand hill near Bute, SA, to investigate options for amelioration of these constraints. This paper will report on the results of these trials.
Method
Two trials were established on a sand hill near Bute in 2015 investigating treatments including deep ripping, spading, clay, chicken litter (rate and placement) and fertiliser. The soil at the site is described as a siliceous sand and the initial soil test results for the site are shown in Table 1. Treatment responses were measured in three consecutive cropping seasons of Grenade CL Plus wheat in 2015, Spartacus CL barley in 2016 and PBA Jumbo2 lentil in 2017. Fertiliser treatments were applied in each season, with all other treatments applied once only at trial initiation in 2015. The trials were randomised complete block designs with three replicates. Plots were 10m x 2m and were sown with knife points and press wheels on 250mm row spacing.
Table 1. Initial trial site soil test results, March 2015.
Soil depth | Available N | Colwell P | PBI | Colwell K | Available S | Organic C | pH (CaCl2) | pH (H2O) | Cation exchange capacity |
|---|---|---|---|---|---|---|---|---|---|
0-10 | 16 | 48 | 15 | 112 | 4.0 | 0.46 | 5.2 | 5.9 | 2.8 |
0-30 | 33 | 35 | 19 | 117 | 8.0 | 0.30 | 6.6 | 7.2 | 3.8 |
30-60 | 10 | 17 | 19 | 132 | 5.5 | 0.10 | 7.2 | 7.9 | 5.2 |
60-90 | 10 | 7 | 33 | 138 | 4.7 | 0.16 | 7.4 | 8.3 | 7.1 |
90-120 | 10 | 4 | 99 | 87 | 5.5 | 0.10 | 7.8 | 8.6 | 9.1 |
Treatment details
All income and costs quoted in this paper exclude GST.
Deep ripping
Ripping was conducted with the Peries-Wightman subsoiler, with two tynes spaced 800mm apart and working to a depth of 450mm to 500mm. This machine has a 125mm diameter pipe behind each tyne for delivery of bulk soil amendment products to near the bottom of the rip line. This had the effect of allowing some topsoil to flow back into the furrow behind the tyne, providing some 'topsoil inclusion'. This same machine was also used for subsoil manure application in Trial 2. Commercial application for deep ripping was estimated to have a commercial cost of $60/ha.
Spading:
Farmax spader working to 300mm deep. Commercial application for this was costed at $200/ha.
Clay
Clay was sourced from the 0cm to 40cm layer from the adjacent swale, approximately 35% clay content. At 130t/ha, commercial application for this was costed at $400/ha.
Chicken litter
Chicken litter was supplied from a broiler shed on the Wakefield Plains. Nutrient analysis is shown below (Table 2). At 5t/ha and 20t/ha, commercial application costs were costed at $180/ha and $700/ha, respectively, including product, freight and spreading costs.
Fertiliser
Phosphorus (P) applied as monoammonium phosphate (MAP) and potassium (K) applied as muriate of potash (MoP) were applied to the soil at seeding in each season (Table 3) and zinc (Zn), copper (Cu) and manganese (Mn) were applied as sulphates post emergent as a foliar application. Nitrogen (N) (urea and sulphate of ammonia (SoA)) and sulphur (S) applied as SoA were applied post emergent to the cereals in year 1 and year 2 and for lentils in 2017. Sulphur was applied prior to seeding as gypsum. An additional trial assessing response to K, S and micronutrients found no response to these inputs from 2015 to 2017 (data not presented). Therefore, the economic analysis has only costed the N, P and S as the applications of these more closely reflect grower practice in the district surrounding the trial. Commercial application for this was costed at $430/ha over the three years, including application costs for post emergent applications.
Table 2. Nutrient concentration of applied chicken litter.
Nutrient | Nutrient conc. | Moisture content | Nutrient conc. | Kg nutrient per tonne | Kg nutrient per 5 tonne | Kg nutrient per 20 tonne fresh weight | |
|---|---|---|---|---|---|---|---|
N | Nitrogen | 3.8% | 8% | 3.50% | 35.0 | 175 | 699 |
P | Phosphorus | 1.72% | 1.58% | 15.8 | 79 | 316 | |
K | Potassium | 2.31 | 2.13% | 21.3 | 106 | 425 | |
S | Sulphur | 0.55% | 0.51% | 5.1 | 25 | 101 | |
Ca | Calcium | 3.48% | 3.20% | 32.0 | 160 | 640 | |
Mg | Magnesium | 0.73% | 0.67% | 6.7 | 34 | 134 | |
Zn | Zinc | 0.46g/kg | 8% | 0.42g/kg | 0.4 | 2.1 | 8.5 |
Mn | Manganese | 0.51g/kg | 0.47g/kg | 0.5 | 2.3 | 9.4 | |
Cu | Copper | 0.13g/kg | 0.12g/kg | 0.1 | 0.6 | 2.4 | |
B | Boron | 0.05g/kg | 0.05g/kg | 0.05 | 0.2 | 0.9 | |
Fe | Iron | 4.33g/kg | 3.98g/kg | 4.0 | 19.9 | 79.6 | |
Table 3. Nutrient (kg/ha) applied in each season to fertiliser treatment.
Nutrient | 2015 | 2016 | 2017 |
|---|---|---|---|
N | 99 | 76 | 9 |
P | 20 | 20 | 20 |
S | 21 | 21 | 60 |
K | 50 | 50 | 50 |
Zn | 0.26 | 0.26 | 0.26 |
Cu | 0.09 | 0.09 | 0.09 |
Mn | 0.77 | 0.77 | 0.77 |
Trial 1
Trial 1 was a factorial trial, assessing four inputs:
- Deep ripping — yes or no.
- Annual fertiliser — yes (Table 3) or no.
- Clay — yes (130t/ha) or no.
- Chicken litter — 0, 5 or 20t/ha.
The factorial of these gives 24 treatments (Table 5). Deep ripping, clay and chicken litter were applied once only in 2015, while fertiliser treatments were applied each year.
Trial 2
Trial 2 assessed:
- Placement of chicken litter or fertiliser: surface placement veruss subsoil (300mm to 400mm deep).
- Spading.
- Matching nutrition of chicken litter with synthetic fertiliser: 20t/ha chicken litter versus matched NPKS from fertiliser. That is 1026kg/ha urea, 800kg/ha MAP, 420kg/ha SoA and 704kg/ha MoP. This synthetic fertiliser nutrition is actually marginally less than that supplied by 20t/ha chicken litter, however rates were applied before final chicken litter analysis was available.
For a complete list of treatments see Table 6.
Table 4. Rainfall received in seasons 2015to 2017 and trial seeding dates.
2015 | 2016 | 2017 | |
|---|---|---|---|
GSR | 204 (decile 1) | 441 (decile 9) | 209 (decile 1) |
Annual rainfall | 309 (decile 2) | 696 (decile 10) | 369 (decile 4) |
Sowing date | 20 May | 20 May | 17 May |
Results and discussion
Soil penetrometer resistance
Penetrometer resistance was measured prior to sowing in April 2016, one year after treatments were imposed (Figure 1). These measurements indicate much higher resistance in the control treatment compared with treatments that were ripped or spaded. Ripping was to a depth of approximately 500mm, whereas spading was to a depth of 300mm. These working depths explain differences observed in penetrometer resistance between these treatments, where below 300mm resistance is greater in the spaded treatment, with the difference narrowing with increasing depth until there is no difference below ripping depth of 500mm. In general, crop root growth restriction starts when penetration resistance exceeds 1500kPa and severe restriction when resistance exceeds 2500kPa (Blackwell et al. 2016). Even with deep ripping, penetration resistance exceeds 2500kPa below 300mm — this may indicate an opportunity for further improvement.
It should be noted that the industry standard is for penetrometer measurements to be taken at field capacity when comparing between sites and soil types. This site received 110mm rainfall in six weeks prior to measurements in March and April 2016, therefore it is assumed the soil was close to field capacity.
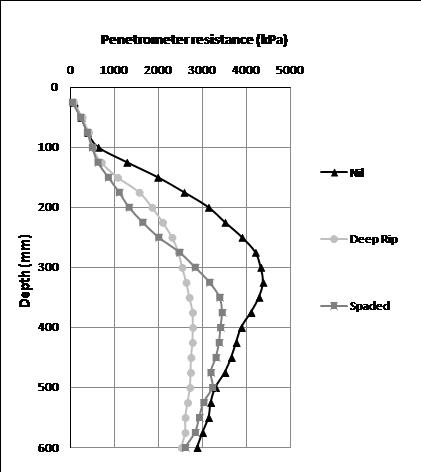
Figure 1. Penetrometer resistance measured in March 2016, 12 months after treatment application.
Soil nutrition
Chicken litter applied at 20t/ha in 2015 increased deep soil N and S measured prior to seeding in 2016 and 2017 (Table 5). However, annual fertiliser and 5t/ha chicken litter were the same as the unfertilised control. Nitrogen recovery also indicates that only 18% of the N applied in 20t/ha chicken litter has been recovered in harvested grain. In addition to the measured deep soil N, the remaining 82% (573kg/ha) may remain in chicken litter (not yet mineralised), be in crop residues or soil organic matter or may have been lost through ammonia losses or leaching. Unless large losses have occurred, this indicates there should still be considerable N in the system to support ongoing crop responses where chicken litter has been applied at 20t/ha. Soil testing will be conducted to measure further changes in soil organic matter this year.
Table 5. Nitrogen balance and deep soil N and S (0-1.2m) measured prior to seeding in the stated season for selected treatments.
Total applied and removed, 2015-2016 | 2015 | 2016 | 2017 | |||||||
|---|---|---|---|---|---|---|---|---|---|---|
Treatment | N applied | N removed | NUE (% recovery) | S applied | N (kg/ha) | S (kg/ha) | N (kg/ha) | S (kg/ha) | N (kg/ha) | S (kg/ha) |
Nil | 0 | 63 | - | 0 | - | - | 68 | 20 | 43 | 74 |
Annual fertiliser | 175 | 128 | 37% | 48 | 63 | 24 | 73 | 34 | 43 | 66 |
Chicken litter @ 5t/ha | 175 | 103 | 23% | 25 | - | - | 68 | 28 | 44 | 81 |
Chicken litter @ 20t/ha | 699 | 190 | 18% | 101 | - | - | 291 | 140 | 88 | 111 |
Lsd (0.05) | - | - | - | - | - | - | 70 | 40 | 28 | 29 |
Trial 1: Crop growth and grain yield responses
Wheat 2015
Large growth responses occurred in year 1 (2015) in response to chicken litter, fertiliser and deep ripping. However, with low growing season rainfall (GSR) (Table 4) and hot conditions during grain fill in that season, the relationship between in season crop growth and yield was not linear (Figure 2). There was an optimum level of canopy production, and an approximate normalised difference vegetation index (NDVI) of 0.5 to 0.65 at GS31 for optimising yield. Beyond this, the larger canopy used too much moisture pre anthesis and yields declined. Below this the crop was constrained by insufficient nutrition and lack of green leaf area. Therefore yields were highest for deep ripping and chicken litter at 5t/ha (Table 6). Combinations of these also produced high yields, but not significantly more than each individually. However, deep ripping in combination with standard fertiliser practice increased yield significantly compared with fertiliser alone. Treatments receiving chicken litter at 20t/ha had lower yields, due to the excessive biomass production. However, yields for these were not significantly less than standard practice, but not better than nil either. Grain quality for these treatments also declined, with high screenings, low test weight and high protein — many of these were graded as AUW1 (data not shown).
Similar results were observed in Trial 2 (Table 7). The combination of applying chicken litter at 20t/ha, clay, deep ripping, spading and applying a normal fertiliser practice (treatment 5) produced the most spectacular failure in the trial. This treatment produced the greatest growth response. The spading process thoroughly mixed in the chicken litter and provided conditions conducive for increased mineralisation of nutrients in the litter, promoting increased biomass production. There was insufficient moisture to support this. The treatment hayed off severely, producing the lowest yields in the trial in that year (Table 7).
In 2015, the safest way to apply chicken litter at 20t/ha was to place it in the subsoil, with no additional nutrition applied to the surface (treatment 10, Table 7). Canopy biomass production was slow early, limited by low nutrition in the topsoil. However, the crop responded when the roots reached the chicken litter banded in the subsoil, approx. six to eight weeks after sowing. The delayed biomass response appears to have reduced early moisture use and saved more for the grain filling period. This effect was negated where standard fertiliser was applied to the surface in combination with subsoil manure.
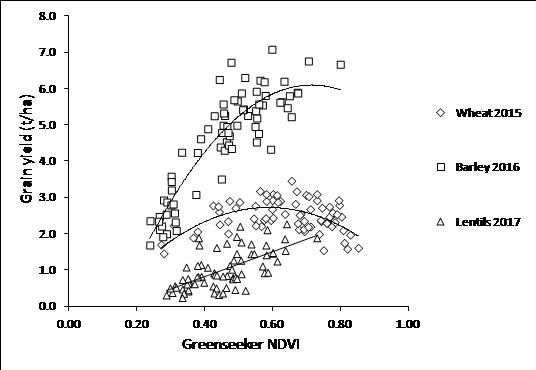
Figure 2.a Greenseeker NDVI measured at GS31 for wheat and barley and early flower for lentil and grain yield. Wheat R2 = 0.33, barley R2 = 0.81, lentils R2 = 0.41.
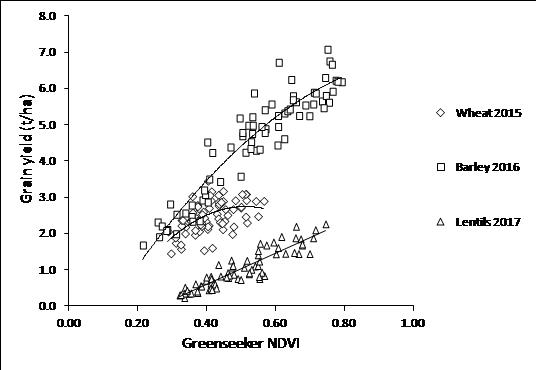
Figure 2.b Greenseeker NDVI measured mid-late grain fill (early October) and grain yield. Wheat R2 = 0.30, barley R2 = 0.88, lentils R2 = 0.83.
Table 6. Trial 1 treatments, treatment costs, grain yields and economic returns.
Treatment | Chicken litter | Ripping | Clay | Annual fertiliser | Amelioration cost | Grain yield (t/ha) | 2015-2017 Summary ($/ha) | |||||
|---|---|---|---|---|---|---|---|---|---|---|---|---|
Wheat 2015 | Barley 2016 | Lentil 2017 | Total costs incl. annual fert. | Gross income | Marginal return | ROI | ||||||
1 | 0 | No | 0 | No | 0 | 1.79 | 2.15 | 0.41 | 0 | 1170 | 0 | - |
2 | Yes | 0 | 2.44 | 4.52 | 0.39 | 430 | 1999 | 399 | 93% | |||
3 | 130 | No | 400 | 2.30 | 2.08 | 0.54 | 400 | 1336 | -234 | -58% | ||
4 | Yes | 400 | 2.52 | 4.44 | 0.69 | 830 | 2181 | 181 | 22% | |||
5 | Yes | 0 | No | 60 | 2.78 | 2.77 | 1.22 | 60 | 2035 | 805 | 1342% | |
6 | Yes | 60 | 3.11 | 4.83 | 0.97 | 490 | 2594 | 934 | 191% | |||
7 | 130 | No | 460 | 2.39 | 2.59 | 1.10 | 460 | 1802 | 172 | 37% | ||
8 | Yes | 460 | 2.54 | 5.16 | 1.00 | 890 | 2489 | 430 | 48% | |||
9 | 5 | No | 0 | No | 180 | 2.88 | 2.90 | 0.57 | 180 | 1674 | 324 | 180% |
10 | Yes | 180 | 2.89 | 4.98 | 0.57 | 610 | 2339 | 559 | 92% | |||
11 | 130 | No | 580 | 2.45 | 2.66 | 0.72 | 580 | 1735 | -15 | -3% | ||
12 | Yes | 580 | 2.35 | 4.84 | 0.74 | 1010 | 2206 | 26 | 3% | |||
13 | Yes | 0 | No | 240 | 2.92 | 3.60 | 1.67 | 240 | 2659 | 1249 | 521% | |
14 | Yes | 240 | 2.55 | 5.85 | 1.23 | 670 | 2840 | 1000 | 149% | |||
15 | 130 | No | 640 | 2.96 | 3.75 | 1.52 | 640 | 2549 | 739 | 116% | ||
16 | Yes | 640 | 2.40 | 5.23 | 1.36 | 1070 | 2686 | 446 | 42% | |||
17 | 20 | No | 0 | No | 700 | 2.50 | 5.66 | 0.97 | 700 | 2588 | 718 | 103% |
18 | Yes | 700 | 2.53 | 5.60 | 0.68 | 1130 | 2405 | 105 | 9% | |||
19 | 130 | No | 1100 | 1.97 | 5.54 | 1.08 | 1100 | 2496 | 226 | 21% | ||
20 | Yes | 1100 | 2.15 | 5.85 | 0.78 | 1530 | 2436 | -264 | -17% | |||
21 | Yes | 0 | No | 760 | 2.28 | 5.85 | 1.68 | 760 | 3007 | 1077 | 142% | |
22 | Yes | 760 | 2.34 | 6.15 | 1.38 | 1190 | 2914 | 554 | 47% | |||
23 | 130 | No | 1160 | 2.03 | 5.94 | 1.55 | 1160 | 2890 | 560 | 48% | ||
24 | Yes | 1160 | 2.26 | 6.54 | 1.48 | 1590 | 3054 | 294 | 18% | |||
Lsd (0.05) | 0.58 | 0.68 | 0.30 | - | 406 | 406 | 96 | |||||
a Grain prices used to calculate gross income depended on grade. Wheat: AUH2 = $260/t, ASW1 = $245/t, AGP1 = $235/t, AUW1 = $235/t, FED1 = $215/t. Barley: Malt = $250/t, Feed = $225/t. Lentils = $600/t.
* Net return = gross income - treatment costs (ie. amelioration and fertiliser product and application cost) - gross income of nil ($1170/ha).
Table 7. Trial 2 treatments, treatment costs, grain yields and economic returns.
Treatment | Ameliorant | Placement | Ripping | Spading | Clay | Annual fertiliser | Amelioration and fertiliser costs | Grain yield (t/ha) | Sum 2015 - 2017 ($/ha) | ||||
|---|---|---|---|---|---|---|---|---|---|---|---|---|---|
Wheat 2015 | Barley 2016 | Lentil 2017 | Gross Income a | Marginal Return * | ROI | ||||||||
1 | None | - | No | No | 0 | No | 0 | 1.87 | 2.30 | 0.69 | 1434 | - | - |
2 | 20t Chicken Litter | Surface | Yes | No | 130 | Yes | 1590 | 2.02 | 5.82 | 2.20 | 3133 | 109 | 7% |
3 | 20t Chicken Litter | Subsoil | Yes | No | 130 | Yes | 1730 | 2.50 | 5.67 | 1.57 | 2847 | -317 | -18% |
4 | None | - | No | Yes | 0 | No | 200 | 2.64 | 2.44 | 1.64 | 2240 | 605 | 303% |
5 | 20t Chicken Litter | Surface | Yes | Yes | 130 | Yes | 1790 | 1.44 | 5.39 | 1.81 | 2650 | -574 | -32% |
6 | 3t Synthetic Fert | Surface | Yes | No | 130 | No | 2270 | 2.68 | 6.28 | 1.34 | 2860 | -844 | -37% |
7 | 3t Synthetic Fert | Subsoil | Yes | No | 130 | No | 2300 | 2.33 | 5.62 | 1.33 | 2682 | -1052 | -46% |
8 | 3t Synthetic Fert | Subsoil | Yes | No | 0 | No | 1900 | 2.37 | 5.08 | 1.03 | 2330 | -1005 | -53% |
9 | 20t Chicken Litter | Subsoil | Yes | No | 0 | Yes | 1330 | 2.49 | 5.73 | 1.08 | 2535 | -230 | -17% |
10 | 20t Chicken Litter | Subsoil | Yes | No | 0 | No | 900 | 3.12 | 5.28 | 1.76 | 3158 | 824 | 92% |
Lsd (0.05) | 0.67 | 0.66 | 0.33 | 620 | -814 | 136 | |||||||
a Grain prices used to calculate gross income depended on grade. Wheat: AUH2 = $260/t, ASW1 = $245/t, AGP1 = $235/t, AUW1 = $235/t, FED1 = $215/t. Barley: Malt = $250/t, Feed = $225/t. Lentils = $600/t.
* Marginal return = gross income – treatment costs (ie. amelioration and fertiliser product and application costs) - gross income of nil ($1434/ha).
Table 8.Nutrient analysis of lentil whole tops for selected treatments in Trial 1, sampled 30 July 2017.
Treatment | Phosphorus | Potassium | Calcium | Magnesium | Sulphur | Boron | Copper | Zinc | Manganese | Molybdenum | |
|---|---|---|---|---|---|---|---|---|---|---|---|
Nil | 1 | 0.37 | 2.1 | 1.08 | 0.36 | 0.25 | 28 | 5.1 | 85 | 147 | 0.40 |
Annual fertiliser | 2 | 0.38 | 2.2 | 1.15 | 0.36 | 0.41 | 27 | 10.5 | 143 | 330 | 0.40 |
Clay | 3 | 0.34 | 2.0 | 1.15 | 0.37 | 0.25 | 29 | 6.6 | 84 | 106 | 0.40 |
Ripping | 5 | 0.40 | 2.5 | 1.21 | 0.38 | 0.27 | 29 | 5.4 | 81 | 127 | 0.43 |
5t/ha chicken litter | 9 | 0.40 | 2.3 | 1.04 | 0.35 | 0.24 | 27 | 4.5 | 75 | 110 | 0.40 |
20t/ha chicken litter | 17 | 0.48 | 2.7 | 1.12 | 0.48 | 0.28 | 29 | 3.5 | 75 | 100 | 0.87 |
Fert, clay, rip, 20t/ha CL | 24 | 0.53 | 2.8 | 1.12 | 0.37 | 0.37 | 26 | 8.8 | 107 | 200 | 0.61 |
Lsd (0.05) | - | 0.03 | 0.3 | ns | 0.05 | 0.03 | ns | 1.9 | 13 | 43 | 0.19 |
Barley 2016
Crop nutrition was the biggest factor influencing yields in 2016, a decile 9 growing season (Table 4), where response to chicken litter at 20t/ha > annual fertiliser > chicken litter at 5t/ha (Table 9). The yield response to chicken litter at 20t/ha could not be matched by combinations of annual fertiliser and chicken litter at 5t/ha. The addition of fertiliser to 20t/ha chicken litter generated an NDVI growth response (data not shown) over that of chicken litter alone, but the yield response was not significant. In contrast to 2015, the relationship between in season growth and grain yield was positive (Figure 2). The highest nutrition treatments had high grain protein (data not shown) that reduced grain quality from malt to feed.
Deep ripping produced an average response of 0.59t/ha (14%) increase across all other treatments (Table 10). The highest yielding treatments in the trial combined high nutrition and deep ripping and exceeded 6t/ha (Table 6).
Table 9. Chicken litter and annual fertiliser application effect on 2016 barley grain yields.
Chicken Litter (t/ha) | Annual fertiliser | Grain yield (t/ha) |
|---|---|---|
0 | No | 2.40 |
5 | 3.23 | |
20 | 5.75 | |
0 | Yes | 4.74 |
5 | 5.23 | |
20 | 6.04 | |
Lsd (0.05) | 0.34 | |
Table 10. Deep ripping effect on 2016 barley grain yields.
Ripping | Grain yield (t/ha) |
|---|---|
No | 4.27 |
Yes | 4.86 |
Lsd (0.05) | 0.21 |
Lentils 2017
Lentils were highly responsive to deep ripping, with yields doubling (Table 11). Interestingly the actual yield increase in response to deep ripping is similar for each year, 0.65t/ha for wheat in 2015 (treatment 6 versus treatment 2, Table 6), 0.59t/ha for barley in 2016 (Table 10) and 0.69t/ha for lentils in 2017 (Table 11). Lentils were also rate responsive to chicken litter (Table 12), but surprisingly there was a small negative yield response to annual fertiliser (Table 13). As a result, the highest treatment yields of up to 1.68t/ha were achieved by deep ripping in combination with either 5t/ha or 20t/ha chicken litter (Table 6). District practice annual fertiliser application achieved the lowest yields in the trial of 0.39t/ha (treatment 2, Table 6) although this was not significantly lower than the nil treatment. Lentil grain yield had a positive linear correlation with in season NDVI (Figure 2).
Nutrient analysis of lentil whole tops indicates that the annual fertiliser treatment has the same P and K concentration as the unfertilised control, despite three annual applications since 2015 (Table 8). The fertilised treatment was higher for S, Cu, Zn and Mn— these too have been applied as fertiliser. Chicken litter at 20t/ha has higher levels of P and K than the annual fertiliser treatment and 5t/ha chicken litter. It was also higher in magnesium (Mg) and molybdenum (Mo) (Table 8). In year 1 of the trial (2015), wheat leaf nutrient analysis showed that the 20t/ha chicken litter treatment had the highest levels for all nutrients measured (data not shown), but this has not been maintained two years later with calcium (Ca), boron (B), S, Cu, Zn and Mn having the same nutrient concentration as the unfertilised control.
Soil moisture measurements indicate a drained upper limit (DUL) at the site of 114mm to a depth of 1.2m (Figure 3). The unfertilised control has a crop lower limit (CLL) in lentils of 69mm, giving plant available water capacity (PAWC) of 45mm. CLL is reduced by deep ripping and the application of chicken litter at 20t/ha, increasing the PAWC. The combination of deep ripping and chicken litter application lowers the CLL further, to 46mm, increasing the PAWC to 68mm. That is a 23mm (51%) increase in PAWC. The treatment induced change in PAWC is highly correlated with lentil grain yield (Figure 4). Lentil yield increases at 67kg/ha/mm of increase in PAWC. Extrapolating the line indicates that lentil yield is zero when PAWC is reduced to 40mm. Treatments that lower the CLL and increase PAWC will likely help in seep management too, increasing the moisture required to refill the soil profile after harvest before deep drainage can occur.
Table 11. Deep ripping effect on 2017 lentil grain yields.
Ripping | Grain yield (t/ha) |
|---|---|
No | 0.67 |
Yes | 1.36 |
Lsd (0.05) | 0.09 |
Table 12. Chicken litter effect on 2017 lentil grain yields.
Chicken litter | Grain yield (t/ha) |
|---|---|
0 | 0.78 |
5 | 1.05 |
20 | 1.21 |
Lsd (0.05) | 0.11 |
Table 13. Annual fertiliser effect on 2017 lentil grain yields.
Annual fertiliser | Grain yield (t/ha) |
|---|---|
No | 1.09 |
Yes | 0.94 |
Lsd (0.05) | 0.09 |
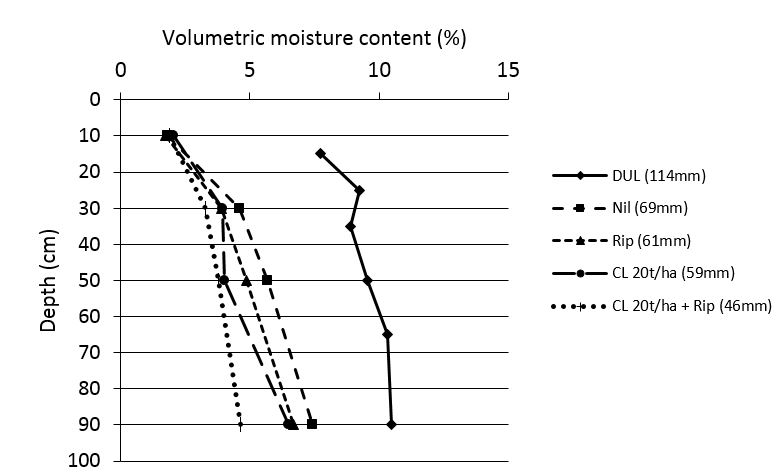
Figure 3. Trial site DUL and lentil CLL for selected treatments. Total mm of soil moisture represented by the line shown in brackets next to legend. DUL estimated from measurements at one wet up site adjacent to trial.
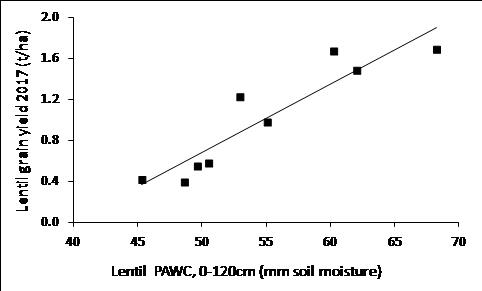
Figure 4. Lentil PAWC measured from 0-120cm post harvest in 2017 and grain yield where y = -0.067x - 2.66, R2 = 0.86.
Trial 2: Grain yield responses
Surface versus subsoil application
Grain yields for surface application of ameliorants were as similar, or better than comparative treatments with ameliorants placed in the subsoil (treatment 2 vs 3, treatment 6 vs 7, Table 7). In four of the six treatment by year comparisons, yields were not significantly different, and in two of six, yields were higher with surface applications. However, as mentioned earlier, in 2015 with no additional nutrition applied to the surface (as opposed to treatment 3), there was an advantage for subsoil application of chicken litter (treatment 10, Table 7). Delaying access to the chicken litter until the roots reached the banded rows in the subsoil, approximately six to eight weeks after sowing, had the effect of managing the canopy, reducing early moisture use and saving more for the grain filling period.
Chicken litter at 20t/ha versus matched synthetic fertiliser (NPKS)
Grain yields for subsoil applications of chicken litter and matched synthetic fertiliser were the same in all three years (treatment 3 versus 7, Table 7). For surface applications, there was no significant difference between them in cereal years, however there was a 0.86t/ha advantage in lentils for chicken litter at 20t/ha over matched synthetic fertiliser (treatment 2 versus 6, Table 7). Nutrient analysis of lentil whole tops (data not shown) shows P and K concentrations to be similar between these treatments, whereas a difference was observed in Trial 1 when comparing chicken litter at 20t/ha and commercial annual fertiliser (Table 8). However, as in Trial 1, the 20t/ha chicken litter treatments are higher in Mg and Mo.
Spading
Spading without any additional inputs produced yield increases compared with untreated in 2015 and 2017, but not in 2016 where it was severely constrained by nutrition (treatment 4 versus 1, Table 7). While not directly comparable with deep ripping in Trial 1, the yield responses are of similar order. That is 0.77t/ha, 0.14t/ha (not significant) and 0.95t/ha for spading in 2015, 2016 and 2017, respectively. For deep ripping with no nutrition in Trial 1, they were 0.99t/ha, 0.62t/ha (not significant) and 0.81t/ha for 2015, 2016 and 2017, respectively (treatment 5 versus 1, Table 6).
Spading in combination with chicken litter at 20t/ha, clay, deep ripping and applying a normal fertiliser practice (treatment 5) produced low yields in 2015 due to excess biomass production and a dry finish to the season. Whereas in 2016 it had high yields, however in neither season was it significantly different to the unspaded comparative treatment (treatment 5 versus 2, Table 7). In 2017, lentil yields were 0.39t/ha higher in the unspaded (treatment 2). Treatments combining spading with standard fertiliser practices or moderate rates of chicken litter are needed to better assess how spading would be implemented commercially.
Return on investment (ROI)
The unfertilised control generated a gross income of $1170/ha over three years in Trial 1. Annual fertiliser produced a ROI of 93% over the three years, where the N, P and S inputs and application were costed at $430/ha (treatment 2, Table 6). Given that annual fertiliser treatments are not increasing leaf tissue P and there was no response to S in a third trial (data not shown), it is likely that the application rates of these nutrients are much higher than necessary to achieve optimum yields. If the rates of these were reduced to replacement levels, then the cost of annual fertiliser over three years would be reduced to $308 per hectare. This would in turn increase the ROI for annual fertiliser to 163%.
Treatments achieving higher ROI were deep ripping treatments, either alone or combined with annual fertiliser or 5t/ha chicken litter (treatments 5, 6 and 13). Deep ripping alone had the highest ROI (1342%), which is driven by being the lowest cost treatment, but it does not generate the highest marginal return. The greatest marginal returns are produced by combining deep ripping with 5t/ha or 20t/ha chicken litter or annual fertiliser (treatment 6, 13, 14 and 20). Therefore, investment decisions for growers will depend on the available budget, with investment in deep ripping being highest priority followed by chicken litter or fertiliser.
Deep ripping combined with 5t/ha chicken litter produced the highest marginal return and ROI of 521%. However, there is still scope for improvement to this treatment by responding to the season. In the decile 9 growing season, 2016, barley yield for this treatment increased by 2.25t/ha from addition of fertiliser (treatment 13 vs 14, Table 6).
Deep ripping in combination with 20t/ha chicken litter produced the highest gross income, despite lower yields and poor grain quality in wheat in year 1 (treatments 21 to 24), but these treatments drop down the rankings in marginal return and ROI due to their high cost. However, based on trends to date, these treatments are expected to continue to deliver positive responses, and if so, the ROI for these treatments may improve over the longer term.
The addition of clay produced a low ROI as it is a high cost treatment and does not provide any significant yield responses.
Conclusion
Treatments of deep ripping and chicken litter applied in 2015 generated crop growth and yield responses for three consecutive seasons, and indicate opportunities for long term improvement of sandy soils, depending on soil constraints. The question still remains as to how long some of these treatment responses will last? Treatments combining deep ripping with surface applied nutrition (fertiliser or chicken litter) delivered the highest marginal returns, ranging from $934/ha to $1249/ha over three years. Depending on treatment cost, these delivered ROI ranging from 142% to 521%.
References
Blackwell P, Davies S & Isbister B, 2016. Identifying soil compaction, DAFWA website.
Acknowledgements
The research undertaken as part of this project is made possible by the significant contributions of growers through both trial cooperation and the support of the GRDC, the author would like to thank them for their continued support. Ongoing support has been provided by Northern and Yorke Landcare Project Community Capacity Component and SAGIT (TC116) and their contribution is gratefully acknowledged. Support is also gratefully acknowledged from Nigel Wilhelm and Peter Telfer (SARDI) and Max and Bill Trengove (cooperating land owners).
Contact details
Sam Trengove
samtrenny34@hotmail.com
0428 262 057
@TrengoveSam
GRDC Project Code: TRE00002,
Was this page helpful?
YOUR FEEDBACK