Image analysis of slugs and snails in broadacre agriculture
Author: John Moore, Svetlana Micic, Carlos Babativa Rodriguez, Alice Butler and Gerry Skinner. Department of Primary Industries and Regional Development, Albany | Date: 26 Feb 2018
Key messages
- At three widely separated sites the distribution of snails was sufficiently patchy to allow targeted controls.
- Mobile phone app technology might be able to be used in the future to map snail densities in a paddock.
- Applying this technique using snail baits as an example shows that costs could be reduced or more effective controls could be achieved.
- Mapping slugs was more challenging early in the year and required night time surveillance.
Background
Three snail species, small pointed snail (Prietocella barbara), white Italian snail (Theba pisana) and the vineyard snail (Cernuella virgata), were introduced by Europeans and are now present along the south coast of Western Australia. Two species of slugs, the black keeled (Milax gagates) and reticulated slug (Deroceras reticulatum) are found on heavier soil types in high rainfall areas.
Slugs and snails feed on emerging crops, with the potential to seriously damage canola (Micic et al. 2007). Snails also contaminate grain with loads rejected if numbers are above receival standards (CBH, 2017). Baiting is an expensive process with variable results due to factors such as snail habits and bait degradation (McDonald & Micic, 2017). Knowing where slugs and snails are located within a farm allows for targeted control or special treatment of infested areas.
Aims
To determine the potential of using smart phone apps, such as WheelCam and GrainCam attached to agricultural vehicles to map snail distributions and densities for targeted control.
Method
Image analysis of slugs and snails is a two-step process: image capture and image analysis.
Image capture
Small pointed snails (Prietocella barbara) were mapped at three locations along the South Coast at Mount Barker, Green Range and Gairdner using the WheelCam or GrainCam applications on smart phones. The WheelCam app instructs the smart phone to take a photo when the phone is aimed at the ground. Attaching it to a wheel on a header, autonomous rover or other vehicle reduces motion blur. Snail mapping was done using the WheelCam (see photos on top of page 4) attached to an autonomous rover at Gairdner, a header at Mt Barker and a spray ute or hand wheel at Green Range. At Gairdner the autonomous rover was set on a predefined path using Mission Planner.
Mission Planner is open source software Mission Planner used mainly for programming drones. In Mission Planner the area of interest is outlined using outside waypoints and then internal waypoints are generated within the area at set distances apart. The Gairdner area of interest was two hectares in size and mapped at 10 metre row spacings (Fig. 1). This information was then sent to the autonomous rover using a radio link and the rover followed this path using GPS.
NDVI maps were created using a multispectral camera on a quadcopter to investigate slug damage in an infested canola crop at Mount Barker.
Snail image analysis
After image capture is complete, images are downloaded from the smart phones. Images were then analysed manually, as well as being sent to Mapizy at the University of Western Australia to develop image analysis techniques. Once snail densities for each photo were known, maps were produced using AgLeader Spatial Management Software (SMS). Location and densities were read into the SMS creating points with densities which were colour coded. The points were then smoothed into contour maps by kriging using an automatic variogram with a three metre grid size. This produced a snail density map that was then used to create the bait prescription map.
Estimating snail densities
Snail densities from photos are currently being determined manually while image analysis techniques are being developed. However this will only identify snails that are visible in the photos. Ten snail counts using 0.1 m2 grids were taken across the site together with the top 0-2 cm of soil which was sieved to provide the below surface snail counts. These counts will be compared to the paired image counts to account for the unseen snails and determine the reliability of the techniques.
The GrainCam (Fig. 10) takes images from the bubble auger on the header during harvest. This has the advantage of only sampling live snails but may miss patches when the snails have not migrated up the stubble to harvest height. This was used at Mt Barker and Green Range but not at Gairdner.
Results
Gairdner (snails)
The WheelCam app allowed the smart phone to capture 611 usable images while it was attached to the autonomous rover (Fig. 1). Manual analysis of photos showed the highest number of snails in an image was 21 and the average number of snails per image was 0.87. When calibrated to get a measure of snails/m2 the average was 3.5 snails/m2. The snail counts from quadrats in densely infested areas produced an average of 140 snails/m2 for the surface counts and 150 snails/m2 for the below surface counts determined by sieving soil collected from 0.1 m2 quadrats.
When mapped in the SMS the following contour map was produced (Fig. 2). This contoured snail density map was then used to generate a snail bait prescription map using the rates of 0, 5 and 10 kg/ha (Fig. 3).
Out of the 2.09 hectares surveyed 0.51 ha was assigned high levels of control, 0.95 ha was assigned normal control and 0.63 ha was assigned no control.
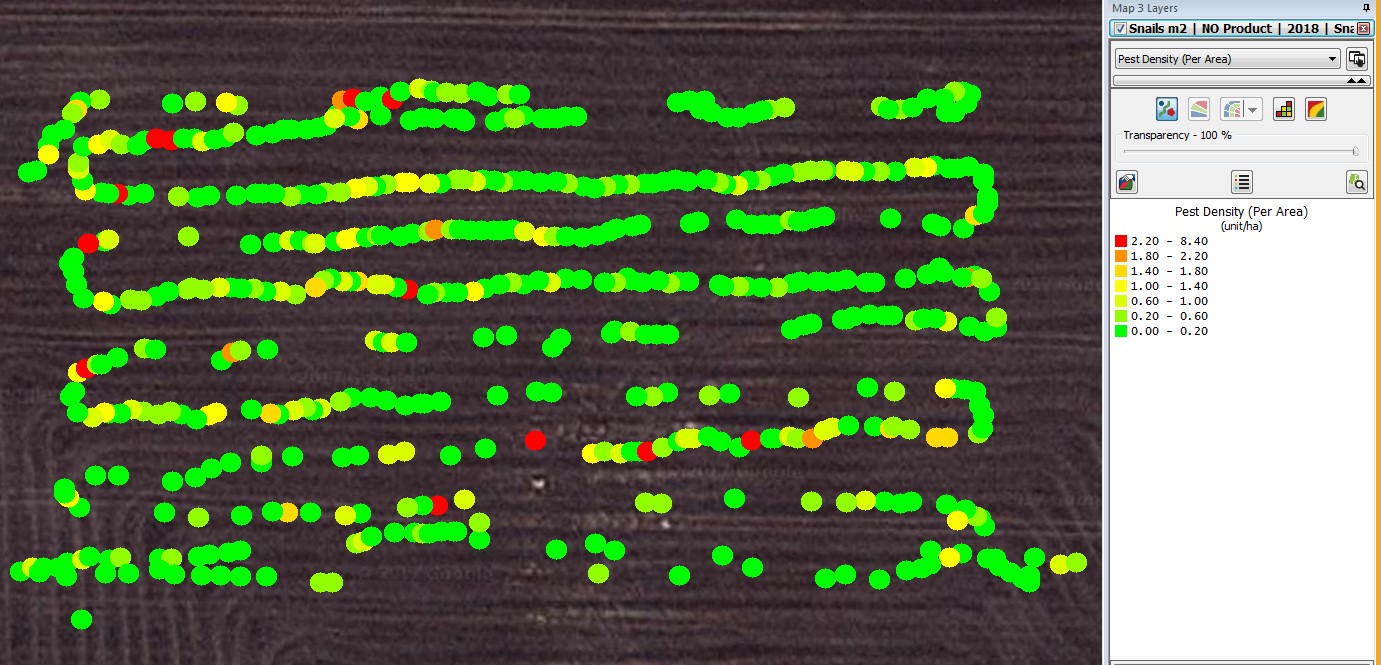
Figure 1. Locations of the WheelCam images at Gairdner and manually assessed densities.
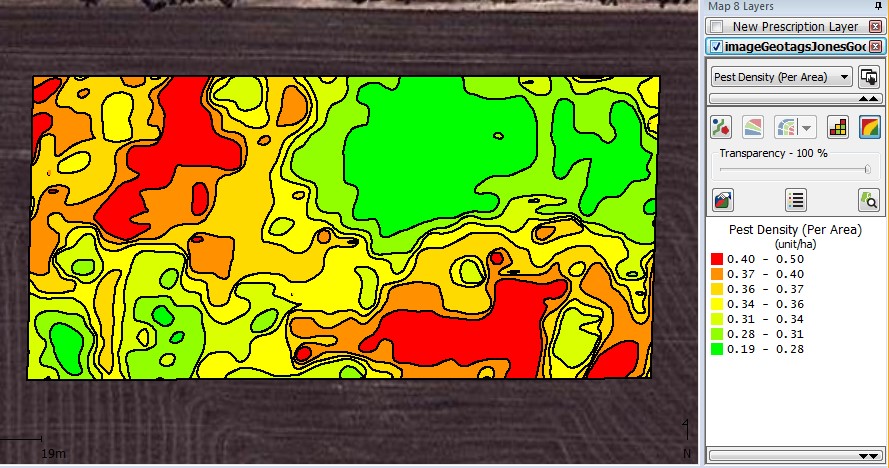
Figure 2. Contoured snail density map created by kriging using an automatic variogram at a three metre grid at Gairdner
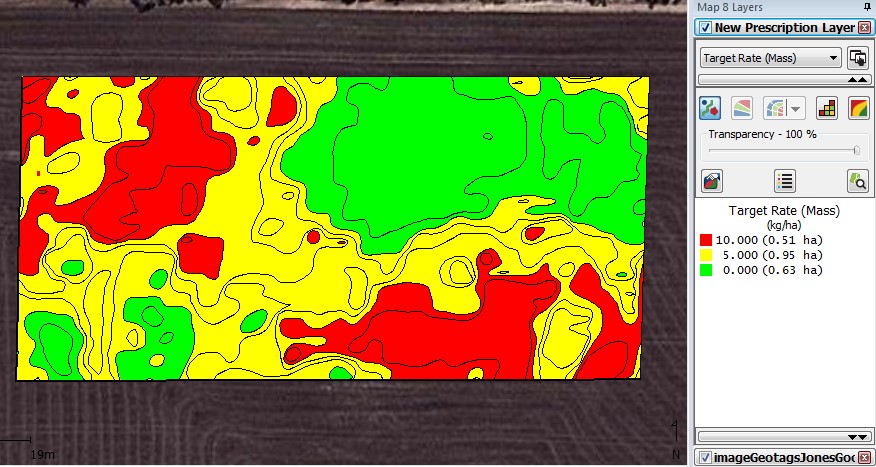
Figure 3. Snail control prescription map generated using the contoured snail density map with high levels of control defined by red, normal control by yellow and no control defined by green for the Gairdner
Mount Barker (snails)
At Mount Barker Research Station (MBRS) the GrainCam was used to conduct surveillance for small pointed snails on two paddocks (Fig. 4). On one paddock the WheelCam was also used to collect images of the ground during harvest and 54 physical one litre samples of approximately 800 g were taken about every two minutes during harvest. These samples were brought back to the laboratory and the number of snails in each sample was counted and another set of GrainCam images taken of the samples.
The snail counts were overlaid onto a Google map using the SMS (Fig. 5). On this paddock, 13.74 ha were surveyed and 3.4 ha had high levels of snails, 3.45 ha had moderate levels of snails and 6.89 ha had no snails in the samples or images. This was then allocated the control levels shown in figure 6.
At MBRS the number of live snails will be determined by image analysis of the GrainCam images and verified by counts in the physical samples and data from the WheelCam. This will compare live snails, from the GrainCam, with the total number of snail shells on the ground taken by the WheelCam. The correlation between the various methods will determine whether the easy to use and inexpensive WheelCam will provide an adequate estimate of the density of snails being recorded at harvest compared to the more expensive GrainCam.
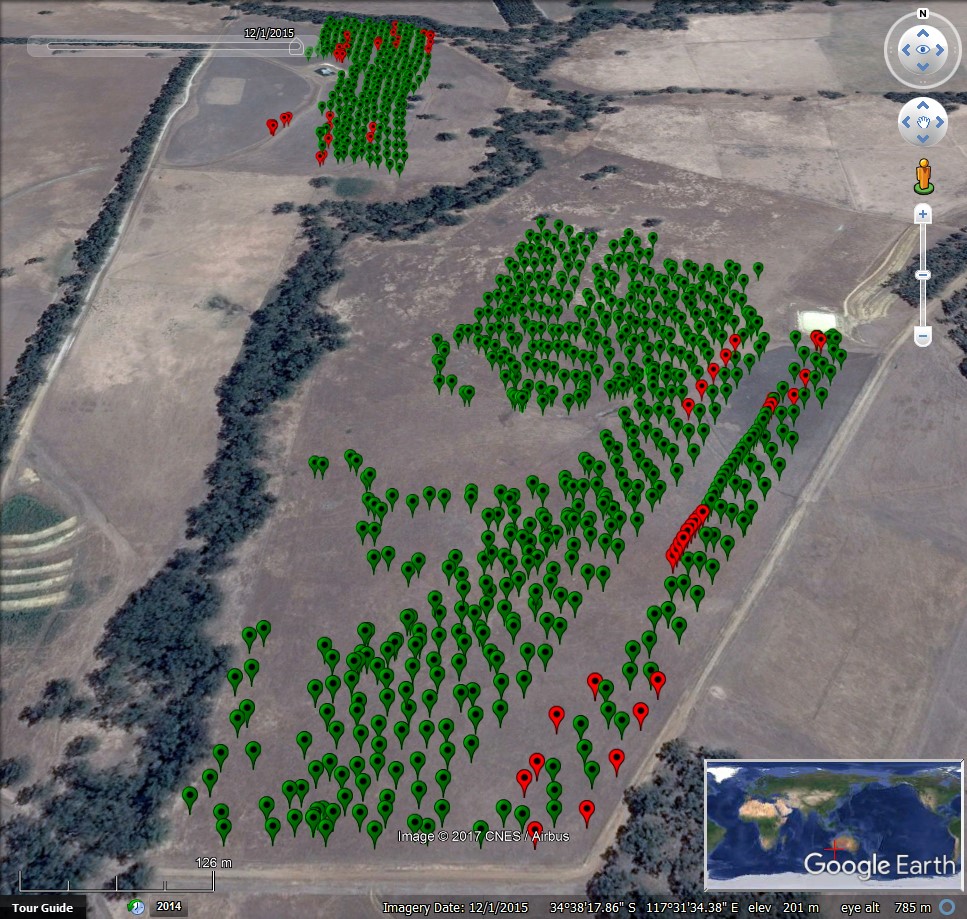
Figure 4. Locations of WheelCam images at Mt. Barker (red markers indicate images that were unsuitable for image analysis).
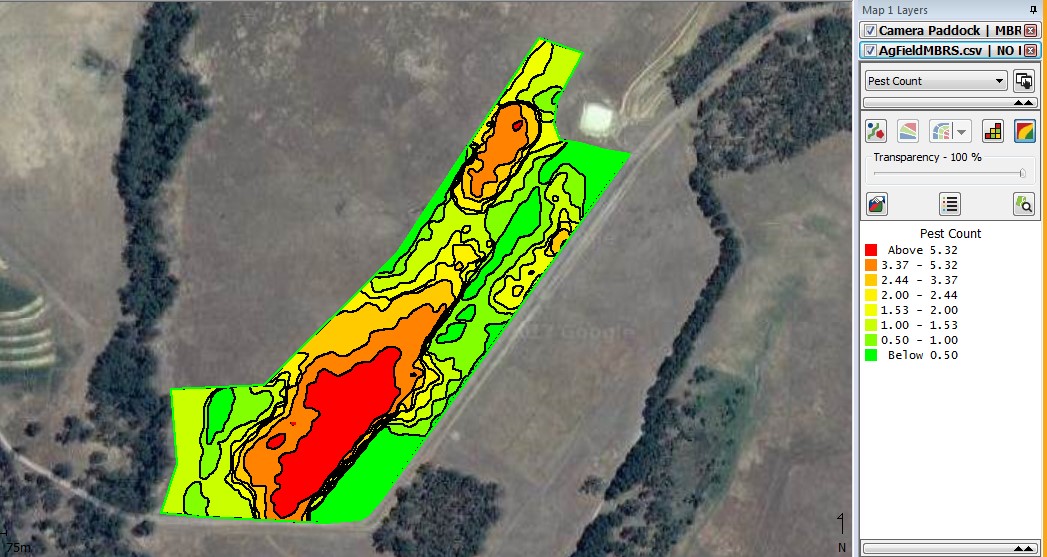
Figure 5. Contoured snail density map created by kriging using an automatic variogram at a three metre grid at Mt Barker from snail counts in grain samples.
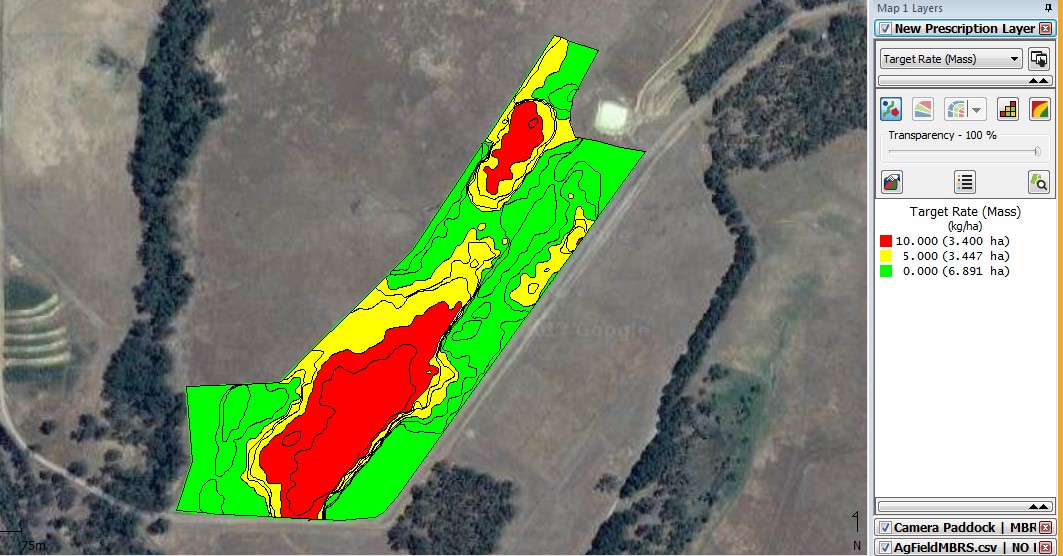
Figure 6. Snail control prescription map generated using the contoured snail density map with high levels of control defined by red, normal control by yellow and no control defined by green for the Mt Barker site.
Mt Barker (slugs)
NDVI imagery of a slug infested area of a seedling canola crop at Mt. Barker clearly shows the lack of canola growth (see Fig. 7). Ground truthing indicated that slugs were the cause of crop loss and affected about a third of the area. The horizontal orange bands in the figure are the previous season’s stubble rows where slugs were harbouring over summer and then moved out into the adjoining crop in autumn. The vertical green band corresponds with good canola growth and correlates with the area that was protected by baiting.
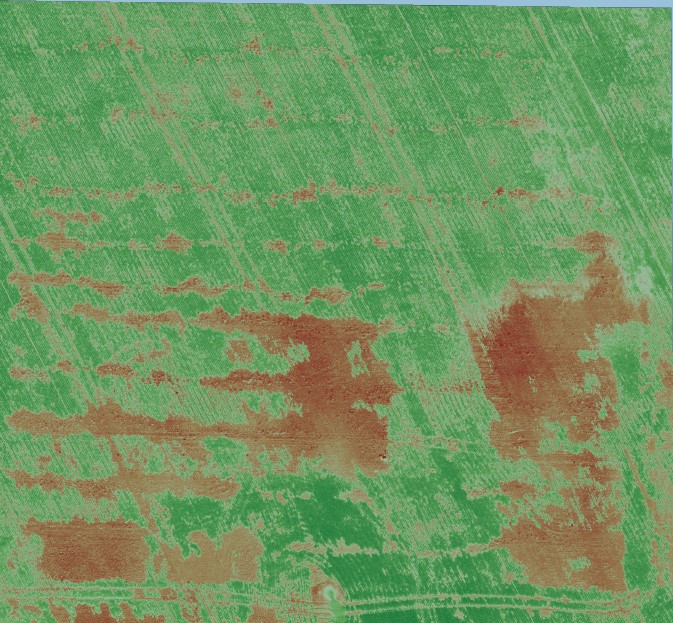
Figure 7. NDVI image of a canola crop affected by slugs (green areas are good canola growth and the orange areas are bare ground).
Conclusion
Understanding the density of snails across a paddock allows growers to target their control more effectively. At Gairdner, if the grower was using metaldehyde baits that cost $1.54 per kg (Moore and Moore, 2017) and the paddock was spread at five kg per hectare the total cost for the two ha’s would be $15.40. However using the prescription map the grower could apply a single application on the medium density areas and apply two applications on the high density areas which would be slightly cheaper but provide enhanced control.
Alternatively, as a second strategy, they could apply the minimum label rate of 5 kg/ha on the 0.95 ha that was moderately infested and the maximum label rates of 7.5 kg/ha on the 0.51 ha that was heavily infested. This would result in both better snail control and a saving of $2.90/ha.
At Mt. Barker if similar strategies were applied there would be greater savings due to larger areas with no detected snails. The second strategy of applying baits at label rates gave a net saving of $10.60/ha with the advantage of better overall snail control.
Thus over two widely separated sites, where snail densities were high, significant savings could be made and greater savings are expected on paddocks with lower levels of infestation or more aggregated infestation within smaller areas.
More importantly this technology allows growers to conduct easy surveillance on paddocks that are thought to be clean as it will pick up small patches that can be treated before they spread to levels where the infestation is obvious or costly.
Slugs are challenging to effectively map because they tend to be active at night and the NDVI mapping in this case was too late to save the crop. Earlier surveillance or night monitoring using the autonomous rover may be more effective.
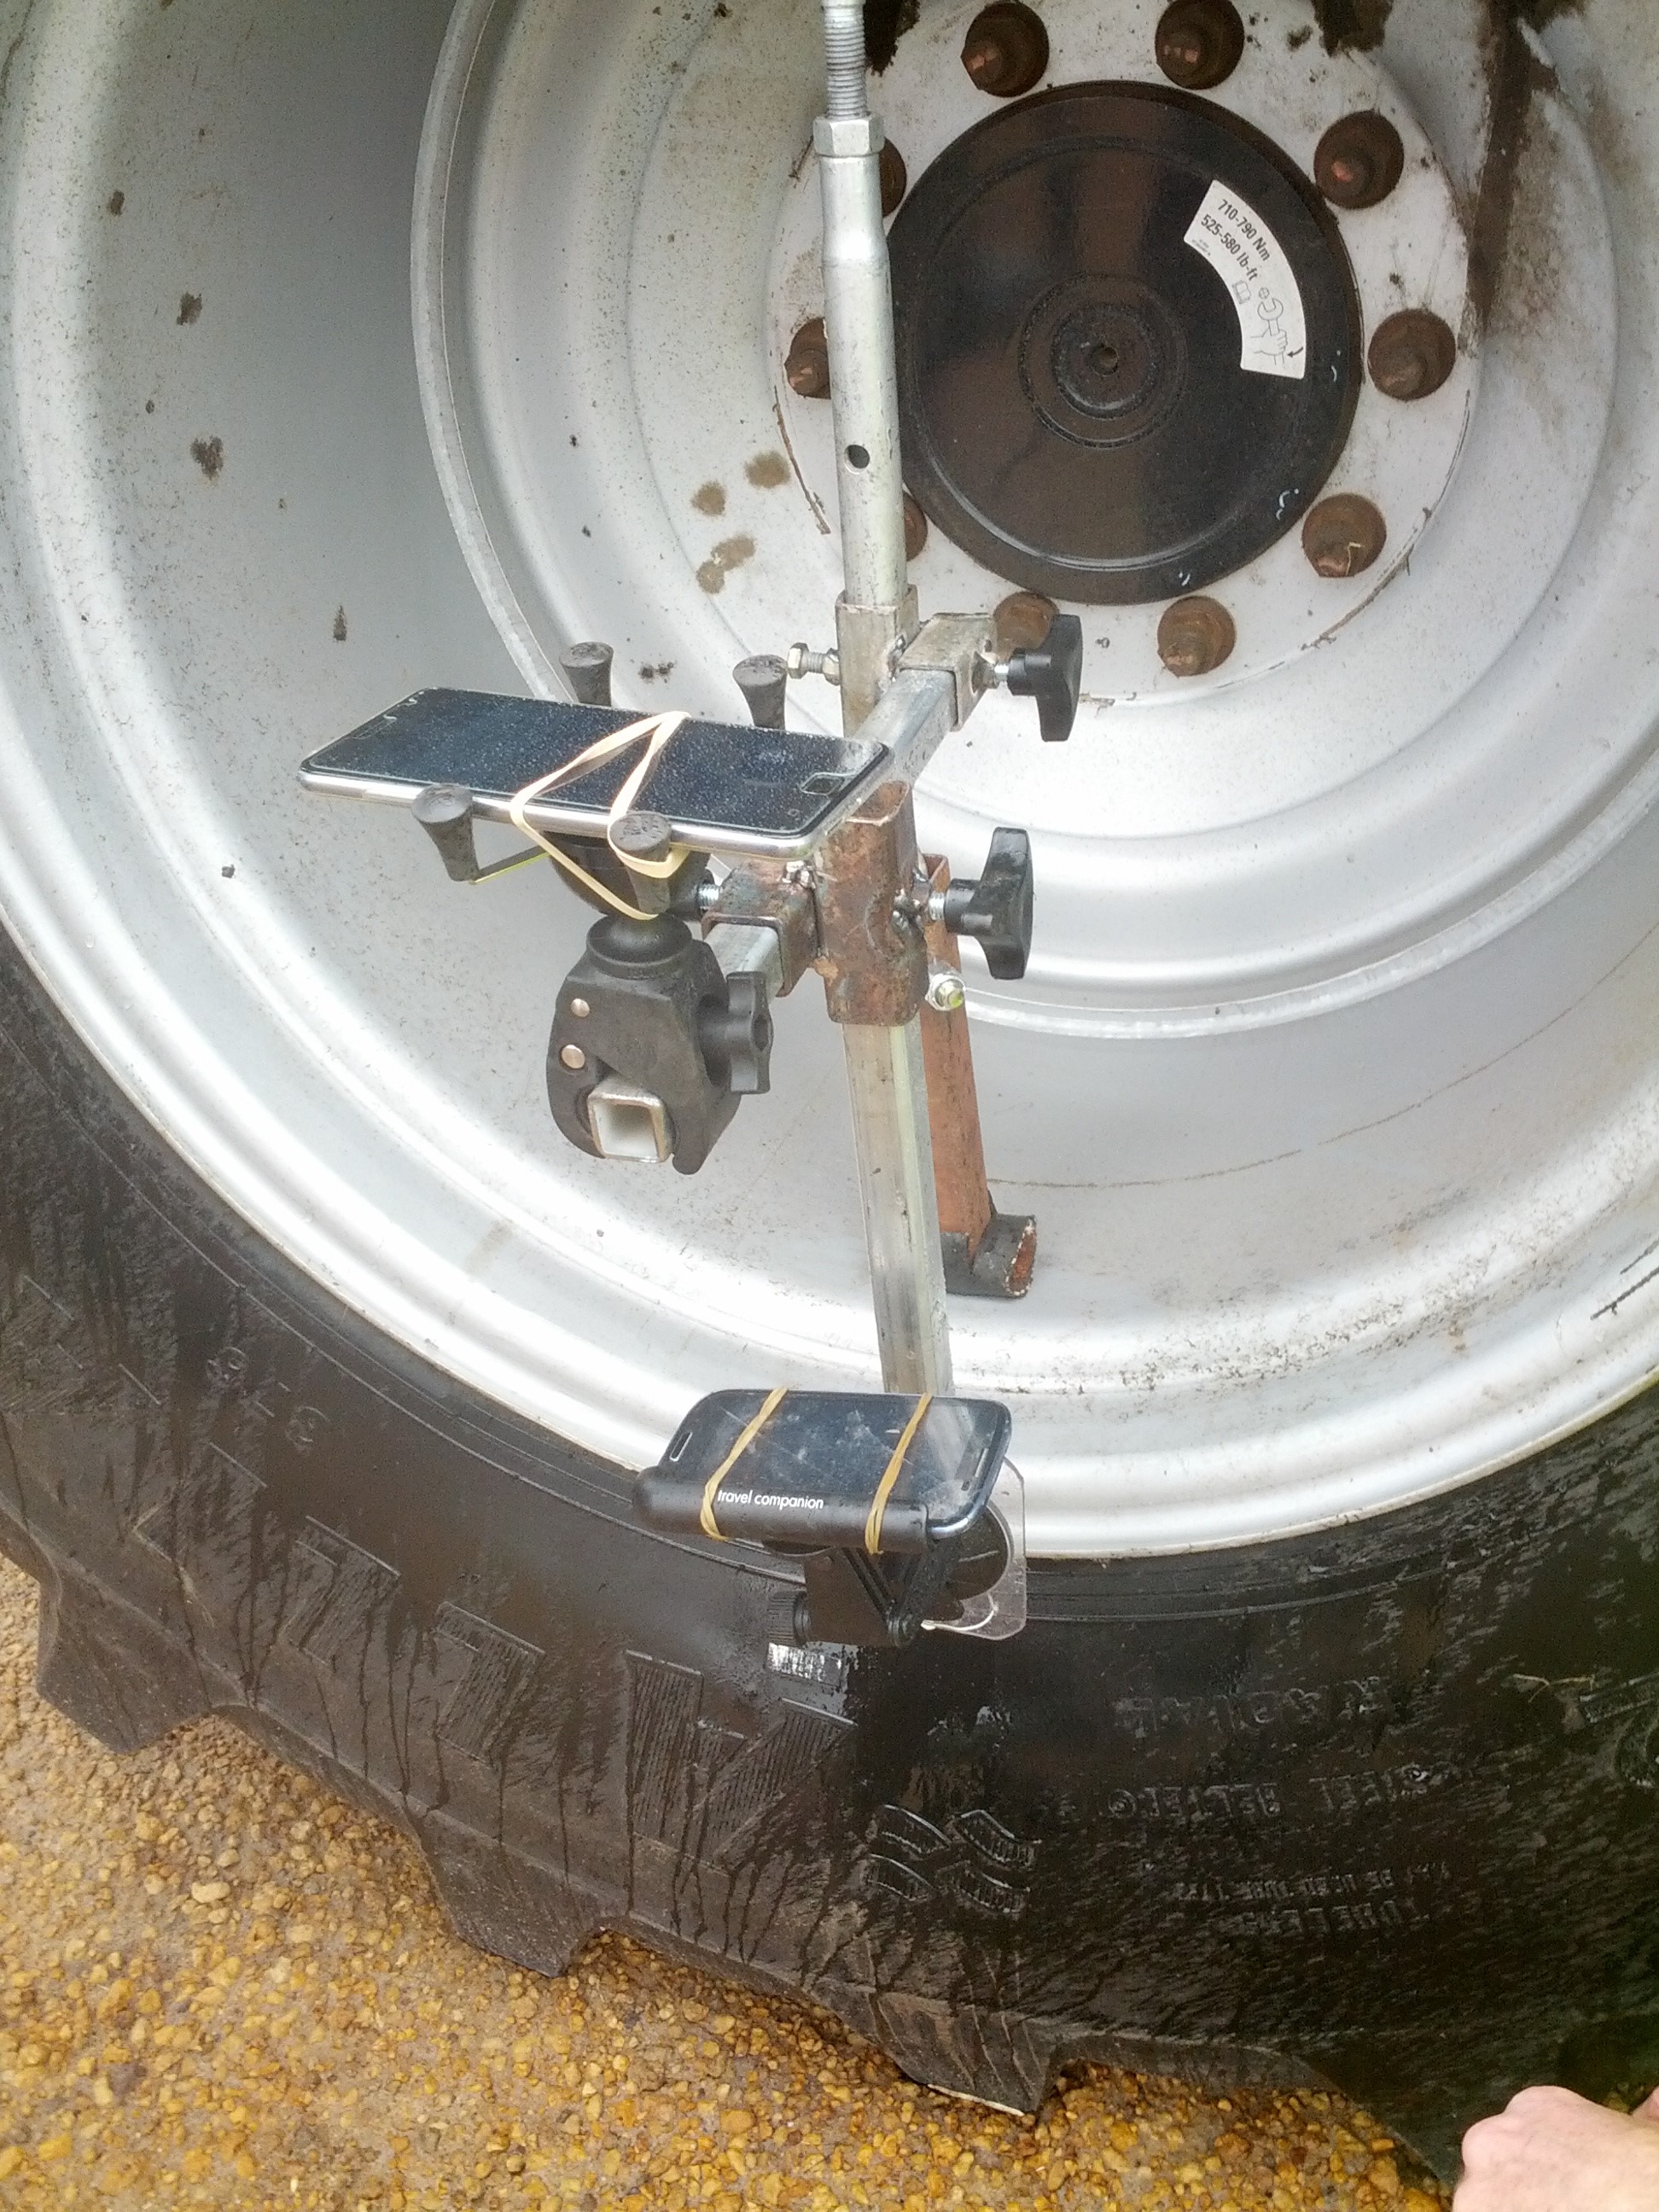
Figure 8. The WheelCam attached to a Case header.
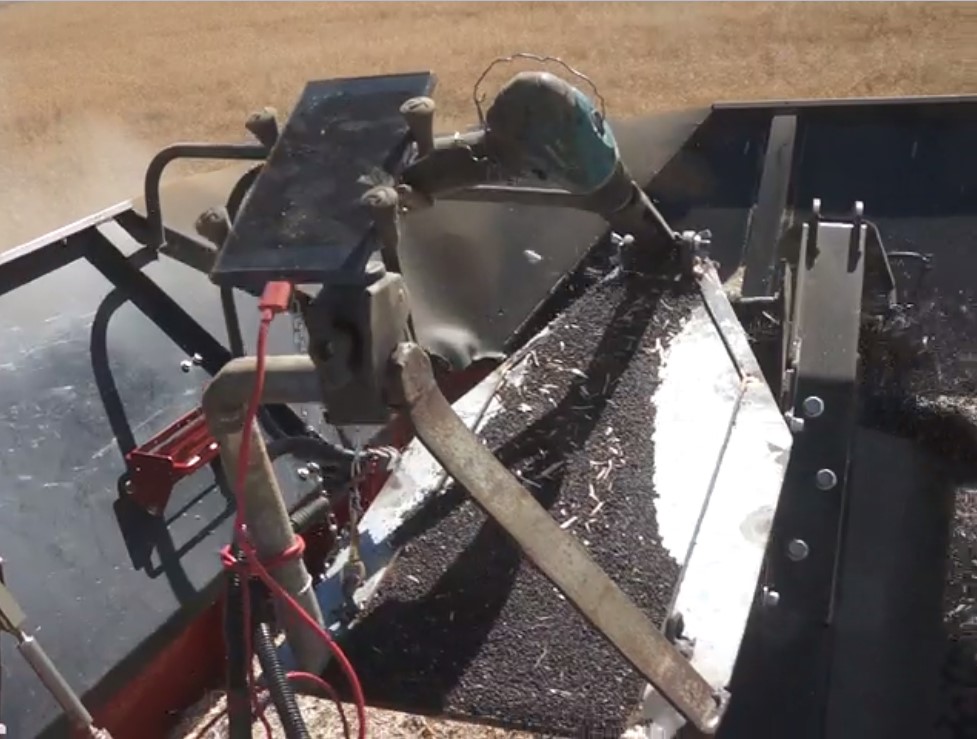
Figure 9. The GrainCam attached to the bubble auger.
Acknowledgments
We would like to acknowledge Boosting Grains R&D for supplying the majority of funding for this work; Invasive Species directorate of DPIRD for use of equipment; Growers including Scott Smith and Alex Jones provided valuable input and the use of their machinery and land together with various members of the Stirlings to Coast Farmers Inc.
Paper referee: D. Severtson
Project Numbers: DPIRD Boosting Grains FFPj01-2315966 Improving the efficiencies of slug and snail control; DAW00256 Building crop protection and production agronomy R&D capacity in regional Western Australia.
References
CBH. (2017, September 5). Retrieved January 17, 2018, from Grains Industry Western Australia (GIWA): 2017+2018+CBH+Public+Receival+Standards+WA+as+at+October+2017.pdf
McDonald, K., & Micic, S. (2017). Snail Management Guide for WA Farmers. Albany: Stirlings to Coast Farmers.
Micic, S., Henry, K., & Horne, P. (2007). Identification and control of pest slugs and snails for broadacre crops in Western Australia. Perth: Department of Agriculture and Food, Western Australia. Bulletin 4713.
Moore C.B., & Moore J.H. (2017) HerbiGuide - The Pesticide Expert on a Disk. Version. 31.0, (PO Box 44, Albany, Western Australia, 6331, HerbiGuide).
GRDC Project Code: DAW00256,
Was this page helpful?
YOUR FEEDBACK
