The impact of wheat residue on air temperature in the canopy and phenology of chickpea in 2017
Author: Andrew Verrell, Kathi Hertel, Brooke McAlister and Matthew Grinter (NSW Department of Primary Industries) | Date: 27 Mar 2018
Call to action / take home messages
- Surface wheat residue increases the incidence and severity of radiant frosts.
- The average minimum surface temperature declines by -0.100C/ tonne of residue.
- High residue loads can change the thermal profile of the crop and lead to delays in the onset of flowering, podding and maturity in chickpeas.
- Inter-row sowing into standing residue (>30cm) led to less frosts and higher minimum temperatures in chickpeas.
- Some chilling tolerant chickpea lines flowered 3 to 11 days earlier than PBA HatTrick but this did not translate into earlier 1st pod dates.
Introduction
Chickpea productivity in the northern grains region (NGR) is constrained by several abiotic stresses (Whish et al. 2007) and temperature is one of the most important determinants of crop growth over a range of environments (Summerfield et al. 1980) and may limit chickpea yield (Basu et al. 2009).
The potential evaporative demand for water usually exceeds the water available to the crop and represents the greatest limitation to crop production in the northern grains region (NGR). Low-disturbance direct seeding into standing or flattened cereal stubble is the most effective practice to reduce the impact of water stress on chickpea crops. However, surface residues can cause an increase in radiant frost risk and may also affect the micro-climate of the crop canopy, with impact on floral initiation, pod set and seed development.
The impact of surface residue on air temperature in the canopy, phenology, biomass and grain yield of chickpea was explored in a series of experiments across the NGR in 2017.
Stubble effects on soil and air temperature
During the day, stubble reflects solar radiation. A bare, darker soil absorbs more solar radiation than a stubble-covered soil and warms up more readily. The stubble also acts as insulation as it contains a lot of air which is a poor conductor of heat. Finally, the stubble affects the moisture content of the soil. It takes more heat to warm up moist, stubble covered soil than dry, bare soil.
This causes soil temperature of a bare soil to be higher than stubble covered soil during the day (especially in the afternoon). At night, however, the bare soil loses more heat than stubble covered soil due to the lack of insulation (the air-filled stubble being a poorer heat conductor). This is especially noticeable when skies are clear. The air above the bare soil is therefore warmer during the night than the stubble covered soil, while the soil temperature differences become negligible. Therefore stubble cover may lead to a higher incidence of frost than bare soil.
Methods
A range of experiments were conducted at Rowena and Tamworth in 2017 (Table 1).
Table 1. Experiments, treatments and locations for 2017
Experiment | Tamworth | Rowena |
|---|---|---|
Row orientation | North - South | East - West |
Stubble loading | 0, 3, 6, 12, 24 t/ha residue | 0, 3, 6, 9, 12 t/ha residue |
Stubble height | 0, 10, 30, 50 cm | 0, 5, 10, 17 cm |
Chilling tolerance | Plus and minus residue | Plus and minus residue |
Genotype screening | Plus and minus residue |
|
In all of the stubble experiments, treatments were not invoked until just prior to sowing. This ensured there was no treatment effect on soil stored water at sowing. In the stubble loading experiments, residue was removed, bulked and weighed into treatment amounts and re-applied to the plots immediately post-sowing. In the stubble height experiments, treatments were cut using a small plot header the day before sowing. Stubble was stripped and captured at the back of the header for removal.
In all experiments, tiny tag temperature data loggers were used in selected treatments and plots. Sensors were placed at 0cm and 50cm above ground in-crop. Temperature was logged at 15minute intervals. Another Tiny Tag sensor was placed outside the crop area at 150cm above the ground to record ambient temperature at similar time intervals.
Detailed phenology was recorded on a daily basis. At physiological maturity, whole plant samples were taken for detailed plant component analysis and whole plots were harvested for grain yield.
Results
The 2017 growing season
The 2017 growing season has been one of the most difficult and extreme on record equivalent to the 1994 and 1982 seasons with record frost events and below average in-crop rain.
The Rowena site failed due to lack of soil moisture exacerbated by the high frost incidence. Nothing was recoverable. Table 2 shows the long term average (LTA) monthly rainfall and minimum screen temperatures and the monthly rainfall and average minimum temperature for Tamworth in 2016 and 2017.
Table 2. Long term average (LTA) monthly rainfall and minimum temperature and monthly
rainfall and mean minimum temperature for 2016 and 2017 at Tamworth
Statistic | Jan | Feb | Mar | Apr | May | Jun | Jul | Aug | Sep | Oct | Nov | Dec |
|---|---|---|---|---|---|---|---|---|---|---|---|---|
Rainfall 2017 mm | 125 | 19 | 124 | 22 | 61 | 49 | 20 | 21 | 10 | 90 | 64 | 39 |
Rainfall 2016 mm | 100 | 1 | 22 | 5 | 61 | 169 | 29 | 83 | 133 | 76 | 12 | 97 |
LTA rainfall mm | 85 | 67 | 49 | 42 | 44 | 49 | 46 | 46 | 48 | 58 | 66 | 72 |
Mean Min 2017 (°C) | 19.6 | 18.5 | 15.3 | 9.2 | 6.3 | 3.5 | -0.1 | 1.2 | 4.5 | 11.4 | 11.9 | 16.5 |
Mean Min 2016 (°C) | 17.0 | 16.1 | 15.7 | 12.2 | 6.6 | 6.1 | 3.7 | 3.2 | 7.2 | 7.1 | 10.1 | 16.9 |
LTA min temp (°C) | 17.4 | 17.1 | 14.8 | 10.6 | 6.7 | 4.1 | 2.9 | 3.7 | 6.1 | 9.9 | 13.1 | 16.0 |
Rainfall leading into the 2017 growing season was on par for the LTA, but July-September was below the cumulative LTA by 88mm. Rainfall in October saved these crops and resulted in average yields (Table 2).
The mean minimum temperatures started to dip below the LTA from April right through to September, with mean minimums for July, August and September being, -3.05, -2.52 and -1.580C colder than the LTA, respectively. The frost incidence at Tamworth in 2017 was unprecedented, with 49 screen frosts compared to 22 in 2016. Rowena experienced 26 screen frosts up to the 1st week in September when the crop failed.
At Tamworth, the extreme weather events led to complete death of ALL field pea blocks. This was through frost events followed by a wipe out due to bacterial blight infection.
Elevation and air temperature
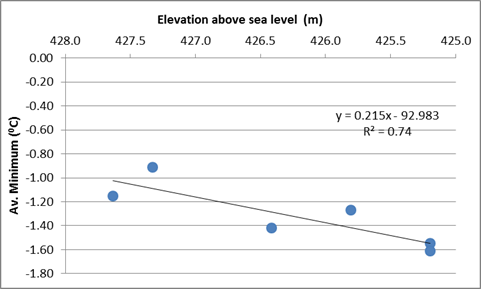
Figure 1 shows the effect of slope on average minimum air temperature at ground level at the Tamworth site. Minimum temperature declined by - 0.220C per m drop in elevation measured on bare soil.

Figure 1. Effect of slope on average minimum temperature (7/7 – 8/8/2017) at ground level at the Tamworth Agricultural Institute (TAI)
Stubble loading effects on in-crop temperature
The effect of different amounts of wheat residue, flat on the ground, and its impact on the temperature profile of different pulse species was examined.
Table 3 shows the effect of residue loading on minimum temperature at the residue surface in chickpea at TAI.
The bare soil surface was on average, -1.00C colder than the minimum screen temperature. Both the average minimum and absolute minimum declined as the amount of surface residue increased, with the high residue loading (24 t/ha) -1.40C colder on average than bare soil. Frost incidence was similar across all residue level loadings, but there were 5 more ground frosts recorded compared to the screen temperature. The absolute minimum decreased with increasing residue load, with the high residue treatment reaching -7.50C compared to -6.40C on bare soil (see Table 3).
Table 3. The average minimum, absolute minimum and number of frosts (<00C) for a range of stubble loadings at the residue surface in chickpea compared to the screen temperatures
at TAI (7th July to 8th August).
Residue loading | ||||||
|---|---|---|---|---|---|---|
Screen | Bare soil | 3 tonne | 6 tonne | 12 tonne | 24 tonne | |
Av. Min | 0.5 | -1.5 | -1.9 | -2.1 | -2.2 | -2.9 |
Abs. Min | -5.2 | -6.4 | -6.7 | -6.9 | -6.9 | -7.5 |
No. Frosts | 20 | 25 | 25 | 25 | 25 | 26 |
Table 4 contains data from the Rowena site prior to it succumbing to terminal drought. The temperature response to residue loading is the same here as at TAI. Average minimum temperature declined with increasing residue load, with a -1.20C difference between bare soil and 12 t/ha of residue.
Table 4. The average maximum and minimum, absolute minimum and number of frosts (<00C) for a range of stubble loadings at the residue surface in chickpea at Rowena (1st June to 10th August).
0 tonne | 3 tonne | 6 tonne | 9 tonne | 12 tonne | |
|---|---|---|---|---|---|
Av. Max | 10.3 | 10.5 | 10.4 | 10.4 | 10.3 |
Av. Min | 0.4 | 0.1 | -0.3 | -0.4 | -0.8 |
Abs. Min | -6.5 | -7.2 | -7.9 | -7.6 | -8.9 |
No. frosts | 36 | 42 | 42 | 43 | 43 |
At Rowena, frost incidence rose with the addition of residue compared to bare soil, but was similar across residue loading treatments. Maximum temperatures did not vary across treatments.
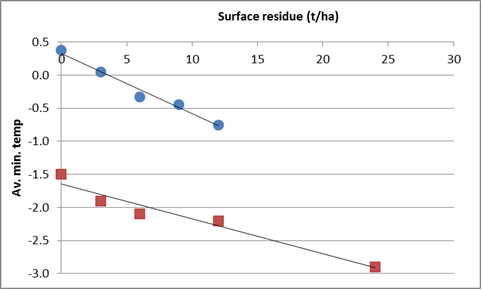
Figure 2 shows the linear relationship between residue loading and average minimum surface temperature in chickpea.

Figure 2. The effect of surface residue loading on average minimum temperature at the residue surface at Rowena (●) and TAI (■) in the chickpea crop
Both responses are linear but the steeper slope at Rowena would suggest that residue amount had a more significant impact on minimum temperature and frosting in 2017 than at TAI. Minimum temperature declined by -0.10 and -0.05 0C, per tonne of residue at Rowena and TAI, respectively.
Stubble height effects on in-crop temperature
Table 5 shows the effect of stubble height on temperature parameters at the soil surface on inter-row sown chickpea at TAI.
Table 5. The effect of residue height on absolute and average maximum and minimum temperature and number of frosts in chickpea at the soil surface at TAI (7th July to 20th September)
Parameter | Bare soil | 10cm | 30cm | 50cm |
|---|---|---|---|---|
Abs. Max | 37.1 | 37.0 | 36.7 | 35.0 |
Av Max | 25.5 | 25.3 | 24.9 | 23.5 |
Av Min | -0.8 | -0.7 | 0.2 | 0.0 |
Abs. Min | -5.6 | -5.4 | -4.3 | -4.9 |
No. frosts | 51 | 51 | 41 | 42 |
There was no change in temperature parameters between the bare soil and 10cm high residue. Changes started occurring once residue reached 30cm high, with the average and absolute minimums rising 0.40C and 1.30C, respectively. There were 10 less frosts in the 30 and 50cm high residue treatments compared to bare soil. Average and absolute maximums were 2.00C cooler in the tall 50cm stubble treatment compared to bare soil (see table 5).
Stubble loading effects on phenology
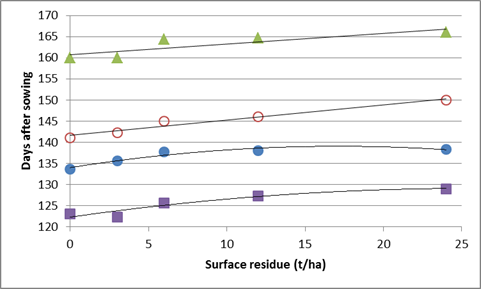
The effect of surface residue loading on the time taken, recorded as days after sowing (DAS), to reach 20% flower, 1st pod, 50% pod and flowering cessation are shown in figure 3.

Figure 3. The effect of surface residue loading on the time taken (days after sowing) to reach
20% flower (■), 1st pod (●), 50% pod (○) and flowering cessation (∆).
Across all parameters the time taken to reach these increased with increasing residue load on the surface. This effect was even more pronounced for 50% pod set and development and flowering cessation (Figure 3).
Assessment of chilling tolerant lines
Table 6 contains phenology data for selected lines from the chilling tolerance experiment at TAI.
Table 6. The effect of surface residue treatment on the time taken (days after sowing) to reach 1st flower, 50% flower and 1st pod for selected genotypes
Stubble |
Variety | Days after sowing | ||
|---|---|---|---|---|
1st Flower | 50% Flower | 1st Pod | ||
Bare | CICA-1521 | 101 | 124 | 132 |
Flat residue | CICA-1521 | 104 | 126 | 132 |
Bare | PBA HatTrick | 110 | 126 | 132 |
Flat residue | PBA HatTrick | 115 | 126 | 137 |
Bare | CT-3 | 97 | 126 | 132 |
Flat residue | CT-3 | 118 | 129 | 137 |
In the bare soil treatment, genotypes reached 1st flower 3 to 11 days earlier than in the flat residue treatments. The residue treatments delayed 50% flowering in the numbered lines, but not in PBA HatTrick, while the bare soil treatments led to earlier 1st podding. CICA1521, a fixed line, is substantially earlier at flowering than PBA HatTrick, but similar in time to 1st pod set. CT-3 is a new line with enhanced chilling tolerance which is evident from its earlier time to 1st flowering, but this didn’t translate into earlier pod set when compared to PBA HatTrick .
Conclusion
The 2017 season was unprecedented with record frost events coupled with below average in crop rainfall. The severe weather conditions led to the complete death of the field pea blocks at TAI, due to frost and bacterial blight. Terminal drought led to the eventual loss of the Rowena site.
The slope of cropping country can contribute to spatial variability in soil surface temperatures, with minimum temperatures declining by - 0.220C per m drop in elevation measured on bare soil.
Surface residue loading increased the severity of radiant frosts which impacted on all species. Field peas are the most susceptible, while faba bean and chickpea can tolerate some vegetative frosting. The number of frosts increased with residue loading, while the average minimum surface temperature declined by -0.10 0C, per tonne of residue.
Standing stubble led to changes in air temperature at the inter-row soil surface. There was no difference in temperature parameters between bare soil and 10cm high residue. Once residue was above 30cm average, absolute minimums rose by 0.4 to 1.30C and there were fewer frosts. Maximum temperatures were cooler by up to 2.00C.
Numbered lines assessed for chilling tolerance showed that they could flower 3 to 11 days earlier than PBA HatTrick, but this did not translate into earlier pod set. Post-harvest assessment will determine whether earlier flowering has led to more viable flowering and podding sites compared to PBA HatTrick.
In all cases, sowing chickpeas between standing wheat residue gave equivalent grain yield outcomes to the bare soil treatment.
This remains the preferred strategy to maximise fallow efficiency and grain yield.
Acknowledgements
The research undertaken as part of project DAN00965 is made possible by the significant contributions of growers through both trial cooperation and the support of the GRDC, the author would like to thank them for their continued support. Thanks to Michael Nowland and Peter Sanson, (NSW DPI) for their assistance in the experimental program.
References
Basu PS, Ali M, Chaturvedi SK (2009) Terminal heat stress adversely affects chickpea productivity in Northern India – Strategies to improve thermotolerance in the crop under climate change. In ‘ISPRS Archives XXXVIII-8/W3 Workshop Proceedings: Impact of Climate Change on Agriculture’. 23–25 February, New Delhi, India. (Eds S Panigrahy, SR Shankar, JS Parihar) pp. 189–193. (International society for Photogrammetry and Remote Sensing, India)
Summerfield RJ, Minchin FR, Roberts EH, Hadley P (1980) The effects of photoperiod and air temperature on growth and yield of chickpea (Cicer arietinum L.). In ‘Proceedings of International Workshop on Chickpea Improvement’. 28 Feb. –2 March 1979, The International Crops Research Institute for the Semi-Arid Tropics, Patancheru, AP, India. (EdsJMGreen, YLNene, JB Smithson) pp. 121 –149. (ICRISAT Publishing: Hyderabad, India)
Whish JPM, Castor P, Carberry PS (2007) Managing production constraints to the reliability of chickpea (Cicer arietinum L.) within marginal areas of the northern grains region of Australia. AJAR, 2007, 58, 396-405.
Contact details
Dr Andrew Verrell
NSW Department Primary Industries
Mb: 0429 422 150
Email: andrew.verrell@dpi.nsw.gov.au
Varieties displaying this symbol beside them are protected under the Plant Breeders Rights Act 1994
GRDC Project Code: DAN00965,
Was this page helpful?
YOUR FEEDBACK
