Understanding drivers of phenology to increase grain yield of wheat
Author: Felicity Harris (NSW DPI, Wagga Wagga), Rick Graham (NSW DPI, Tamworth), Greg Brooke (NSW DPI, Trangie) and Darren Aisthorpe (QDAF, Emerald) | Date: 27 Feb 2018
Take home messages
- Variation in phenology had a significant effect on the grain yield potential of wheat varieties in response to sowing date across growing environments of the northern grains region (NGR).
- The variation in phenology of genotypes is largely due to interactions between genetic responses to vernalisation and photoperiod and growing environment, which determines genotype adaptation.
- High grain yields can be achieved from a range of genotype x sowing date combinations; however there is variation in genotype responses across environments of the NGR.
- Whilst flowering time is important in maximising grain yield potential, pre-flowering phases can have a significant influence on grain yield.
Background
There are a range of commercial cultivars suited for sowing across the northern grains region (NGR), which vary in phenology from slow developing winter types to fast developing spring types, providing growers with flexibility in their sowing window. The adaptation and yield potential of wheat is dependent on matching phenology and sowing time of varieties to ensure flowering and grain formation occurs at an optimal time. In most environments, this is defined by decreasing frost risk, and increasing water and heat stress. The optimal flowering time varies across environments of the NGR, therefore providing growers with an understanding of the drivers of phenology will enable them to tailor suitable combinations of genotype and sowing date to minimise exposure to abiotic stresses and achieve maximum grain yield.
This paper discusses the influence of phenology on yield responses to sowing time for wheat genotypes across five environments of the northern grains region (NGR). These results are part of a project aimed at optimising grain yield potential in the NGR co-invested by GRDC and NSW DPI under the Grains Agronomy and Pathology Partnership (GAPP).
Phasic development of wheat
The grain yield of wheat is determined by three main components: spike density, grains per spike and individual grain weight. The timing and duration of development phases in wheat is directly related to the formation of specific grain yield components and overall grain yield. During early vegetative development, leaves and tillers are initiated (spike density), prior to the transition to the reproductive stage, when spikelet development commences. Spike growth and differentiation continues in conjunction with stem elongation up until flowering (grains per spike). After flowering, and during the grain filling phase, the embryo develops, producing a viable seed; this coincides with the establishment of grain weight.
Phasic development in wheat is primarily controlled through varied responses to vernalisation (Vrn) and photoperiod (Ppd) genes. Generally, accumulated temperature accelerates development of all phases, whilst there is an additional effect of vernalisation in some genotypes. Genotypes responsive to vernalisation require a period of cold temperatures to progress from vegetative to reproductive development. Vernalisation accumulates most rapidly in the range 3-10°C, but can accumulate at a slower rate up to 17°C. The direct influence of vernalisation is to alter the length of the vegetative phase, however it can also indirectly affect the duration of subsequent phases. Wheat is a long-day plant; therefore the rate of development is increased with longer day-lengths. However, individual genotypes of current commercial varieties have varying levels of responsiveness to photoperiod, and a large number of Australian cultivars are insensitive to photoperiod. In photoperiod sensitive genotypes, short-day (SD) conditions prolong the vegetative phase and delay the transition to reproductive development, whilst long-day (LD) conditions decrease time to reproductive phases. Flowering time is generally regulated by Vrn and Ppd genes; there is also an additional effect of a third level of genes, the earliness per se (Eps) genes. These have been identified as having a fine-tuning effect on flowering time, though these are less associated with regional adaptation of genotypes.
2017 results
In 2017, field experiments were conducted across eight sites in the NGR, in central and southern QLD, northern NSW and southern NSW. This paper presents results from five sites: Wagga Wagga, Trangie, Edgeroi, Wellcamp and Emerald. A range of genotypes with varied development (and with different combinations of Vrn and Ppd genes) were sown across from late April to late May, with an additional early April sowing at the Wagga Wagga site.
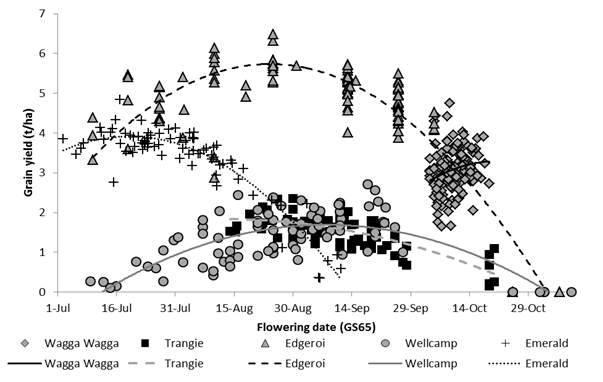
The optimum genotype and sowing date combination for achieving maximum grain yield varied significantly across the five sites (Figure 1). Optimal flowering time was substantially earlier and spanned longer in the northern sites compared to the Wagga Wagga site in southern NSW. In 2017, grain yields were maximised when the sowing date x genotype combinations flowered mid-late July at Emerald, late August-mid September at Wellcamp, mid-late August at Edgeroi and Trangie and early October at Wagga Wagga.

Figure 1. Relationship between flowering date and grain yield of genotypes across sowing dates at five sites in 2017.
Wagga Wagga site
The flowering window at Wagga Wagga was directly influenced by early stem frost damage in 2017. This resulted in significant tiller death and late regrowth of tillers in faster developing genotypes, consequently affecting uniformity of maturity in plots. Flowering dates are expressed as 50% of emerged spikes with visible anthers, as such many of the recorded flowering dates reflect later tillers and do not account for early tiller losses. Faster developing genotypes had lower tiller survival (proportion of tillers which produced a spike) at early sowing dates, whilst the slower developing genotypes, which remained vegetative for longer, were exposed to less frost events and were able to maintain tillers and stabilise flowering time.
Trangie site
The grain yield responses to flowering time at the Trangie site were largely influenced by below average rainfall, recording the driest growing season (April to September) in 2017 (Decile 1). In this warmer environment, winter genotypes flowered much later than the optimal flowering window, as a result yield was severely penalised (EGA_Wedgetail) or not attained (Manning and RGT Accroc).
Edgeroi site
The optimal flowering window at Edgeroi, as determined by grain yield response in 2017 (Figure 1), was broadly representative of this environment, highlighting the potential for frost risk whilst also underlining the impact of heat and moisture stress. In 2017, this was determined by a combination of abiotic stresses, including frost in August and early September, below average growing season rainfall April to October (195 mm) and temperatures ≥ 30°C in mid-late September. Consequently, the highest yields were achieved by combinations of sowing date x genotype which flowered during this optimal flowering window. The winter types with strong vernalisation responses, for example Manning, did not flower until late October, even when sown early, which was too late to achieve grain fill in this environment.
Wellcamp site
The optimal flowering window identified for Wellcamp (Figure 1), was generally representative of this environment. In 2017, the site was particularly influenced by cooler temperatures and significant frost events in July-September, and high temperatures throughout the flowering window. Grain yield was also influenced by a hail storm on 24 October, just prior to harvest. Generally, wheat is sown from late May to June for the Inner Downs region, due to increased risk of frost damage, and later onset of heat risk.
Emerald site
The flowering response observed at the Emerald site in 2017(Figure 1) was generally representative of the sowing dates in that environment. The optimal flowering window at Emerald is largely driven by high risk of heat stress August onwards, rather than early frost risk in most seasons. The winter genotypes such as RGT Accroc, Manning, EGA Wedgetail and Longsword did not achieve harvestable yield across any of the sowing dates, whilst some slower developing genotypes, such as LongReach Kittyhawk, Sunlamb, Sunmax and EGA Eaglehawk did measure grain yield, the Emerald environment favoured mid-fast spring genotypes which flowered within the optimal flowering window and attained the highest grain yields in 2017.
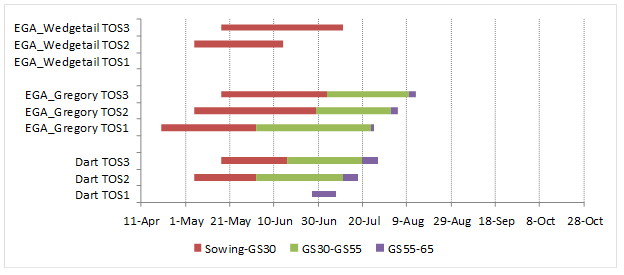
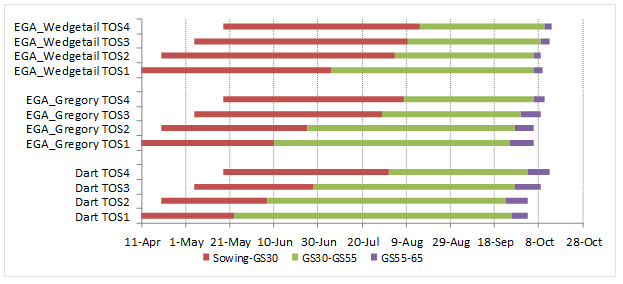
Preliminary results from 2017 indicate some variation in pre-flowering development phases of genotypes with respect to environment and sowing time across the experimental locations in the NGR (Figures 2 and 3). This may have implications to the variation in the flowering grain yield responses in Figure 1, as well as information regarding suitable phenology drivers for different environments. For example, at the Emerald site, winter type EGA Wedgetail was unable to saturate its vernalisation requirement to progress from the vegetative stage in the first sowing time (TOS1). Start of stem elongation (GS30) was recorded in TOS3 and for 2 of 3 replicates in TOS2 (Figure 2). In contrast, the extended vegetative phase of EGA Wedgetail at the Wagga Wagga site enabled a level of frost damage avoidance during the stem elongation phase, and recorded consistent flowering dates across sowing dates within the optimum flowering window.

Figure 2. Phasic development in response to sowing time of Dart, EGA Gregory and EGA Wedgetail at Emerald. Phase durations measured from sowing to start of stem elongation (GS30), ear emergence (GS55) and anthesis (GS65). Sowing dates: 20 April (TOS1); 5 May (TOS2) and 17 May (TOS3). Dotted lines indicate optimal flowering period in 2017.

Figure 3. Phasic development in response to sowing time of Dart, EGA Gregory and EGA Wedgetail at Wagga Wagga. Phase durations measured from sowing to start of stem elongation (GS30), ear emergence (GS55) and anthesis (GS65). Sowing dates: 10 April (TOS1); 20 April (TOS2); 5 May (TOS3) and 17 May (TOS4). Dotted lines indicate optimal flowering period in 2017, asterisks indicate significant frost damage, resulting in late regrowth influencing development.
Yield responses to sowing time
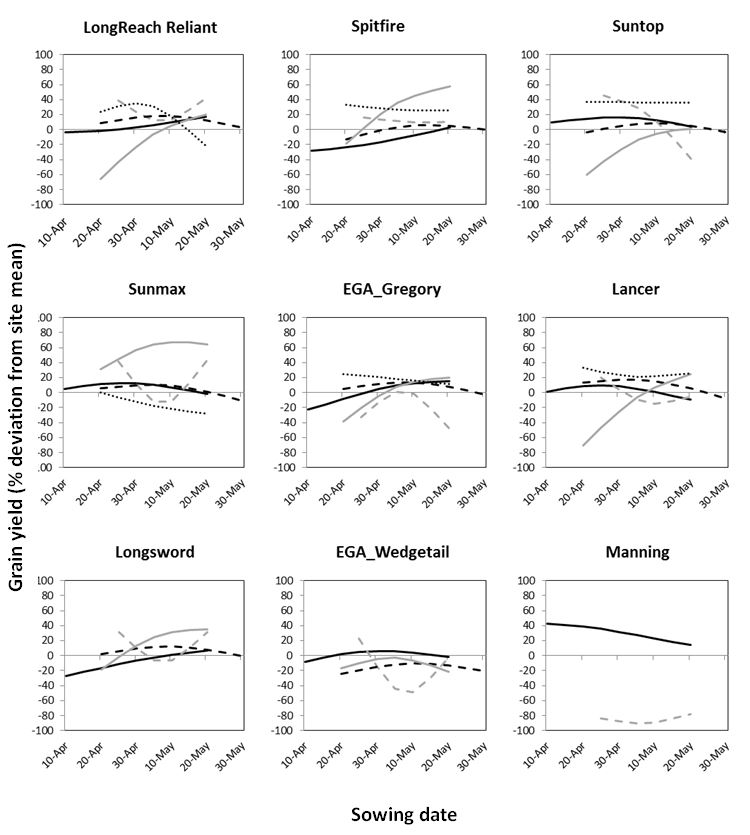
There was genotypic variation in the grain yield responses to sowing time across the five sites in 2017, as indicated for the selected genotypes in Figure 4. Generally, slow developing genotypes favoured southern sites, characterised with a longer growing season and high risk of frost damage. For example, Manning (winter type with strong vernalisation response) and EGA Wedgetail (winter type) had highest yields when sown early (indicated by negative slope) at the Wagga Wagga site. However, the vernalisation requirement of these winter types did not suit the warmer environments of northern NSW and QLD, and as such they either had significant grain yield penalties or did not achieve grain yield. The northern sites favoured mid-fast developing spring genotypes sown late April to early May (indicated by negative slope); in contrast, these were better suited to the late-May sowing at Wagga Wagga (indicated by positive slope). Despite the variability across environments, and conditions in 2017, some spring genotypes such as EGA Gregory and Suntop were able to maintain relatively stable grain yields across many sowing dates at some sites (indicated by flatter line). Whilst the general yield responses were similar for some sites, the variability in specific genotype responses across the sites suggests there are differences in suitability of genotypes across growing environments of the NGR.
Figure 4. Grain yield response to sowing date in 2017 for selected genotypes across five sites in the Northern Grains Region (black line =Wagga Wagga; grey dash line= Trangie, black dash line= Edgeroi, grey line= Wellcamp, dotted line= Emerald). Grain yield response is presented as deviation from site mean as a percentage for each site. Site means were: Wagga Wagga – 3.07t/ha; Trangie – 1.52t/ha; Edgeroi – 4.98t/ha; Wellcamp – 1.33t/ha; Emerald – 2.93t/ha. (LongReach Reliant, Spitfire, Suntop, Sunmax, EGA_Gregory, Lancer, Longsword, EGA_Wedgetail and Manning are protected under the Plant Breeders Rights Act 1994.)
Summary
Our data showed that genotypic variation in phenology had a significant effect on the grain yield potential of wheat varieties in response to sowing date across growing environments of the northern grains region. Genotypes varied in responses to vernalisation and photoperiod genes, which influenced early phasic development in addition to flowering time across the sites. Matching variety and sowing date to achieve an optimal flowering time for each growing environment is the most effective management strategy in minimising effects of abiotic stresses. In southern NSW, winter types can be sown early and regulate flowering to minimise effects of early frost damage and later, heat and moisture stress. However, in northern NSW and QLD, winter types are not able to saturate vernalisation requirements and the shorter growing season favours mid-fast spring types which are generally regulated by responses to photoperiod.
Acknowledgements
Sincere thank you for the technical support of Hugh Kanaley, Greg McMahon and Cameron Copeland at Wagga Wagga; Stephen Morphett, Michael Dal Santo and Jan Hosking at Tamworth; Tracie Bird-Gardiner and Jayne Jenkins at Trangie; Ellie McCosker and Jane Auer at Emerald.
The research undertaken as part of this project is made possible by the significant contributions of growers and is a co-investment by GRDC and NSW DPI under the Grains Agronomy and Pathology Partnership (GAPP).
We acknowledge the support of NSW DPI and QDAF and their cooperation at Wagga Wagga Agricultural Institute, Tamworth Agricultural Institute, Trangie Agricultural Research Station and Emerald Agricultural College.
Contact details
Felicity Harris
NSW DPI
Wagga Wagga Agricultural Institute
Pine Gully Road, Wagga Wagga NSW 2650
Mb: 0458 243 350
Email: felicity.harris@dpi.nsw.gov.au
Twitter: @NSWDPI_Agronomy
Varieties displaying this symbol beside them are protected under the Plant Breeders Rights Act 1994.
GRDC Project Code: DAN00213,
Was this page helpful?
YOUR FEEDBACK

