Australian wheat production compares well to global competitors - an international benchmarking comparison
Author: Ashley Herbert (Agrarian Management). | Date: 14 Mar 2018
Take home messages
- Wheat production in Australia tends to be relatively high cost with high levels of yield variation between years compared to other major wheat exporting regions of the world.
- The key strength or advantage of the Australian farms lies in the value achieved for grain sales.
- There is a real need to preserve or protect the existing markets and value of Australian wheat.
Introduction
Australian wheat production and profitability compares well to our international competitors according to data from the global benchmarking network, agri benchmark cash crop. This international analysis is part of the GRDC project AAM00001 and covers the five year period from 2011 to 2015.
Agri benchmark is a global network of professionals in agriculture from the major grain growing regions of the world. The aim of the network is to improve the understanding of grain production systems throughout the world through benchmarking. The network is administered and managed through the Thünen Institute of Farm Economics in Germany.
Participating network members establish a ‘Typical Farm’ for a defined region. These are virtual farms that reflect what would be considered typical for the targeted region in terms of scale, crops grown, rotations, inputs, operations, machinery, labour, costs and income. Each year the data is updated according to the prevailing conditions of the season.
The data is then compiled into a single database by the agri benchmark staff at the Thünen Institute. Financial data is converted into USD and EURO based on the average exchange for the year.
This study includes 41 typical farms located in the European Union (21), Canada (4), USA (1), Ukraine (2), Russia (1), Argentina (3), Uruguay (2) and Australia (7). While there are additional farms within the database, only the results of those with a continuous dataset for the five year period of 2011 to 2015 have been presented within this paper.
This report focusses on wheat and includes summaries of:
- Yields and yield variability.
- Farm gate grain prices.
- Crop income and production costs.
- Enterprise margins.
Australian representation
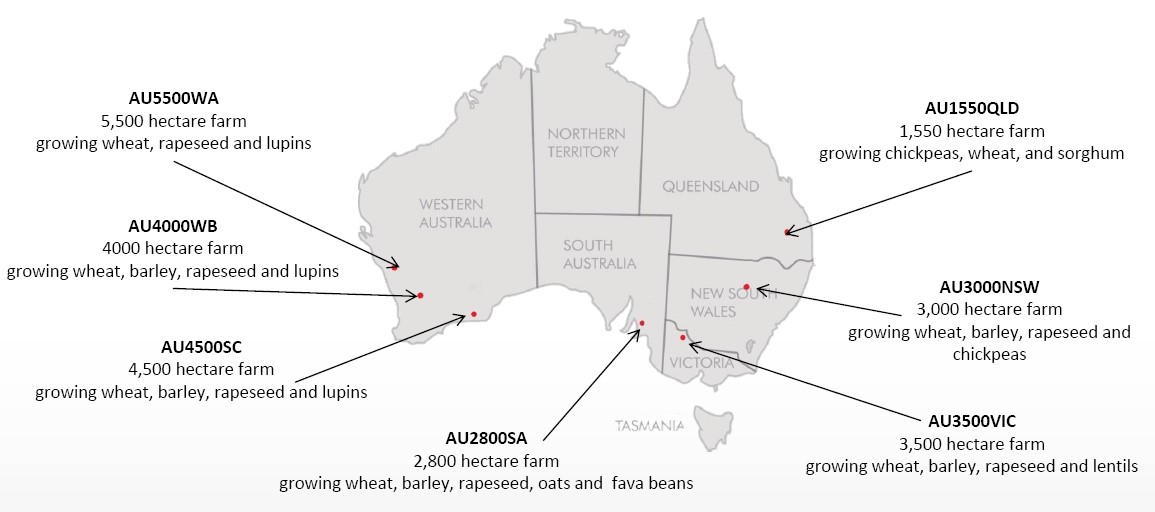
Figure 1. Location of the Australian farms that are within the agri benchmark network.
Table 1. Legend for country codes used in tables and figures within this paper.
Code | Country/Town | Code | County/Town | Code | Country/Town |
|---|---|---|---|---|---|
AUWB | Australia, Kellerberrin | AWSC | Australia, Esperance | AUNSW | Australia, Gulargambone |
AUQLD | Australia, Dalby | AUSA | Australia, Freeling | AUVIC | Australia, Sea Lake |
AUWA | Australia, Tenindewa | RU | Russia | UA | Ukraine |
BG | Bulgaria | CZ | Czech Republic | DE | Germany |
DK | Denmark | FR | France | HU | Hungary |
PL | Poland | SE | Sweden | UK | United Kingdom |
CA | Canada | US | United States of America | AR | Argentina |
UY | Uruguay |
Yield
The five year average yields of wheat in this analysis range from 1.6t/ha (AUVic) to 9.7t/ha (EU) with the EU standing out as the highest yielding region with a range of 4.7t/ha to 9.7t/ha. Within this group the highest yields are achieved on the typical farms from the Western European countries (including the UK) (Figure 2).
Wheat yields from the non EU farms ranged from 1.6t/ha (AUVic) to 5.4t/ha (Ukraine).
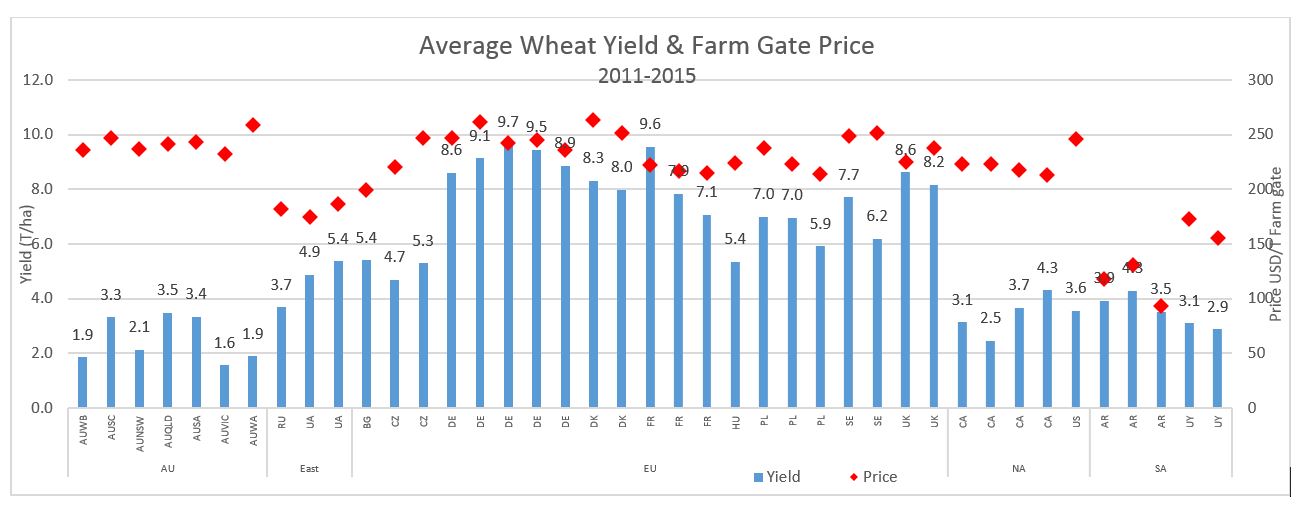 Figure 2. Average wheat yields and grain prices ($US/t farm gate) for the five years from 2011 to 2015.
High yield variability between years is a stand out feature of the Australian farms. The Australian wheat yields have been the most variable over the last five years with an average coefficient of variation (CoV) of 25% over this period (ranging from 9% AUQld to 44% AUNSW).
In general, yields on the EU, North American, Argentinian and East region farms have been relatively stable with an average CoV of 12%, 13%, 15% and 12% respectively.
The highest level of yield variation within the dataset was recorded on the AUNSW farm reflecting the extreme fluctuations of seasonal conditions in the study period. The recorded yields for this farm ranged from 0.8t/ha to 2.9t/ha.
Price
Grain prices are presented on a farm gate basis per tonne nett of freight to end point and include all selling costs. The price reflects the total value of grain produced including premiums or discounts for quality or grade.
The wheat price has been relatively consistent across regions with $US31/t difference between the 25th and 75th price percentile. The median price for the dataset was $US225/t.
The prices for the Australian farms have been relatively high and consistent between farms. The combined average for the Australian farms of $US242/t compares very well to other regions and is just under the 75th percentile of the dataset. This is particularly significant given the generally high cost of getting Australian grain from farm to port.
Table 2. Average farm gate wheat price ($US/t) for the years 2011 to 2015.
Typical farm regions | Farm gate price ($US/t) | |||
|---|---|---|---|---|
Average | 25th Percentile | Median | 75th Percentile | |
AU4000WB | $236 | |||
AU4500SC | $247 | |||
AU3000NSW | $237 | |||
AU1550QLD | $241 | |||
AU2800SA | $243 | |||
AU3500VIC | $233 | |||
AU5500WA | $259 | |||
AUSTRALIA | $242 | |||
East Europe | $181 | |||
EU | $235 | $223 | $238 | $247 |
North America | $225 | |||
Argentina | $114 | |||
Uruguay | $164 | |||
All farms | $219 | $214 | $225 | $245 |
Income and costs
In order to meaningfully compare between farms and regions, costs, income and profit margin are calculated on a tonne of production basis. On this basis the EU farms are no longer distinctive as a group and the Argentinian farms are clearly the lowest cost producers (Figure 3). Total costs of production ranged from $US107/t (Argentina) to $US206/t (AUNSW).
There is a high level of variation in costs per tonne of production within the Australian group ranging from the highest for the dataset (AUNSW $US206 and AUWA $US215) to some of the lowest (ex-Argentina).
The high average cost for AUNSW is the result of the exceptionally poor yield in 2013 of 0.8t/ha. This will have a disproportionate effect on the average costs per tonne in the short term, assuming that such yields occur far less frequently than one in four years.
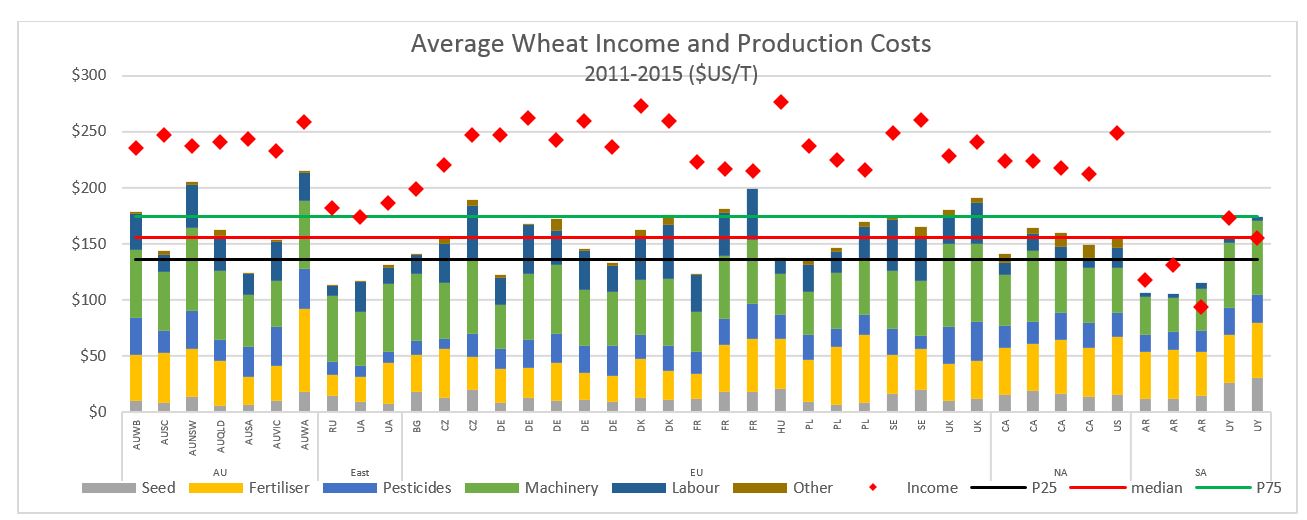
Figure 3. Average wheat income and costs per tonne ($US) of production for the period 2009 to 2013. P25 (low line) and P75 (high line) refers to the 25th and 75th percentiles for the total production costs of the dataset, respectively.
One common feature across all farms is the high cost of fertiliser and machinery. While there is some level of variation between the individual farms these two items were consistently the highest cost items at the regional level.
Table 3. Average and median production costs per tonne of wheat production for the period 2011 to 2015.
Region/ Farm | Cost per tonne of production (USD) | |||||
|---|---|---|---|---|---|---|
Seed | Fertiliser | Pesticides | Labour | Machinery | Total | |
AU4000WB | $11 | $41 | $33 | $32 | $60 | $179 |
AU4500SC | $8 | $45 | $20 | $15 | $52 | $144 |
AU3000NSW | $14 | $43 | $34 | $38 | $74 | $206 |
AU1550QLD | $5 | $40 | $19 | $31 | $62 | $163 |
AU2800SA | $7 | $25 | $26 | $18 | $47 | $124 |
AU3500VIC | $10 | $31 | $34 | $35 | $41 | $154 |
AU5500WA | $18 | $74 | $36 | $25 | $61 | $215 |
AUSTRALIA | $10 | $43 | $29 | $28 | $57 | $169 |
East Europe | $11 | $26 | $10 | $17 | $56 | $120 |
EU | $13 | $36 | $22 | $33 | $53 | $160 |
North America | $16 | $46 | $21 | $13 | $49 | $154 |
Argentina | $13 | $41 | $17 | $4 | $34 | $109 |
Uruguay | $28 | $46 | $24 | $4 | $62 | $165 |
All farms | $14 | $38 | $22 | $25 | $52 | $155 |
The Argentinian farms have the lowest costs per tonne of production with an average of $US109/t (dataset median $US156/t) which is driven for the most part by the significantly lower machinery and labour costs. A key point of difference on these farms is the exclusive use of contractors for all cropping activities. Machinery costs include fuel, repairs, contracts and depreciation. According to the network partners this is common practice in the grain growing regions of Argentina.
As a region, Australia has the highest costs of production with an average of $US169/t ranging from a low of $US124/t to $US215/t. This represents a range of $US91/t.
The high production costs of the AUWA farm ($US215/t) is relatively consistent across years and is primarily due to a high cost structure across the board. Fertiliser in particular is the highest cost in the data set at $US74/t reflecting a relatively high input system.
East region farms (Russia and Ukraine) have a cost base of $US120/t which is approximately $US40/t less than the Australian average. The difference is primarily driven by low fertiliser, pesticides and labour costs. However, wheat prices recorded were approximately $US60/t less which has eroded some of the competitive advantage.
Enterprise margin
In general Australian wheat profitability compares favourably to farms from Canada, USA and EU. The margin for AUSC and AUSA were within the group of the highest margins at $US104/t and $US119/t, respectively (Figure 4).
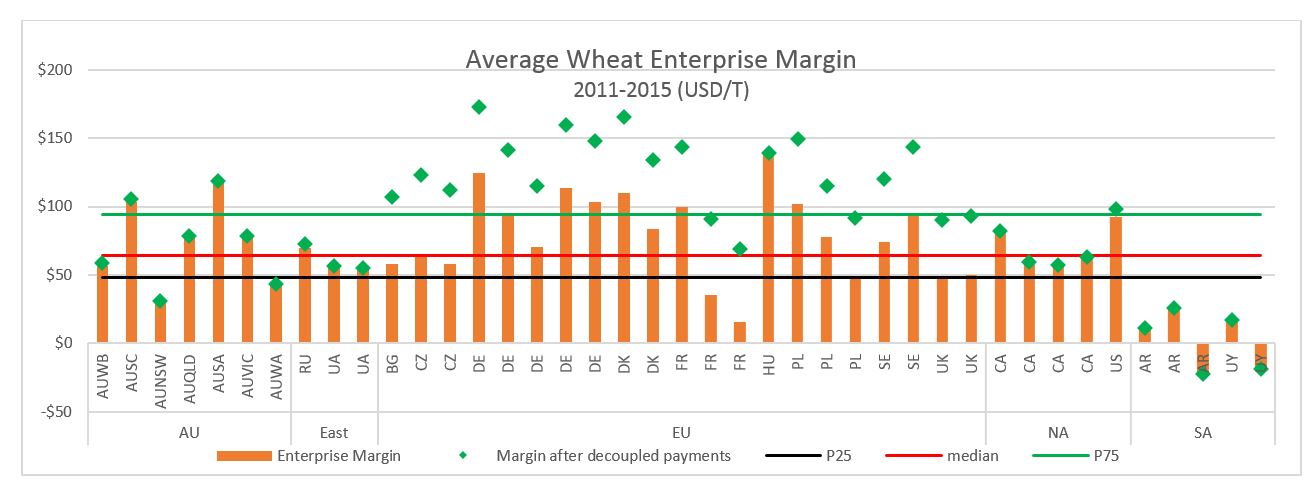
Figure 4. Average wheat enterprise margin ($US) per tonne of production of wheat for the period 2011 to 2015; including decoupled payments. P25 (low line) and P75 (high line) refers to the 25th and 75th percentile margin, respectively.
Profitability was highly variable within the EU group with margins ranging from $US16/t to $US139/t. The median profit for the EU group was $US78/t.
The average profit margin for the North American farms was $US71/t.
Decoupled payments refer to income that was received independent of production (e.g. subsidies).
Decoupled payments added $US37/t to $US59/t to the profitability of the EU farms. This increased the median profit margin to $US127/t of the EU farms.
Despite having some of the highest production costs and lowest yields in the dataset, the profit margin on the Australian farms was just above the average for the dataset. This is attributable to the relatively high grain price achieved over the period.
Although the South American farms have the lowest production costs they also recorded exceptionally poor pricing for the period resulting in very low margins.
Interestingly, the average margins for the EU, North American and Australian farms are relatively similar ($US79/t, $US71/t & $US73/t). However, when decoupled payments are taken into account the EU farms have a $US48/t advantage.
Table 4. Summary of wheat enterprise margin ($US) per tonne of production.
Typical farm regions | Wheat enterprise margin ($US/t) | ||||
|---|---|---|---|---|---|
Average | 25th Percentile | Median | 75th Percentile | + decoupled | |
AU4000WB | $57 | $59 | |||
AU4500SC | $104 | $105 | |||
AU3000NSW | $31 | $31 | |||
AU1550QLD | $79 | $79 | |||
AU2800SA | $119 | $119 | |||
AU3500VIC | $79 | $79 | |||
AU5500WA | $43 | $43 | |||
AUSTRALIA | $73 | $74 | |||
East Europe | $61 | $62 | |||
EU | $79 | $58 | $78 | $102 | $125 |
North America | $71 | $72 | |||
Argentina | $5 | $5 | |||
Uruguay | -$1 | -$1 | |||
All farms | $67 | $48 | $64 | $94 | $90 |
Key messages and strategic value
This study highlights that wheat production in Australia tends to be relatively high cost with high levels of yield variation between years compared to other major wheat exporting regions of the world. Australia is not a low cost producer of wheat despite the general large scale nature of the Australian production system.
Despite this, the average wheat enterprise margin for the Australian farms of $US73/t was above the dataset average and median ($US67/t and $US64/t, respectively) and similar to that of the EU and North American farms ($US79/t and $US71/t excluding decoupled payments, respectively).
The key strength or advantage of the Australian farms lies in the value achieved for grain sales. Over the five year period of this study the Australian farms achieved the highest average price in the dataset at $US242/t farm gate. The median price of the dataset was $US225/t. The EU farms had median prices of $US238/t and North American farms had median prices of $US225/t farm gate.
This implies that Australian wheat is highly valued and/or Australian wheat (on average) is accessing higher value markets and is achieving some of the best prices in the world. Therefore, expectations of achieving better pricing relative to the general market in the future are probably unreasonable.
One of the key messages from this study is that there is a real need to preserve or protect the existing markets and value of Australian wheat.
Australian farms are unlikely to be able to compete with the low cost of production of the Russian and Ukraine production systems. These areas have fundamentally very low costs for inputs and labour which are not likely to change for some time. In addition, there is the very real prospect of significant productivity gains to be achieved within these regions in the medium term.
While maintaining a continual focus on cost control and yield improvement remains a priority, the main message for the broader industry is that the high value grain price needs to be preserved to maintain competitive profitability, particularly for the lower yielding producers. Medium to low yield typical Australian farms are unlikely to be sufficiently profitable at the average wheat price for the data set.
Contact details
Ashley Herbert
Agrarian Management
ashley@agrarian.com.au
GRDC Project Code: AAM00001,
Was this page helpful?
YOUR FEEDBACK