Chickpeas, wheat and Pratylenchus thornei: build-up and decline in the farming system. Chickpeas – a combination of susceptibility and moderate tolerance.
Author: Kirsty Owen (University of Southern Qld), Jason Sheedy (University of Southern Qld), Tim Clewett (University of Southern Qld), Grant Hollaway (Agriculture Victoria) and John Thompson (University of Southern Qld) | Date: 01 Mar 2018
Take home messages
- Chickpea varieties range from moderately susceptible to susceptible to the root-lesion nematode, Pratylenchus thornei.
- Growing chickpeas will increase populations of P. thornei that will carry-over to infest following crops, however, chickpea varieties may not suffer yield loss.
- Pratylenchus thornei populations at the time of planting and the tolerance of a wheat variety determine the degree of yield loss at the end of the season.
- Look closely at your crop rotations or sequences and consider the impact of growing susceptible crops, such as chickpea and wheat that will increase P. thornei populations thereby limiting crop variety choice in future seasons.
Background: Pratylenchus thornei in the northern grain region and their management
The root-lesion nematode Pratylenchus thornei is found in soils in two-thirds of fields in the northern grain region. The nematode feeds and reproduces in the roots of plants and can cause yield loss because it reduces the ability of roots to take-up water and nutrients. Populations of the nematode build-up under susceptible crops, are able to survive fallow periods and carry-over into the next cropping season. There are no registered chemical control methods to reduce P. thornei. When P. thornei is present in fields at damaging populations (greater than 2/g soil), management relies on:
- growing tolerant crop varieties that do not suffer yield loss, and
- increasing the number of resistant crops in the cropping sequence to reduce populations.
When P. thornei populations are reduced to very low populations, crop variety choice is expanded and farm profits are maximised.
Definition of tolerance and resistance
- Tolerance is the ability of a plant to produce good yields in the presence of P. thornei. Its opposite is intolerance.
- Resistance is the ability of the plant to prevent nematode reproduction. Its opposite is susceptibility.
Crop varieties can be tolerant but susceptible, that is they produce good yields, but allow the nematode to increase in population. The ideal combinations for management of P. thornei are varieties that are tolerant AND resistant.
Resistance and tolerance of chickpea
Repeated two-year experiments to determine the tolerance and resistance of chickpea varieties were conducted at Formartin, Queensland in 2014-15 and 2015-16. In the first year of each experiment, the wheat varieties QT8343 (moderately resistant to P. thornei) and Kennedy (susceptible to P. thornei), were grown to establish low or high P. thornei populations in a replicated, randomised block design. In the second year of each experiment, varieties or advanced lines of chickpea, and wheat varieties with moderate resistance and susceptibility were planted following the established design. Nematode populations were determined by PreDicta®B tests at planting and at harvest in the second year of the experiment.
Before planting in the second year of the experiments, average P. thornei populations after growing the susceptible wheat cv. Kennedy were 14/g soil and after the resistant cv. QT8343, 5/g soil. In the second experiment, populations were 29/g after cv. Kennedy and 7/g soil after QT8343.
Tolerance or yield loss
Average yield across all chickpea varieties was reduced by 6.5% when grown on the high P. thornei populations compared to the low populations (P=0.05), however, no differences in yield loss were detected between varieties. Average yield for chickpea varieties on the low P. thornei populations was 2.77 t/ha and 2.59 t/ha after the high P. thornei populations.
The take home message from these experiments is that chickpea varieties are generally moderately tolerant to P. thornei.
Resistance or nematode reproduction in chickpea
Populations of P. thornei increased after growing chickpea varieties compared to the initial P. thornei populations present at planting (Pi) which was 7/g soil averaged over both experiments (Figure 1).
Pratylenchus thornei populations at harvest ranged from 8/g soil for cv. PBA HatTrick to 28/g soil for cv. Kyabra (Figure 1). Populations were significantly greater (P=0.05) than wheat cv. QT8343 after chickpea cvs CICA0709, PBA Seamer , PBA Boundary, CICA1313, CICA1007 and Kyabra. Populations increased by 1.2 to 4.3 times compared to the moderately resistant wheat control. In contrast, for the very susceptible wheat control cv. Strzelecki, populations at harvest were 67/g soil, or a 10-fold increase compared to the moderately resistant wheat control.
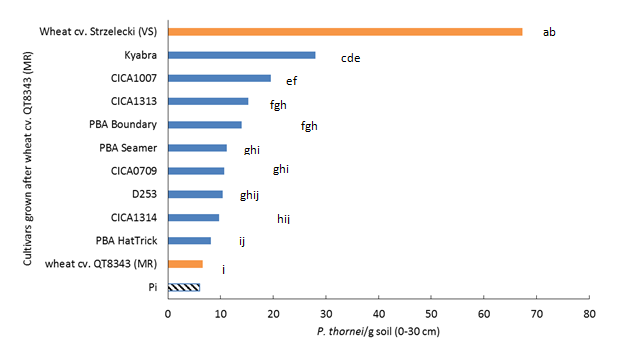
Figure 1. Populations of Pratylenchus thornei/g soil at 0–30 cm soil depth after harvest of chickpea varieties compared to wheat cv. QT8343 (moderately resistant) and wheat cv. Strzelecki (very susceptible). Initial P. thornei populations at planting are shown by the hashed bar. Results from combined experiments from two seasons. Bars followed by the same letter are not significantly different (P=0.05).
Take home message on chickpeas and P. thornei
Chickpeas generally have a good level of tolerance to P. thornei but because most chickpea varieties are susceptible to P. thornei, populations of the nematode will increase to attack future crops. Consider the impact of growing chickpeas in your crop sequences if you are trying to reduce P. thornei populations or keep them at low levels.
Wheat yield loss response curves
Several two-year field experiments to determine the impact of increasing P. thornei populations on the yield of wheat varieties that range from intolerant to tolerant have been conducted in Queensland at Formartin and Westmar. This paper reports results from 2017 at Westmar in a very dry season.
In the first year of the experiment, four varieties of wheat that ranged from resistant to susceptible to P. thornei were planted to establish a range of P. thornei populations. The design was a randomised complete block with four replicates. In the second year before planting, soil samples were collected from each plot (at 0–30 cm) and P. thornei populations determined by PreDicta®B. Then, six wheat varieties were planted so that each variety was exposed to a range of P. thornei populations (Table 1).
Table 1. Wheat varieties grown in the second year of the experiment at Westmar, Queensland, the range of P. thornei populations for each variety before planting and yield loss during that season
Variety | Tolerancea | P. thornei/g soil at planting | Max. yield lossb | |
|---|---|---|---|---|
Min. | Max. | % | ||
Suntop | MT-T | 0.7 | 29.4 | NDc |
EGA Gregory | MT-T | 0.6 | 28.5 | 13 |
LongReach Spitfire | MT-MI | 0.4 | 24.1 | 23 |
Lang | MI | 1.1 | 20.4 | 59 |
LongReach Lincoln | I | 1.0 | 28.0 | 81 |
Strzelecki | I-VI | 1.2 | 19.2 | 64 |
aMT-T, moderately tolerant-tolerant, MT-MI, moderately tolerant-moderately intolerant; MI, moderately intolerant; I, intolerant; I-VI, Intolerant-very intolerant. Ratings from nvtonline 2018.
bYield loss was calculated for the minimum and maximum P. thornei at planting from the yield response curves for each variety (Figure 2).
cND, none detected.
Results from Westmar
Despite the dry seasonal conditions which restricted yield potential of each variety, there was a significant (P<0.001) negative relationship between yield of each wheat variety and P. thornei populations at planting except for Suntop (Figure 2).
Suntop was the highest yielding variety (average 1.5 t/ha) and its yield did not change in response to increasing P. thornei populations. This is an interesting result because Suntop has a higher level of resistance than EGA Gregory which is moderately susceptible to P. thornei but both have a similar tolerance rating.
Yield loss at the maximum P. thornei population compared to the lowest population for other varieties ranged from 13% for EGA Gregory to 81% for LongReach Lincoln (Table 1). The rate of yield loss was greatest at low initial P. thornei populations for intolerant varieties such as LongReach Spitifire, Lang, Strzelecki and LongReach Lincoln (Figure 2).
 at Westmar, Queensland in 2017. There was a significant yield response of each variety to P. thornei populations at planting, except for Suntop to the (P<0.001). Figure provided by Karyn Reeves, Curtin University.")
Figure 2. The yield response of six wheat varieties to P. thornei populations present at planting (Initial Pt/g soil at 0-30 cm soil depth; backtransformed) at Westmar, Queensland in 2017. There was a significant yield response of each variety to P. thornei populations at planting, except for Suntop to the (P<0.001). Figure provided by Karyn Reeves, Curtin University.
The take home message on yield response of wheat to P. thornei
Low P. thornei populations will maximise profits from wheat production and expand variety choice. Avoid intolerant wheat varieties when P. thornei populations are at damaging populations, but be aware that even moderately tolerant varieties may suffer yield loss.
Acknowledgements
The research undertaken as part of this project is made possible by the significant contributions of growers through both trial cooperation and the support of the GRDC, the authors would like to thank them for their continued support.
We would especially like to thank Alex Gwynne and family, and James Coggan for their generous support of our field trials.
Thank you to Doug Lush (QDAF) for running the Westmar trial, Kerry Bell (QDAF) for statistical analyses, Kevin Moore and Kristy Hobson (NSW DPI) for advice and supply of chickpea seed, and to all in the Crop Nematology team (Centre for Crop Health, USQ) for their support.
DAW00245, nematode module, is led by Dr Grant Hollaway (AgVic) and statistical support provided by Dr Karyn Reeves (SAGI-West, Curtin University).
Contact details
Kirsty Owen
Centre for Crop Health, University of Southern Queensland
Leslie Research Centre, PO box 2282, Toowoomba, 4350 QLD
Ph: 07 46 311 239
Email: Kirsty.Owen@usq.edu.au
Varieties displaying this symbol beside them are protected under the Plant Breeders Rights Act 1994.
Was this page helpful?
YOUR FEEDBACK