Deprive weeds of sunlight and space ‐ crop competition research in the northern grains region
Author: Michael Widderick (QDAF), Adam McKiernan (QDAF), Greg Harvey (QDAF), Linda Heuke (University of Sydney), Michael Walsh (University of Sydney) and Bhagirath Chauhan (QAAFI) | Date: 06 Mar 2018
Call to action/take home messages
- Growing a competitive crop can significantly reduce weed numbers, biomass and seed production in crop while providing increases in grain yield.
- Growing faba bean and chickpea at a narrow row spacing of 25cm and a high plant density of 70 and 80 plants/m2 respectively significantly reduced sowthistle biomass and seed production while increasing crop yield.
- Growing wheat at narrow row spacing of 25cm and a high density of 120 plants/m2 significantly reduced awnless barnyard grass density, biomass and seed production while increasing crop yield.
- Narrow row spacing (25cm) in mung bean and soybean could lead to reduced weed growth and increased crop yield.
- The critical time of weed removal in mung bean and soybean occurs at later stages of crop growth in narrow (25cm) compared to wide rows (75cm).
Introduction
Crop competition is widely accepted as an important tactic for suppressing weed growth and development while maintaining crop yield. Agronomic choices influence crop competition, including crop species and cultivar, row spacing and crop density. All these cultural control tactics have been shown to impact on the control of in-crop weeds.
This paper outlines recent research conducted by the Queensland Department of Agriculture and Fisheries (QDAF) and the University of Queensland (UQ) on important crop competition factors in key crops and for key weed species. The first component of the paper describes QDAF research in winter crops on the impact of crop row spacing and density in chickpea and faba beans on common sowthistle (Sonchus oleraceus) and early emerging awnless barnyard grass (Echinochloa colona) in wheat. The second component of the paper describes UQ research on the effect of row spacing, seeding rate and weed infestation period in mung beans and soybeans and the effect on Rhodes grass.
1. Crop competition in winter crops (QDAF)
Background
Awnless barnyard grass and common sowthistle are common weed species infesting crops in the northern region, contributing an estimated $14.7 and $4.2 million in crop revenue loss each year (Llewellyn et al. 2016). Both species have been confirmed as having glyphosate resistance and common sowthistle also has resistance to chlorsulfuron in Queensland.
Awnless barnyard grass is recognised as a summer dominant weed, predominantly emerging in mid-spring to mid-autumn. However, recent observation has seen the weed emerge earlier to infest winter crops prior to harvest. This earlier emergence takes place at a crop growth stage when post emergence in-crop herbicides are not an option and when residual herbicides are no longer persistent.
As part of a five year GRDC project, we have evaluated the effect of crop row spacing and density on the presence and growth of common sowthistle in faba beans and chickpea, and in wheat on early emerging awnless barnyard grass.
Three field experiments were conducted in 2017 at the QDAF Hermitage Research Facility near Warwick, Queensland:
- faba beans with common sowthistle
- chickpeas with common sowthistle
- wheat with awnless barnyard grass.
Materials and methods
The faba bean (cv. PBA Warda) and chickpea (cv. PBA HatTrick ) experiments were planted on the 15th May and an equal number of sowthistle seed per plot were distributed in weedy plots the day after. The target crop densities were 15, 30 and 60 plants/m2 planted at row spacing of 25 and 50cm. In both experiments a crop-free + weeds treatment was included and for each row spacing x crop density treatment combination, there were both weedy and weed-free plots. The sites were irrigated to promote crop and weed emergence and any non-target weeds were manually removed.
The third experiment with wheat (cv. Longreach Lancer) was planted 27th July at target plant densities of 75, 100 and 125 plants/m2 at row spacings of 25 and 50cm. The site had a natural infestation of awnless barnyard grass and was watered (16th August) to encourage awnless barnyard grass emergence. A crop-free treatment was included, but there were no weed-free treatments. Any non-target weeds were manually removed.
In each experiment, data was collected on weed emergence, weed biomass and seed production and crop yield. Weed measurements were made close to crop maturity at approximately 1 to 2 weeks before crop harvest. For faba beans, these measurements were taken on the 9th October, for chickpea the 30th October and for wheat the 12th December 2018.
Results
Faba bean experiment
The faba bean plant densities were 21, 41 and 70.5 plants/m2, which exceeded the target populations of 15, 30 and 60 plants/m2 respectively. Actual crop densities have been used in analysing the data, and for density comparisons, values of 20, 40 and 70 plants/m2 are used.
Sowthistle density was not affected by crop density or the absence of crop (crop-free treatment) with density ranging from 17-35 plants/m2. However, there were significantly more sowthistle present in 50cm row spacing treatments than 25cm treatments with on average 30 and 22 plants/m2 respectively. Therefore, narrow row spacing reduced either the emergence of sowthistle or survival of emerged sowthistle.
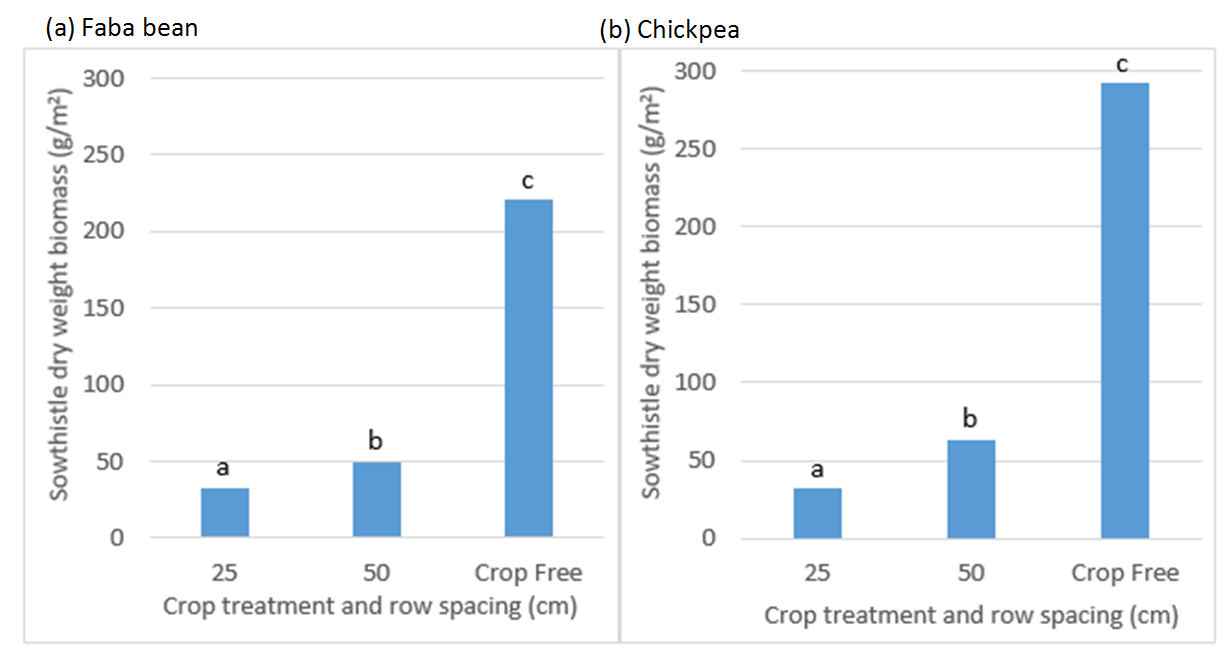
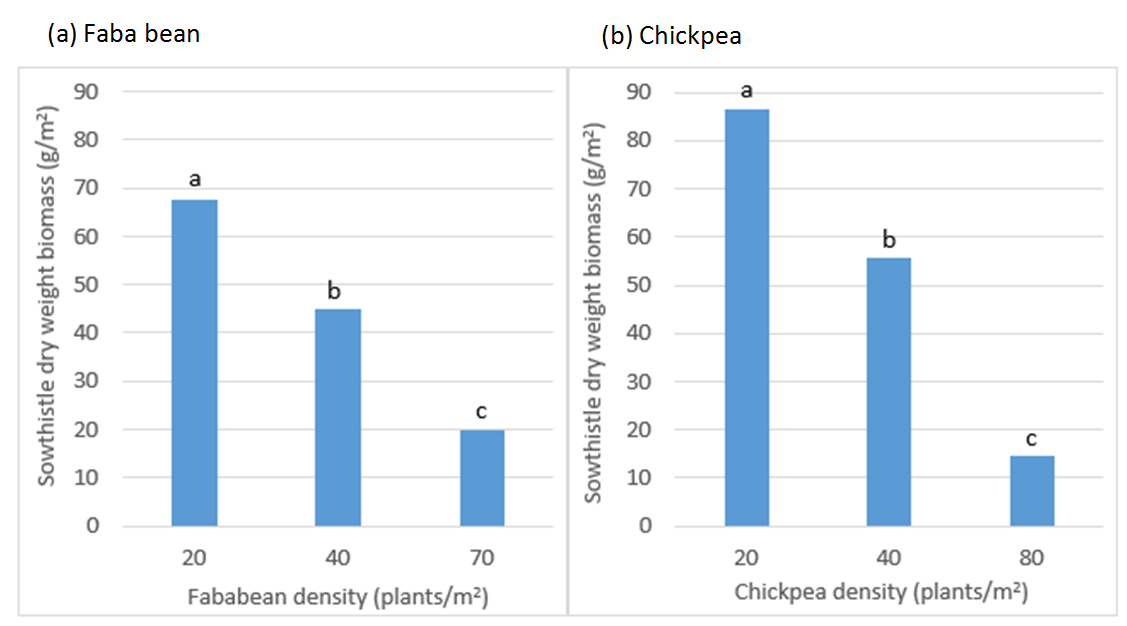
Sowthistle biomass was 33% lower at 25cm row spacing when compared with the 50cm row spacing, and biomass was over 440% greater in the crop-free treatment compared to the 50cm spacing, and over 660% more biomass than in the 25cm row spacing (Figure 1a). Crop density also affected sowthistle biomass, with biomass significantly greater at a crop density of 20 plants/m2 than at 50 plants/m2, and greater at 50 plants/m2 than at 70 plants/m2 (Figure 2a).
Figure 1. Sowthistle dry weight biomass (g/m2) as influenced by (a) faba bean and (b) chickpea row spacing (cm) and the absence of crop. Sowthistle biomass was assessed close to crop maturity on the 9th and 30th October 2018 respectively. Bars with a different letter within a crop are significantly different at a 5% significance level.
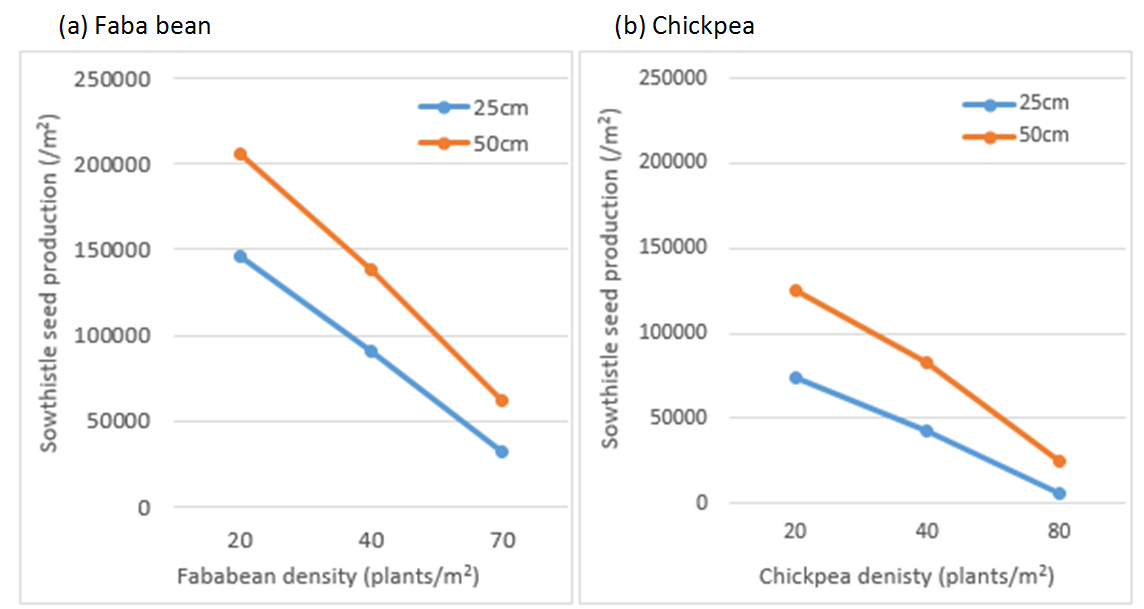
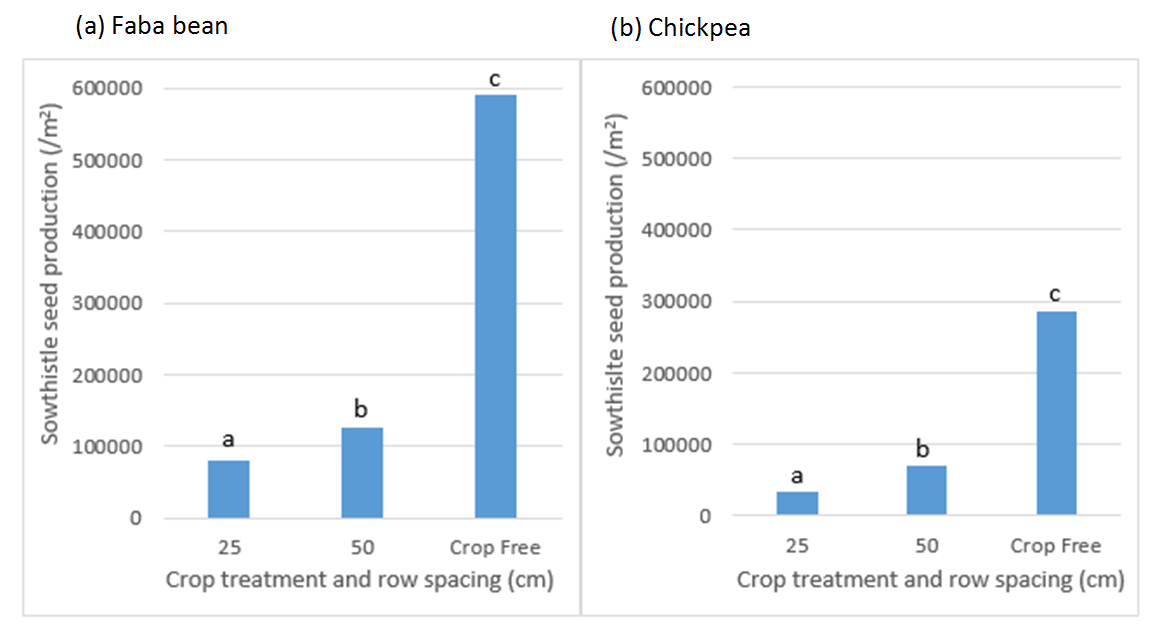
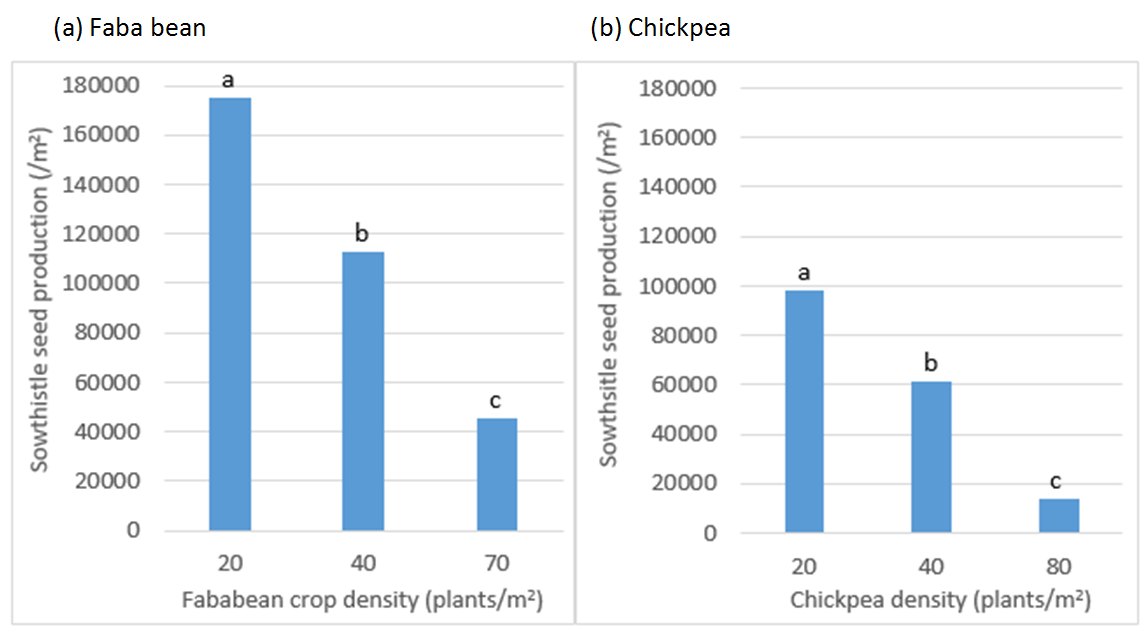
Sowthistle seed production was least when faba bean was grown at the combination of 25cm row spacing and density of 70 plants/m2 with seed production greatest at a combination of 50cm row spacing and density of 20 plants/m2 (Figure 3a). Sowthistle seed production was 36% less at 25cm crop row spacing when compared with the 50cm row spacing (Figure 4a) and seed production in the crop-free treatment averaged almost 591,000 seeds/m2, which was significantly higher than cropped treatments. Sowthistle seed production was also greater at a crop density of 20 plants/m2 compared to 40 plants/m2, and greater at 40 plants/m2 than at 70 plants/m2 (Figure 5a).
Figure 2. Sowthistle dry weight biomass (g/m2) in response to (a) faba bean and (b) chickpea plant densities (plants/m2). Sowthistle biomass was assessed close to crop maturity on the 9th and 30th October 2018 respectively. Bars with a different letter within a crop are significantly different at a 5% significance level.
Figure 3. Sowthistle seed production (/m2) in response to (a) faba bean and (b) chickpea row spacing (cm) and density (plants/m2). Sowthistle seed production was assessed close to crop maturity on the 9th and 30th October 2018 respectively.
Figure 4. Sowthistle seed production (/m2) in response to (a) faba bean and (b) chickpea row spacing (cm) and the absence of crop. Sowthistle seed production was assessed close to crop maturity on the 9th and 30th October 2018 respectively. Bars with a different letter within a crop are significantly different at a 5% significance level.
Figure 5. Sowthistle seed production (/m2) as influenced by (a) faba bean and (b) chickpea plant densities (plants/m2). Sowthistle seed production was assessed close to crop maturity on the 9th and 30th October 2018 respectively. Bars with a different letter within a crop are significantly different at a 5% significance level.
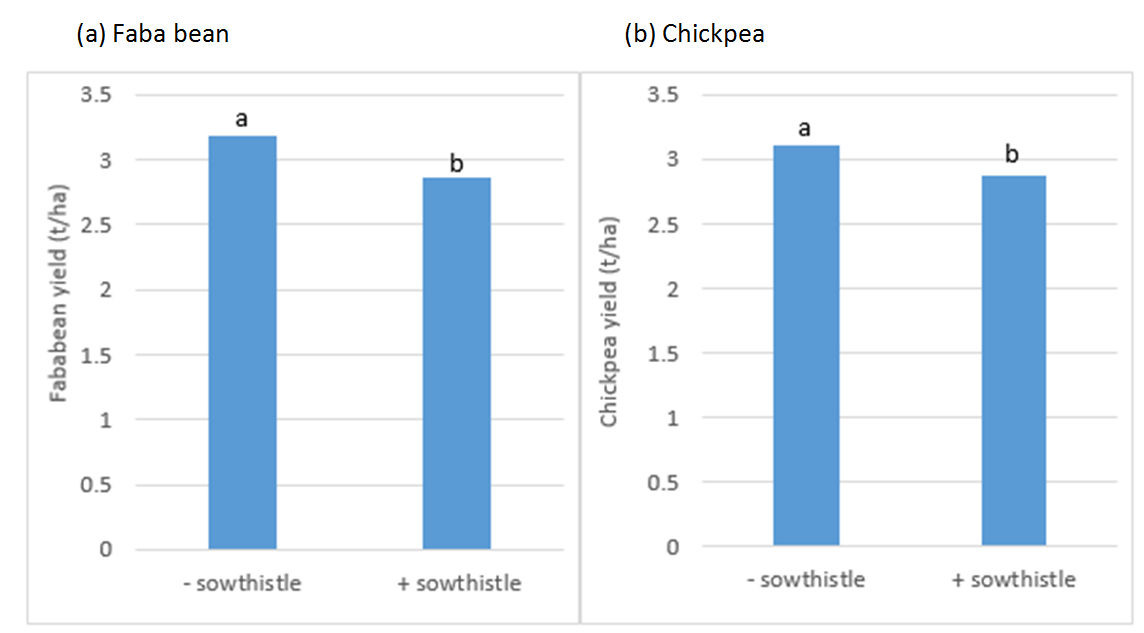
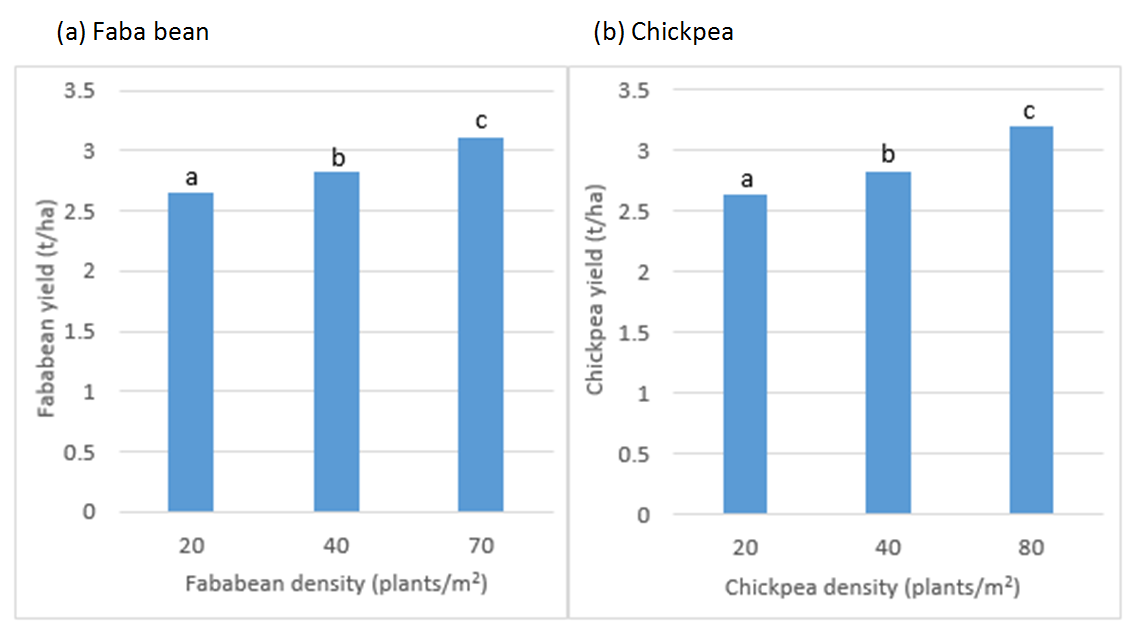
Crop yield was not different between row spacing treatments. However, crop yield was significantly less in the presence of weeds (Figure 6a), with 11% less yield in weedy treatments. In the absence of weeds, crop density did not affect crop yield. However, in the presence of weeds, there were significant increases in yield with each increase in crop density above 20 plants/m2 (Figure 7a).
Figure 6. (a) Faba bean and (b) chickpea yield (t/ha) in the presence or absence of sowthistle. Bars with a different letter within a crop are significantly different at a 5% significance level.
Figure 7. (a) Faba bean and (b) chickpea yield (t/ha) at increasing plant density (plants/m2) when infested with sowthistle. Bars with a different letter within a crop are significantly different at a 5% significance level.
Chickpea experiment
The chickpea plant densities were 22.6, 40 and 79.5 plants/m2, which exceeded the target populations of 15, 30 and 60 plants/m2 respectively. Densities of 20, 40 and 80 plants/m2 are used in the analysis and presentation of results.
Sowthistle density ranged from 12 – 30 plants/m2 and was consistent across the site with no significant difference between treatments.
Sowthistle biomass was 50% less in the 25cm row spacing treatment when compared with the 50cm treatment, and the crop-free weed biomass was over 460% greater than in the 50cm treatment, and over 900% more than in the 25 cm row space treatment (Figure 1b). In addition, crop density impacted on sowthistle biomass with biomass significantly greater at a crop density of 20 plants/m2 than at 50 plants/m2, and greater at 50 plants/m2 than at 80 plants/m2 (Figure 2b).
Sowthistle seed production was least when chickpea was grown at the combination of 25cm row spacing and density of 80 plants/m2 with seed production greatest at a combination of 50cm row spacing and density of 20 plants/m2 (Figure 3b). Sowthistle seed production was 52% lower at the 25cm row spacing than at the 50cm row spacing and was significantly higher in the crop-free treatment which had sowthistle seed production of 287,000 seeds/m2 (Figure 4b). Also, sowthistle seed production was influenced by crop density. Significantly more seeds were produced at a crop density of 20 plants/m2 compared to 40 plants/m2, and more at 40 plants/m2 than at 80 plants/m2 (Figure 5b).
Crop yield was not affected by row spacing. However, crop yield was significantly higher in treatments were weeds were not present (3.1 t/ha) compared with when weeds were present (2.9 t/ha) (Figure 6b). Crop yield was not affected by crop density in weed-free plots. However, was affected by crop density in the weedy plots, where there was a significant increase in yield at the crop density of 80 plants/m2 over the density of 40 plants/m2, which had a greater yield than the 20 plants/m2 crop density (Figure 7b).
Wheat experiment
Wheat density averaged 60, 88 and 105 plants/m2 and there was a significant difference between crop densities across row spacing. This has been accounted for in the analysis. Actual crop densities have been used in analysing the data, and for density comparisons, values of 60, 90 and 120 plants/m2 are used.
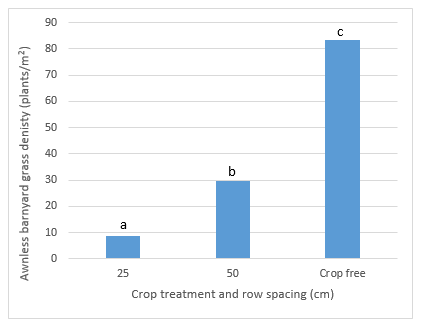
Growing a competitive crop of wheat significantly reduced the number of barnyard grass plants in crop. Awnless barnyard grass density was significantly affected by crop row spacing (Figure 8) with 71% fewer barnyard grass at 25 vs 50cm row spacing and >280% and >970% more barnyard grass when no crop was present compared to the 50cm and 25cm treatments respectively.
Figure 8. Awnless barnyard grass density (plants/m2) as influenced by wheat row spacing (cm) and the absence of crop. Density was assessed close to crop maturity on the 12th December 2018. Bars with a different letter are significantly different at the 5% significance level.
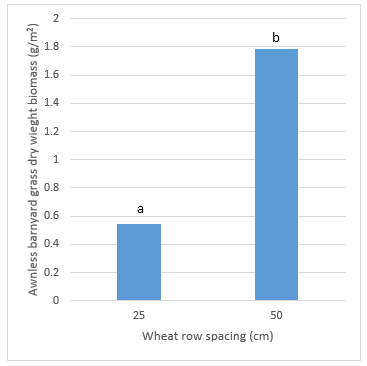
Growing wheat at a narrow row spacing significantly reduced barnyard grass biomass (Figure 9) with 70% lower biomass at 25cm row spacing compared with 50cm row spacing. In addition, there was a significantly greater biomass in the absence of a crop with an average biomass production of 93 g/m2.
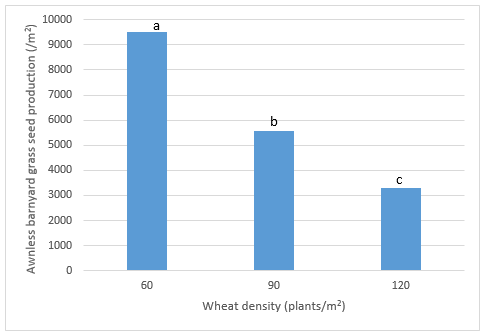
There was no impact of row spacing on barnyard grass seed production. However, greater crop density significantly reduced seed production (Figure 10) with greater seed production at 60 plants/m2 than at 90 plants/m2 and greater seed production at 90 plants/m2 than at 120 plants/m2.
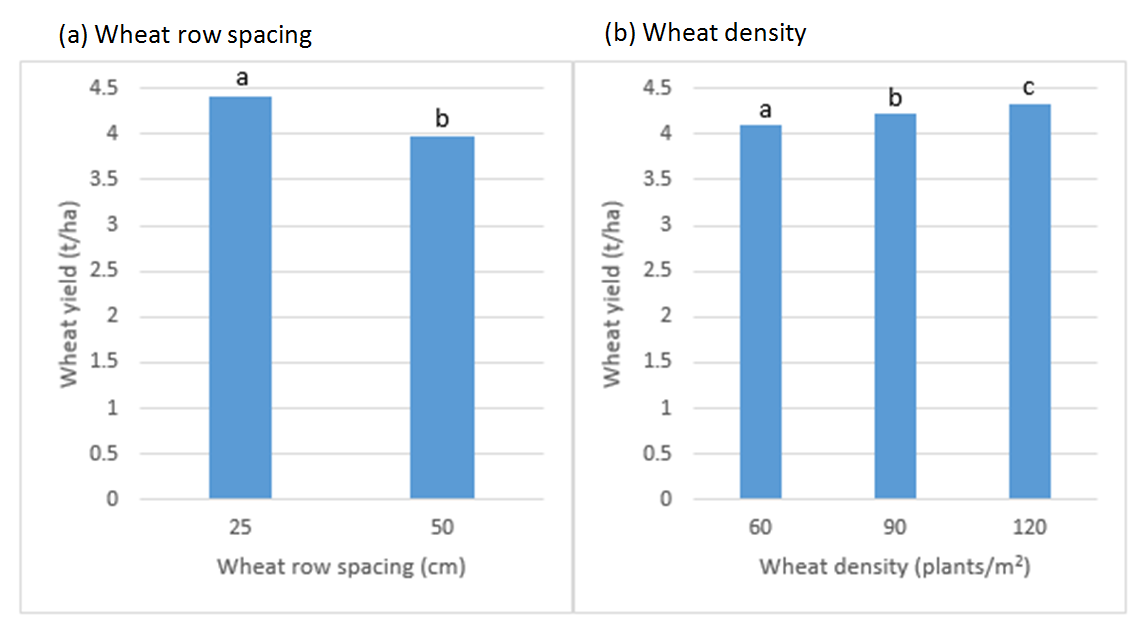
Wheat yield was significantly greater under competitive wheat crops of narrow row spacing and high wheat density (Figures 11a and 11b). Wheat yield was 10% greater at 25cm row spacing compared with 50cm row spacing, and 3% greater at a wheat density of 120 plants/m2 compared to 90 plants/m2.
Figure 9. Awnless barnyard grass dry weight biomass (g/m2)as influenced by wheat row spacing (cm). Bars with a different letter are significant at the 5% significance level.
Figure 10. Awnless barnyard grass seed production (seeds/m2) as influenced by wheat density (plants/m2). Bars with a different letter are significant at the at the 5% significance level.
Figure 11. Wheat yield (t/ha) as influenced by (a) wheat row spacing (cm) and (b) wheat density (plants/m2). Bars with a different letter within each graph are significant at the 5% significance level.
Implications
Results across the three crops; faba bean, chickpea and wheat, show that growing these crops at a narrow row spacing and increased crop density reduced weed biomass and seed production. Additionally, in these trials we generally saw a yield benefit at narrow row spacing and consistently at high crop density.
Current industry recommendation for optimising yield in both faba beans and chickpea is to grow the crops at a density of 30 plants/m2. In the northern region, there is a trend for both crops to be grown in wide rows of up to 1 metre.
Crop competition can serve as a complimentary tactic for in-crop weed control in combination with in-crop residual and knockdown herbicides. By using these tactics in combination, the pressure is being taken off the herbicide to do all the heavy lifting. As a result, growing a competitive crop can help to prolong the useful life of in-crop herbicides by delaying herbicide resistance. Furthermore, by reducing seed set in crop, future weed populations are likely to be less dense.
Our research highlights the high level of competition that wheat grown at narrow row spacing and high crop density can provide against early emerging summer weed species such as awnless barnyard grass. Increasingly, such weeds are emerging in winter crops at a crop growth stage when residual chemistries are no longer persistent in the soil and when in-crop herbicides are either unavailable or can no longer be applied. Growing a competitive crop will help to reduce these weed numbers and seed production.
The impact of row spacing and crop density on weed control and crop yield will differ with environment (soil types, climate, weed density). To address this issue, multi-site crop competition trials are also being conducted in Wagga Wagga (NSW DPI) and Narrabri (University of Sydney).
Other agronomic factors can also influence the competitiveness of these crops including variety choice, fertiliser placement and precision planting. Each of these factors will be examined in future multi-site trials in both winter and summer crops.
2. Crop competition in summer crops (UQ)
Background
Mungbean and soybean are nutritionally important grain legume crops in Queensland and New South Wales. In general, these crops are grown using a wide row spacing of up to 1-m. In widely spaced crop rows, weeds have a better chance to flourish due to plenty of available space for capturing light and other resources.
Herbicides are widely used to manage weeds in these legume crops; however, there are very limited post-emergence herbicide options. In addition, over-reliance on herbicides has resulted in the evolution of herbicide resistance in several weeds.These issues have forced industry to investigate the role of crop competition in managing weeds. This research investigated i) the effect of row spacing and weed infestation period on weed biomass and mungbean grain yield, and ii) the effect of seeding rate, row spacing and weed infestation period on weed biomass and soybean grain yield.
Materials and methods
Two experiments were conducted in 2015 and repeated in 2016 at the research farm of the University of Queensland, Gatton. The mungbean (cv. Jade-AU) experiment was established in a split-plot design with three replications. Main plots were mungbean row spacing (25, 50 and 75 cm) and sub-plots were weed infestation periods: weedy from planting to maturity, weedy from 3 wk after planting (WAP) to maturity, weedy from 6 WAP, and weed-free from planting to maturity.
The soybean (cv. Soy971) experiment was established in a split-split plot design with three replications. Main plots were seeding rates (40 and 80 kg/ha), sub-plots were row spacings (25 and 75 cm), and sub-sub-plots were four weed infestation periods (same as described above for the mungbean experiment). Rhodes grass (300 seeds/m2) was used as a model weed to create uniform density across the experiments. Weed biomass (oven-dried) was determined at 12 WAP. Both crops were harvested from a 12-m2 area and grain yield was converted to kg/ha at 12% moisture content. Data were subjected to ANOVA and means were separated using the least significant difference at 5% (LSD5%).
Results
Mungbean experiment
In both years, weed biomass was influenced by the interaction of row spacing and weed infestation periods (Table 1). Row spacing had no effect on weed biomass when plots were kept weedy from planting to maturity (0 WAP), whereas mungbean planted at 75 cm rows had greater weed biomass when plots were kept weedy beyond 3 WAP. In the 3 WAP weed infestation treatment, weed biomass was reduced by 60-70% in mungbean grown at 25 and 50 cm rows compared with 75 cm rows. In the 6 WAP weed infestation period, these values were 70-92%.
Table 1. Interaction effect of row spacing and weed infestation period on weed biomass in 2015 and 2016 (Chauhan et al. 2017).
Row spacing (cm) | Weed biomass (g/m2) | |||||
|---|---|---|---|---|---|---|
0 WAP | 3 WAP | 6 WAP | 0 WAP | 3 WAP | 6 WAP | |
2015 | 2016 | |||||
25 | 334 | 35 | 5 | 471 | 46 | 6 |
50 | 340 | 46 | 9 | 492 | 58 | 12 |
75 | 357 | 117 | 56 | 508 | 147 | 40 |
LSD 5% | 27 | 39 | ||||
[Weed infestation periods: Weedy from planting to maturity (0 WAP), weedy from 3 wk after planting (3 WAP), and weedy from 6 wk after planting (6 WAP)].
Mungbean grain yield was influenced by the interaction of row spacing and weed infestation periods in both years (Table 2). Row spacing had no effect on grain yield in the season-long weedy plots (0 WAP). However, mungbean planted at 25 and 50 cm rows produced higher grain yield than at 75 cm rows when plots were kept weedy beyond 3 WAP. In the weed-free environment also, mungbean planted at 75 cm rows had lower grain yield than at 25 and 50 cm rows, indicating that narrow row spacing may produce higher grain yield even in the absence of weeds.
For mungbean sown at 25 and 50 cm rows, the grain yield was similar between the plots kept weedy beyond 6 WAP and weed-free plots. However, this was not the case for mungbean planted at 75 cm rows, suggesting that the critical weed-free periods are longer for mungbean planted at 75 cm rows than at 25 and 50 cm rows.
Table 2. Interaction effect of row spacing and weed infestation period on mungbean grain yield in 2015 and 2016 (Chauhan et al. 2017).
Row spacing (cm) | Mungbean grain yield (kg/ha) | |||||||
|---|---|---|---|---|---|---|---|---|
0 WAP | 3 WAP | 6 WAP | WF | 0 WAP | 3 WAP | 6 WAP | WF | |
2015 | 2016 | |||||||
25 | 360 | 1240 | 2010 | 2203 | 177 | 1002 | 1644 | 1815 |
50 | 305 | 1000 | 1890 | 2025 | 159 | 887 | 1505 | 1653 |
75 | 200 | 630 | 1203 | 1620 | 113 | 449 | 928 | 1222 |
LSD 5% | 283 | 212 | ||||||
[Weed infestation periods: Weedy from planting to maturity (0 WAP), weedy from 3 wk after planting (3 WAP), weedy from 6 wk after planting (6 WAP), and weed-free from planting to maturity (WF)].
Soybean experiment
Weed biomass was not affected by seeding rates or its interaction with other factors. However, it was affected by the interaction of row spacing and weed infestation periods (Table 3). Row spacing had no effect on weed biomass in the season-long weedy plots (0 WAP), whereas plots that were weedy beyond 3 and 6 WAP had greater weed biomass in wider rows than narrow rows. In the 3 WAP weed infestation treatment, 55-58% weed biomass was reduced in soybean grown at 25 cm rows than at 75 cm rows. In the 6 WAP weed infestation period, these values were 80-82%.
Table 3. Interaction effect of row spacing and weed infestation period on weed biomass in 2015 and 2016 (Rasool et al. 2017).
Row spacing (cm) | Weed biomass (g/m2) | |||||
|---|---|---|---|---|---|---|
0 WAP | 3 WAP | 6 WAP | 0 WAP | 3 WAP | 6 WAP | |
2015 | 2016 | |||||
25 | 366 | 70 | 17 | 837 | 89 | 19 |
75 | 376 | 155 | 84 | 863 | 213 | 105 |
LSD5% | 34 | 17 | ||||
[Weed infestation periods: Weedy from planting to maturity (0 WAP), weedy from 3 wk after planting (3 WAP), and weedy from 6 wk after planting (6 WAP)].
As with the weed biomass, soybean grain yield was not affected by seeding rates or its interaction with other factors. However, it was affected by the interaction of row spacing and weed infestation periods in both years (Table 4). The lowest yield was obtained in the season-long weedy plots of the 75-cm spaced crop and the highest yield was obtained in the weed-free plots of the 25-cm spaced crop. Grain yield was higher in the crop planted at 25 cm rows compared with 75 cm rows in all weed-infestation treatments, except in the season-long weedy treatment in 2016. Soybean yield in narrow rows was 83-121% higher than in wider rows for the plots infested with weeds beyond 3 WAP, 63-65% higher for the plots infested with weeds beyond 6 WAP, and 14-21% higher for the weed-free plots.
Table 4. Interaction effect of row spacing and weed infestation period on soybean grain yield in 2015 and 2016 (Rasool et al. 2017).
Row spacing (cm) | Soybean grain yield (kg/ha) | |||||||
|---|---|---|---|---|---|---|---|---|
0 WAP | 3 WAP | 6 WAP | WF | 0 WAP | 3 WAP | 6 WAP | WF | |
2015 | 2016 | |||||||
25 | 550 | 1754 | 2356 | 2498 | 89 | 1934 | 2655 | 3043 |
75 | 428 | 959 | 1448 | 2191 | 86 | 875 | 1610 | 2525 |
LSD 5% | 94 | 114 | ||||||
[Weed infestation periods: Weedy from planting to maturity (0 WAP), weedy from 3 wk after planting (3 WAP), weedy from 6 wk after planting (6 WAP), and weed-free from planting to maturity (WF)].
Implications
The experiments demonstrated that narrow row spacing in mung bean and soybean resulted in increased grain yield and reduced weed biomass, particularly when weeds emerged beyond 3 and 6 WAP. The results suggest that the critical time of weed removal in these legume crops is likely to occur later in narrow than in wider row crops, indicating that weeds might be allowed to compete with these crops for longer periods in narrow than in wider row crops.
We did not evaluate weed seed production in these experiments but we know from other studies that weed biomass correlates well with weed seed production, so reducing weed biomass can be expected to also reduce seed production in weeds. To convince Australian growers to change their row spacing, there is a need to demonstrate the negative effect of narrow row spaced crops on weed growth and their fecundity.
Acknowledgements
The above research undertaken by QDAF was made possible by the contributions of growers through the support of the GRDC. The authors would like to thank them for their continued support.
References
Chauhan BS, Florentine SK, Ferguson JC, Chechetto RG (2017) Implications of narrow crop row spacing in managing weeds in mungbean (Vigna radiata). Crop Protection 95:116-119.
Llewellyn RS, Ronning D, Ouzman J, Walker S, Mayfield A and Clarke M (2016) Impact of Weeds on Australian Grain Production: the cost of weeds to Australian grain growers and the adoption of weed management and tillage practices. Report for GRDC. CSIRO, Australia.
Rasool G, Mahajan G, Yadav R, Hanif Z, Chauhan BS (2017) Row spacing is more important than seeding rate for increasing Rhodes grass control and grain yield in soybean (Glycine max). Crop and Pasture Science 68:620-624.
Contact details
Michael Widderick
Queensland Department of Agriculture and Fisheries
Leslie Research Facility
13 Holberton St, Toowoomba, Qld 4350
(07) 4529 1325
michael.widderick@daf.qld.gov.au
Bhagirath Chauhan
Queenland Alliance for Agriculture and Food Innovation (QAAFI)
The University of Queensland, Gatton
0427 923 272
b.chauhan@uq.edu.au
Varieties displaying this symbol beside them are protected under the Plant Breeders Rights Act 1994.
GRDC Project Code: US00084,
Was this page helpful?
YOUR FEEDBACK

