Farming systems site report – Narrabri, north west NSW
Author: Jon Baird (NSW DPI, Narrabri) and Gerard Lonergan (NSW DPI, Narrabri) | Date: 24 Jul 2018
Take home messages
- The baseline, high nutrients, high intensity and high legume systems resulted in the highest grain production at Narrabri. With differences in gross margins of the four systems due to the grain value of the crop choice in 2016. High intensity (wheat-canola-wheat) had highest gross margin, baseline and high nutrient (wheat-chickpea-wheat) the second and third highest gross margin and the high legume system (wheat-faba bean-wheat) the lowest gross margin of the top four systems.
- The baseline, high nutrients, high legumes and high intensity systems had the greatest crop water use efficiency in 2016 and in return the highest system gross margin per mm of rainfall. The low intensity system (which contained a summer cotton crop) had lower water use efficiency than the high diversity but greater system gross margin per mm due to the value of the summer crop in the low intensity system and frost damaged 2017 canola crop in the high diversity system.
- Pratylenchus thornei numbers were higher after a chickpea crop compared to faba bean and field pea in 2016, while canola and cotton reduced P. thornei numbers in the same season. The higher P. thornei numbers after the 2016 chickpea crop have continued through to December 2017 (post the 2017 wheat crop).
- There was no difference in wheat yield (2017) following chickpea, faba bean or canola grown in 2016.
Project background
While advances in agronomy and the performance of individual crops have helped grain growers to maintain their profitability, current farming systems are underperforming; with only 30% of the crop sequences in the northern grains region achieving 75% of their water limited yield potential.
Growers are facing challenges from declining soil fertility, increasing herbicide resistance, and increasing soil-borne pathogens in their farming systems. Changes will be needed to meet these challenges and to maintain the productivity and profitability of our farming systems. Consequently, The Department of Agriculture and Fisheries (DAF), New South Wales Department of Primary Industries (NSW DPI) and CSIRO are conducting an extensive field-based farming systems research program, focused on developing farming systems to better use the available rainfall to increase productivity and profitability, with the question;
Can systems performance be improved by modifying farming systems in the northern region?
This research question is being addressed at two levels by the northern farming systems initiative; to look at the systems performance across the whole grains region, and to provide rigorous data on the performance of local farming systems at key locations across the region.
Research began with local growers and agronomists in 2014 to identify the key limitations, consequences and economic drivers of farming systems in the northern region; to assess farming systems and crop sequences that can meet the emerging challenges; and to develop the systems with the most potential for use across the northern region.
Experiments were established at seven locations; a large factorial experiment managed by CSIRO at Pampas near Toowoomba, and locally relevant systems being studied at six regional centres by DAF and NSW DPI (Table 1). Several of these systems are represented at every site to allow major insights across the northern region, while the site specific systems will provide insights for local conditions.
The following report details the systems being studied in Narrabri how they are implemented locally and the results after the first three years. Data and system performance indicators have been developed to compare performance across sites.
Table 1. Summary of the regional farming systems being studied at each location in the northern farming systems initiative
System | Regional sites | |||||
|---|---|---|---|---|---|---|
Emerald | Billa Billa | Mungindi | Spring Ridge | Narrabri | Trangie x2 | |
Baseline – represents a typical zero tillage farming system | * | * | * | * | * | * |
Higher nutrient supply – as for the ‘baseline’ system but with fertilisers for 100% phosphorus replacement and nitrogen targeted at 90% of the yield potential each season | * | * | * | * | * | * |
Higher legume - 50% of the crops are sown to legumes | * | * | * | * | * | * |
Higher crop diversity – a wider range of crops are introduced to manage nematodes, diseases and herbicide resistance | * | * | * | * | * | |
Higher crop intensity – a lower soil moisture threshold is used to increase the number of crops per decade | * | * | * | * | * | |
Lower crop intensity – crops are only planted when there is a near full profile of soil moisture to ensure individual crops are higher yielding and more profitable | * | * | * | * | * | |
Grass pasture rotations – pasture rotations are used to manage soil fertility. One treatment has no additional nitrogen fertiliser, while the other has 100 kg N/ha/year to boost grass production | Grass | |||||
Higher soil fertility (higher nutrient supply plus organic matter) - as in the high nutrient system but with compost/manure added | * | * | ||||
Integrated weed management (incl. tillage) – this system is included at Emerald where crops, sowing rates, row spacings and ‘strategic tillage’ are included to manage weeds and herbicide resistance | * | |||||
Narrabri farming system research site
The Narrabri farming system research site is located on the University of Sydney research farm - “Llara” (-30.263321, 149.860037). “Llara” is representative of the dryland farming operations throughout north-west NSW. The soils are predominately chocolate vertosols and have a plant available water capacity of 190 mm to a depth of 120 cm. The site has a long history of high productivity and has been under a controlled traffic system for many years. The first season of the farming system project was winter 2015, where wheat was grown across all systems to ensure the site had a consistent starting base.
Traditionally, the dryland farming systems grown in the Narrabri region are winter cereal dominated, with summer crops such as sorghum or dryland cotton planted on an opportunity basis. In recent years there has been a push by growers to bring summer crops into a routine cropping rotation due to the greater crop gross margin returns and to utilise summer rainfall. Another benefit of growing summer crops is the increase of cropping diversity that may reduce the amount of soil borne disease (e.g. crown rot) that have caused great productivity loss in the area.
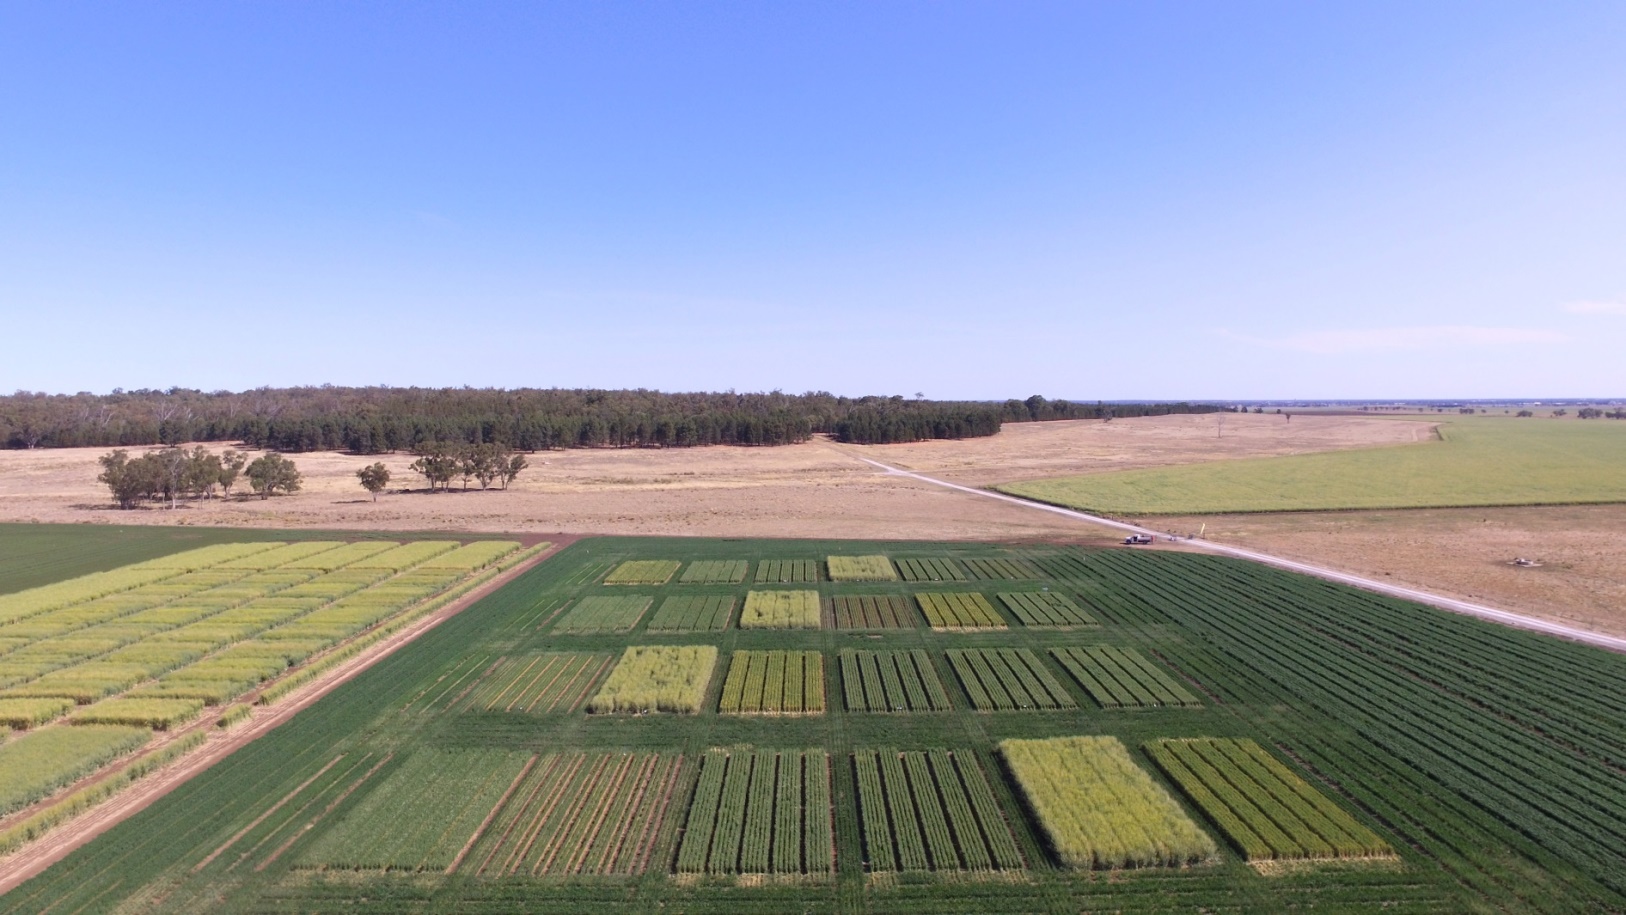
Figure 1. Narrabri farming systems site – 20 September 2017
Cropping sequence at the Narrabri farming systems site
Wheat was planted in the winter of 2015 across all systems to establish a consistent base allowing various crops to be planted in the 2016 cropping year. Early rain provided good establishment and early plant vigour, but a dry finish to the 2015 winter meant yield was quite low (2.1 t/ha) and grain size was small.
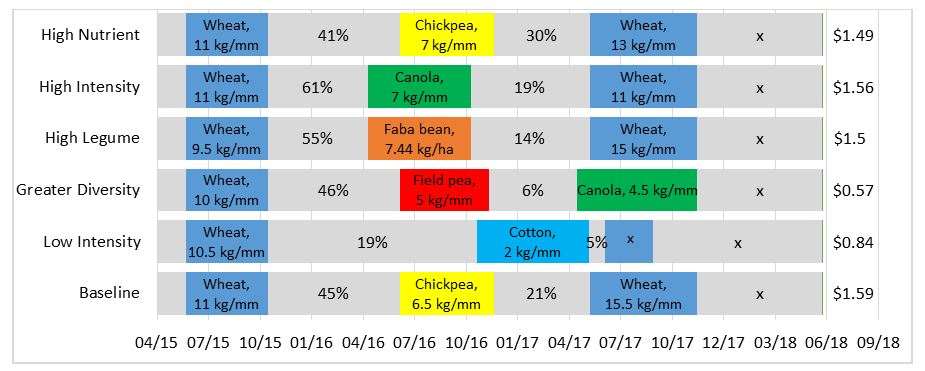
The 2016 winter saw chickpeas planted as the industry standard baseline and also as a high nutrient system. The industry standard was in line with local grain growers who planted above average hectares of chickpeas to take advantage of the higher chickpea grain price. Field peas and faba beans were planted in the greater diversity and higher legume systems respectively, while canola was planted in the high intensity system. The low intensity system was kept as winter fallow and initially planned for long fallow through to summer 2017/18, but high rainfall during the winter of 2016 filled the soil profile and thus the system was planted to cotton in November 2016 (Figure 2).
In autumn 2017 all the systems, except for the low intensity system which was following a summer cotton crop, had good soil moisture levels that triggered crop plantings during the optimum window for the specific crops (canola planted on 19th of April and wheat planted on 11th May). This saw the baseline, high nutrients, high crop intensity and high legume systems return to cereal plantings. The greater diversity system was planted to canola following the 2016 field peas. To prevent soil degradation, barley was planted as the cover crop in the low intensity system but sprayed out prior to booting. The 2017 winter crops received considerably less in-crop rainfall compared to the 2016 winter crops (184 mm verses 450 mm) and unfortunately a number of heavy frosts occurred during August/September which greatly impacted the 2017 canola yield.
Figure 2. Cropping sequence and fallow length of the six farming systems at Narrabri
Grain/lint yield
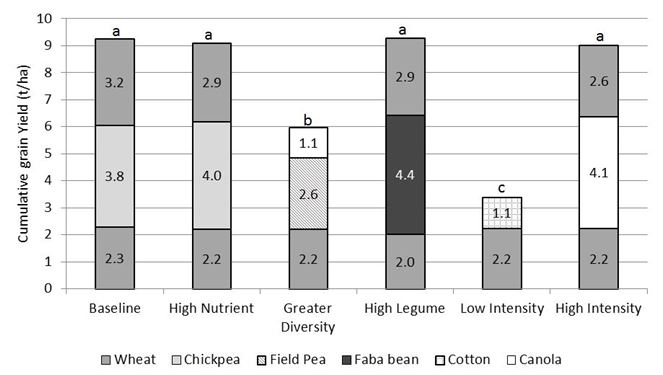
The cumulative yield of the six systems (Figure 3) highlight the similar productivity of the baseline, high nutrients, high legume and high intensity systems (9.3, 9.1, 9.3, and 9 t/ha respectively). As stated before, the baseline and high nutrient system followed similar cropping sequences (Wh-Ch-Wh), while the high legume contained faba beans (Wh-Fb-Wh) and the high intensity had canola (Wh-Can-Wh) during the 2016 winter. These four systems produced significantly more total grain (or grain + lint) than both the greater diversity and low intensity systems (5.95 and 3.4 t/ha respectively). These lower yielding systems received unfavourable growing conditions during 2017. The low intensity system, which had cotton in the 2016/17 summer, received large yield penalties due to the extreme heat during the important boll development stage. While the 2017 canola crop (greater diversity system) received a number of frosts during late August/ early September (during the flowering/ pod fill stage) that devastated final yield.
System economics
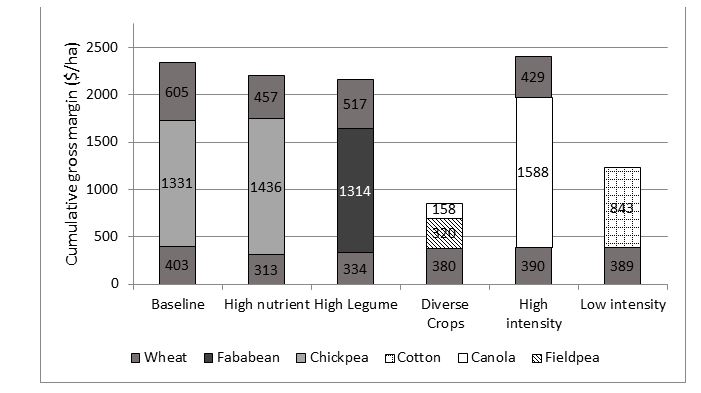
After the first three growing seasons of the farming systems trial at Narrabri, the high intensity system has the greatest cumulative gross margin with $2407/ha or $802/ha/yr (Figure 4). The baseline system had similar system gross margin with $2339/ha, while the high nutrient system was $133/ha less than the baseline system due to the extra cost of the higher applied fertiliser rate. The high legume system had the next highest gross margin with $2165/ha. The difference in gross margins of the top four systems is primarily driven by the grain value of the crops planted in 2016. Of the crops grown in 2016, chickpea (baseline and high nutrients) and canola (high intensity) had the highest grain value ($504/t and $503/t respectively), followed by faba bean (high legume - $382/t). It is noted that grain prices used for the farming system project’s gross margin analysis are 10 year median grain prices (Brisbane port) less transport costs ($40/t) across all northern farming system sites. This was to ensure there is no confusion between biophysical characterisations of each site and changes in transportation/market costs between sites.
The low crop intensity system which grew two crops in the three seasons (one less than the other farming systems) had the second lowest gross margin at Narrabri with $1232/ha. While the greater diversity system resulted in the lowest gross margin of the six Narrabri farming systems ($858/ha).
These results highlight the impact of the harsh growing conditions during the summer of 2016/2017 and the winter of 2017. The cotton crop (low intensity system) had a gross margin of $843/ha, the second lowest returning crop for the 2016 planting season. While the greater diversity system had the two lowest retuning crops, field peas ($320/ha - 2016) and canola ($158/ha - 2017).
Water use efficiency
The low intensity system (with the two harvested crops from the three seasons) had the lowest fallow efficiency (the proportion of rainfall available to the next crop) and lowest crop water use efficiency (kg yield/mm crop water use) in 2016 (cotton – 2 kg /mm) (Figure 5). Conversely the high intensity system resulted in the highest fallow efficiency to date (61% 2015/16 summer fallow). Although there were five different crops planted in 2016, all systems resulted in similar crop water use efficiency in 2016, except the low intensity system (cotton). The impact of the 2017 frost damage on the greater diversity system (canola) is highlighted by the crop’s water use efficiency of 4.5 kg/mm (which is the lowest efficiency rating for crops harvested in 2017), compared to the high intensity canola crop (2016) which had 7 kg/mm water use efficiency.
From the cropping sequences at Narrabri, we are able to compare the water use efficiency of wheat grown from two different seasons in the same system. The water use efficiency for both the baseline and the high legume systems were 4.5 and 5 kg/mm higher in 2017 compared to 2015, even though there was similar in crop rainfall for both the seasons (approx. 180 mm). A difference of the two seasons is that the 2017 crop was planted with an extra 35 mm of plant available water compared to the 2015 wheat crop and yield for both systems were 0.9 t/ha greater in 2017 compared to 2015.
Baseline, high nutrient, high legume and high intensity systems all had similar system water use efficiency (system gross margin per mm of rainfall). These four systems are had greater efficiency than the low intensity and greater diversity systems. The greater diversity system had the lowest system water use efficiency ($0.57 ha/mm) due to the poor gross margin of its 2016 field pea crop and the frost impacted 2017 canola crop. The long fallow periods in the low intensity system did reduce the system efficiency ($0.84 ha/mm), but it must be noted that the system had the highest plant available moisture (> 40 mm) than the other five systems at the completion of the 2017 cropping season (15/12/2017).
Figure 5. Crop water use efficiency, fallow efficiency and system gross margin per mm of rainfall for the six Narrabri farming systems up to the harvest of the last crop. Coloured bars represent crop choice and water use efficiency; grey bars contain the fallow efficiency or the proportion of rainfall available to the next crop.
Soil pathogens
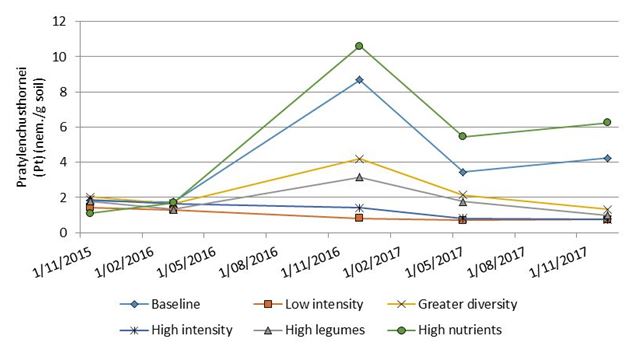
Of the 18 soil pathogens tested pre and post every crop within the farming system project at Narrabri, Pratylenchus thornei results have shown a strong system related trend during the first three seasons. Crop choice during the 2016 season had the biggest impact on P. thornei numbers, with chickpeas (PBA HatTrick) grown in the baseline and high nutrient systems increasing P. thornei numbers by up to 5 times the pre-sown number.
The other legumes planted in 2016 (field pea - PBA Oura (greater diversity) and faba bean – PBA Warda (high legumes)) also increased P. thornei numbers but not to the extent of the chickpeas. The cotton (Sicot 748B3F) and canola (44Y89) in the low and high intensity systems respectively decreased the number of P. thornei in the soil during the 2016 winter. Although P. thornei did increase to moderate levels in 2016 within the baseline and high nutrient systems, no yield impact was recorded as chickpea yield equaled 3.8 t/ha for the baseline and 4 t/ha for the high nutrient system.
While P. thornei numbers across all six systems did reduce during the 2016/17 summer fallow, P. thornei numbers in both the baseline and high nutrient systems increased slightly during the 2017 winter wheat crop (Longreach Lancer). As a result both these systems had more than three times the P. thornei numbers than the other four farming systems at the end of 2017. Conversely the other four farming systems continued to reduce P. thornei numbers during 2017 and had approx. 1.2 nematodes/g soil (Figure 6) at the end of 2017.
To date the higher nematode numbers in the baseline and high nutrient systems have not impacted yield as there is no difference in yield from the 2017 wheat planted in the baseline, high nutrients systems with the high legume and high intensity systems (all systems were planted to the same wheat variety in 2017 - Longreach Lancer ). These results complement industry guidelines as Longreach Lancer is rated as moderately susceptible in terms of increasing P. thornei numbers (NSW DPI winter crop variety sowing guide 2018). However Lancer is tolerant-moderately tolerant to P. thornei, therefore moderate levels of P. thornei are not expected to cause any yield impact.
Figure 6. Pratylenchus thornei at the Narrabri farming system site
Conclusion
From the first three seasons at the Narrabri farming systems research site, the crop choice of the 2016 winter had the biggest impact on system gross margins and productivity, with the wheat-chickpea-wheat sequence and wheat-canola-wheat resulting in high grain yield and the highest gross margins. This result is due to the 2016 winter crops being significantly higher yielding than both the 2015 and 2017 winter seasons and the grain value of chickpea and canola in 2016 resulted in higher gross margins for the baseline and high intensity systems compared to the other four farming systems at Narrabri.
Although the sequence within the baseline and high nutrients systems have resulted in high grain production and system gross margins, the two-crop rotation does not reflect well for best management practice in the area. Of particular concern are long term implications on crop disease and nematode numbers (in particular Pratylenchus thornei). Future crop selections for the baseline and high nutrient systems will need to take into account the varieties’ susceptibility to Pratylenchus thornei.
Acknowledgements
The research undertaken as part of this project (DAQ00190) is made possible by the significant contributions of growers through both trial cooperation and the support of the GRDC, the author would like to thank them for their continued support. We must also acknowledge the assistance provided by staff at the University of Sydney research farm – ‘Llara’.
Contact details
Jon Baird
NSW Department of Primary Industries
21888 Kamilaroi Highway, Narrabri 2390
Ph: 02 67991520
Email: jon.baird@dpi.nsw.gov.au
Varieties displaying this symbol beside them are protected under the Plant Breeders Rights Act 1994.
GRDC Project Code: DAQ1406-003RTX,
Was this page helpful?
YOUR FEEDBACK


