Reserve phosphorus (P) and potassium (K) availability and release in northern region soils; effects of flooding and fertiliser bands
Author: Chris Guppy (University of New England), Phil Moody (Department of Environmental Science, Qld), Matt Tighe (University of New England) | Date: 24 Jul 2018
Take home messages
- Blends of muriate of potash with ammonium phosphates and calcium phosphates may initially decrease soil solution phosphorus (P) particularly under wide row spacings at rates normally put down in deep bands.
- Potassium (K) application may best be done separately (spatially) to P and nitrogen (N) applications to limit formation of less soluble reaction products.
- Extended incubation of fertiliser bands suggests that compounds continue to drop out of soil solution with time and thus may not readily become plant available. Soil testing is ongoing to determine if this risk is high.
- Extended flooding mobilises reserve P and K minerals if soil carbon levels are high, mainly through acidification of alkaline soils and reduction of iron (Fe) and manganese (Mn) compounds releasing the bound P.
Introduction
Declining soil fertility in the northern grains region has resulted in novel fertiliser application strategies and an awareness of the changes in phosphorus (P) and potassium (K) availability needed to increase grain production and optimise fertiliser recovery. Large reserves of P and K may exist in these soils and we have limited understanding of how to quantify them and how long they may remain to replenish existing available P and K sources. This brief paper updates growers and advisers on recent results related to fertiliser bands and flooding effects on the release and availability of P and K to the soil solution, and hence to plants.
Method
Fertiliser bands
The effect of mixing fertiliser in bands was tested on 4 soils with differing properties from the northern grains region. The four soils were: soil 1: Ferrosol (0-10cm); soil 2: upland Vertosol (0-10cm); soil 3: grey Vertosol (10-30 cm); soil 4: Kandosol (10-30 cm). Fertiliser rates equivalent to those occurring in the field (g fertiliser/m crop row @ 1m row spacing) were converted to (mg fertiliser/g soil) and incubated at field capacity for 10 days.
Fertiliser forms were applied to supply the following nutrient rates: N (nitrogen) 100kg/ha; P (phosphorus) 40kg/ha; K (potassium) 100kg/ha; and S (sulfur) 30kg/ha.
Treatments were:
- MAP (mono-ammonium phosphate) @ 40 kg P/ha (not balanced for N)
- MAP (as above) + KCl (potassium chloride)
- DAP (di-ammonium phosphate) @ 40 kg P/ha (not balanced for N)
- DAP (as above) + KCl (potassium chloride)
- TSP (Triple Superphosphate) @ 40 kg P/ha (balanced for N)
- TSP (as above) + KCl (potassium chloride)
After 10 days and 30 days, a 1:1 saturated paste was created with dried soil (25 g dried soil/25 mL deionised water water) and allowed to equilibrate for 16 hours before centrifugation and analysis of the soil solution pH and solution P concentration.
Flooding
Effects of flooding on P and K pools of 12 northern grains region soils were tested in two independent experiments carefully designed to maintain anaerobic conditions throughout. The first experiment used 4 soils and sampled over time to determine how long to incubate soils before they had reduced enough to see the effects of flooding on soil chemistry. Reduced soils (those with an Eh <100mV) have lost all of their free oxygen, and other oxidised species are used to accept electrons as carbon compounds are reduced. A further 8 soils, to increase the range of northern grains region soils examined were then flooded for 30 days prior to analysis.
Soils were simply maintained at field capacity prior to extraction (aerated), or flooded permanently and spiked with sugar to ensure soil carbon was high enough to use all of the oxygen and reduce the soils (anaerobic). CaCl2- P and K, exchangeable K, Colwell- and BSES-P and tetra-phenyl borate extractable K (TBK), along with pH, Eh and electrical conductivity (EC) were then measured.
Results
Fertiliser bands
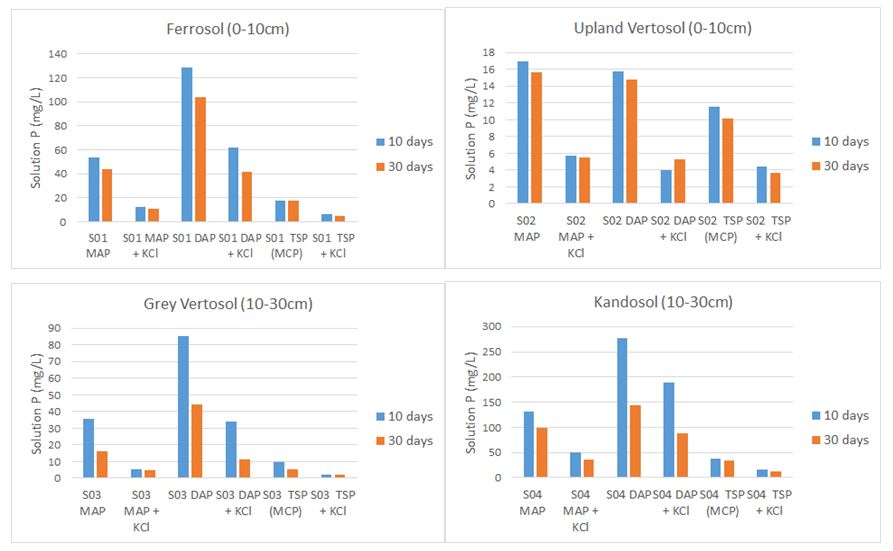
The effects of fertiliser form on soil solution pH and P concentration are shown in Figure 1. In all soils addition of KCl decreased soil pH and solution P concentration perhaps because of the increased ionic strength in the soil solution.
Figure 1. Effect of fertiliser form on soil solution pH and P concentration in fertiliser bands after 10 and 30 days incubation at field capacity for four soils from the northern grains region. Treatments in order from left to right are MAP, MAP and KCl, DAP, DAP and KCl, TSP, and TSP and KCl.
In soils 1, 3 and 4, solution P concentrations declined in the order: DAP>MAP>TSP; for soil 2, solution P concentrations were DAP=MAP>TSP. The addition of KCl to all P forms decreased solution P concentration in all soils.
The addition of KCl to any P source reduced soil pH (Figure 1). The pH is lower because the ionic strength (saltiness) is much higher, and H+ ions are displaced from the soil surface. As the pH is lower, the likelihood that the loss of P from soil solution is due to the formation of calcium phosphates is less likely. This has been suggested by researchers in the past, as the high K+ addition, displaces Ca2+, raising the solution Ca and P concentrations to levels that may result in formation of calcium phosphates relative to the simple P additions alone. We are investigating if the lower soil pH associated with MAP relative to DAP when combined with KCl may have promoted the formation of potassium taranakites (potassium aluminium phosphates) or potentially struvites (magnesium ammonium phosphates). This may explain the lower solution P concentration observed in both soils with MAP+KCl than with DAP+KCl.
Over time the loss of P from solution following the addition of K did not reverse, and P availability decreased further as P reacted with soil surfaces within the band. Further work is needed to see what available P soil tests indicate about the effect of K addition to fertiliser bands is over time.
Flooding
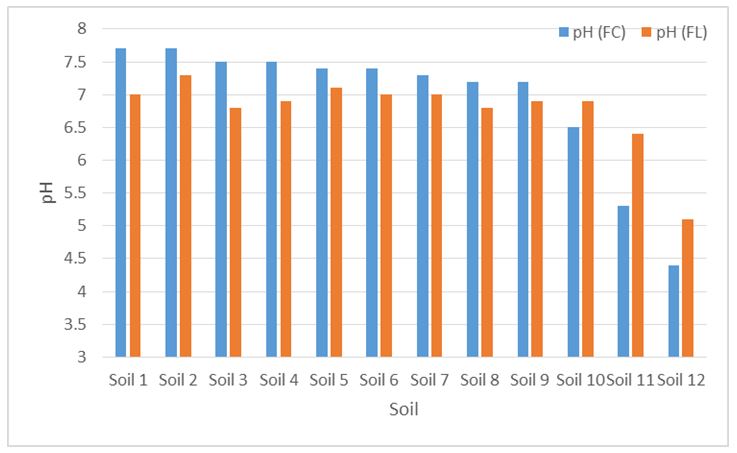
pH & Eh
The pH of flooded soils were 0.3–0.7 unit lower than when aerated, when starting pH was alkaline. Acidic soils increased in pH upon flooding (Figure 2). All soils were anaerobic after 30 days flooding with Eh values ranging from -90 to -134 mV. These results are as expected when soil is flooded. Soils tend toward a pH of 7, and, if adequate carbon is present for microbial activity, flooded soils will have lower oxidation. The tendency for pH to rise in acidic flooded soils occurs because H+ is consumed as oxidised compounds are reduced (NO3, Mn oxide, Fe oxide, etc), releasing hydroxide (OH-) and raising pH. In alkaline soils, the increase in respired CO2 dominates. This dissolves in the water at higher concentrations, producing carbonic acids that lower the pH. Most flooded soils then end up with a pH between 6.7-7.2.

Soil solution P and K (CaCl2 extractable P/K)
Calcium chloride extractable P increased by 2–10 fold in most soils when flooded for 30 days (Table 1). Whilst solution P concentrations were typically low (1-4 mg P/kg), an increase in solution P concentration after flooding is likely, because the Fe (iron) oxide surfaces to which P is strongly attracted will dissolve; releasing the P. Flooding increased the CaCl2–K in all studied soils by a factor of 3 (Table 1). Solution extractable K was 10-50% of exchangeable K in the range of soils tested. Part of the increase in solution K may be associated with dilution of the soils when flooded, but also related to cation exchange with soluble Fe2+.
Table 1. Percentage (%) change in extracted P and K values for the 8 soils investigated in Experiment 2 incubated for a full 4 weeks under flooded conditions. Soils are ordered from alkaline to acid starting pH at field capacity and responses are the average of three replicates.
CaCl2 P | CaCl2 K | Exchangeable K | BSES P | BSES K | Colwell P | TBK | |
|---|---|---|---|---|---|---|---|
Soil 1 | 339 | 31* | -16 | 33 | 5 | -11 | 3 |
Soil 2 | 279 | 94* | -8 | -2 | -2 | 7 | -7* |
Soil 4 | 157* | 89* | -3 | -62* | -6 | 33* | -10* |
Soil 7 | 71 | 94* | 3 | 38* | 6 | 47* | -19* |
Soil 9 | 1149* | 61* | -7* | 298* | 20 | 152* | -36* |
Soil 10 | 405 | 137* | 2 | -6 | 0 | 41* | -2 |
Soil 11 | 142 | 101* | 8 | 1 | -3 | -7 | 15 |
Soil 12 | -13 | 167* | 41* | 274* | 22* | 30* | 10 |
* Indicates significant increase or decrease in extractable concentration of P or K.
Note that some changes, though larger than other significant effects were not different, as the variation between replicates was higher in those soils.
Exchangeable K and Colwell P
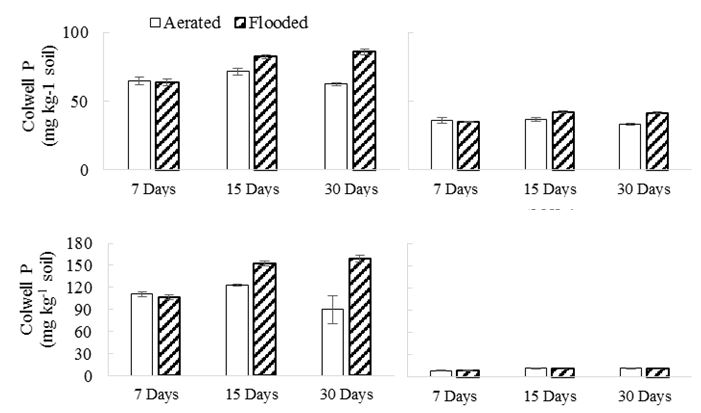
Eight of the twelve experimental soils in this study showed a significant increase (greater than 15%) in Colwell P when flooded (Table 1, Fig. 3). The increase in Colwell P of flooded soils in Experiment 1, (except in soil 4), was only observed at the second and final sampling, 15 and 30 days after flooding indicating that at least 2 weeks flooding is needed to reduce the soils and release the P (Figure 3). Increased Colwell-P values are expected on flooding due to reduced fixation to oxidic soil colloids that dissolve, releasing the P to the soil solution.
Exchangeable K did not change in response to 30 days of inundation in most soils. As exchangeable K measurements usually include solution K measurements, the redistribution of K upon flooding resulted in no change. Other studies have observed slightly reduced exchangeable K because the permanent charge is lower when the Fe is reduced. We did not observe that in our study.

BSES–P, BSES–K and TBK
BSES-P was not consistently affected by flooding. This was slightly unexpected, as previous work has demonstrated that acidification of solution does mobilise Ca phosphate sources, and flooding soil should lower solution P concentrations and encourage minerals to dissolve. Over time, we expect that this will happen, and at least some of the soils did have higher BSES-P and Colwell-P values following flooding.
BSES-K is not a routine soil test, and was correlated with exchangeable K (R2 = 0.7) but not with TBK (R2 = 0.4). BSES-K ranged between 25 and 60% of the values extracted by TBK. BSES-K was not affected by flooding soils. Higher solution K in 4 soils after flooding was accompanied by lower TBK and lower pH compared to the aerated ones. This may be associated with dissolution of some of K minerals in soils, e.g. micas and feldspars, in response to increasing acidification.
Conclusions
Band applied fertilisers have effects on soil solution pH, and solution P, Ca, Mg and K concentrations. In general, KCl addition with MAP, DAP and TSP lowers solution P concentration relative to the single P form added alone.
Irrespective of the bioavailability of the reaction products, the effect of KCl decreasing solution P concentration when applied with any P form will decrease the diffusion rate of P away from the fertiliser band, thereby reducing P supply rate to crop roots relative to the P form applied alone.
When soils are flooded, the main driver of change in P and K release is the shift in pH associated with redox changes in the soil. Alkaline soils fall in pH, and hence P and K minerals may dissolve. Acid soils increase in pH, and hence have a smaller effect on reserve P and K release. Practically, flood events do mobilise P and K, however the amount mobilised and the forms the minerals re-precipitate in upon oxidation following flooding are yet to be determined.
Acknowledgements
The research undertaken as part of this project is made possible by the significant contributions of growers through both trial cooperation and the support of the GRDC, the author would like to thank them for their continued support. Result presented arose from GRDC funded projects UNE00022 and UQ00078.
Contact details
Chris Guppy
University of New England
Agronomy and Soil Science, UNE, Armidale, NSW 2351
Ph: 02 6773 3567
Fx: 02 6773 3238
Email: cguppy@une.edu.au
GRDC Project Code: UNE00022; UQ00078,
Was this page helpful?
YOUR FEEDBACK

