The efficacy of chaff lining and chaff tramlining in controlling problem weeds
Take home messages
- Use chaff lining or chaff tramlining concentrates weed seeds into a narrow area.
- A heavy layer of chaff will lead to better suppression of weed emergence.
- Small seeded broadleaf weeds (e.g. common sowthistle) are more easily suppressed than grass weeds with larger seeds (e.g. annual ryegrass).
- Thick tramlines and chaff lines reduce but do not prevent weed emergence, so other measures may be needed to control weeds in tramlines/chaff lines (e.g. spraying the tramlines with a shielded sprayer).
Background
Herbicide resistance is a major concern for northern region crop production due to the increasing frequency of resistance in key weeds. Of particular concern is the increasing incidence of glyphosate resistance, with 9 weed species now confirmed as glyphosate resistant in the northern region (Heap, 2018). Regardless of the ever-increasing frequency of herbicide-resistance, herbicides will likely remain the most effective form of weed control in cropping systems. However, for herbicides to remain effective, non-herbicide weed management alternatives are needed to delay the spread and onset of further herbicide resistance (Walsh et al., 2013). One such alternative is harvest weed seed control (HWSC).
In this paper we report on research evaluating the effectiveness of chaff tramlining and chaff lining as harvest weed seed control tactics for northern region weeds.
Chaff lining and chaff tramlining are forms of harvest weed seed control (HWSC) that have potential for widespread adoption in northern Australia owing to their relative low cost and ease-of-implementation. Chaff tramlining is the practice of concentrating the weed seed bearing chaff material on dedicated tramlines in controlled traffic farming (CTF) systems. Chaff lining is a similar concept, where the chaff material is concentrated in a narrow row between stubble rows directly behind the harvester. The chaff environment is likely to be suboptimal for seed persistence and seedling establishment, therefore, this practice has the potential to be as effective as other forms of harvest weed seed control in depleting weed seed banks.
Aim
To evaluate the influence of different amounts and types of chaff on weed seedling emergence.
Method
Pot experiments were conducted at Narrabri and Toowoomba. There were some variations on the method used at each location (i.e. type and dimensions of experimental unit e.g. pot versus trays), but the basic method involved 4 replicates of each experimental unit (pot or tray filled with potting mix and sown with either 100 or 200 weed seeds on the surface), with 8-9 rates of chaff (either wheat or barley). A pre-weighed layer of chaff was added to the surface of each pot at the equivalent rates of 0, 3, 6, 12, 18, 24, 30, and 42 t/ha. Once the chaff was evenly spread across the soil surface, the pots were watered thoroughly and kept moist for 28 days, over which time weed emergence was recorded. Differences between chaff types and rates were assessed using the total germination over a 28 day period.
The chaff rates used in the pot experiments were designed to mimic the rates of chaff that may occur in a field situation. To calculate the rates of chaff that might be expected in a field situation, the following formula was used:
Y = 0.3 x Z x (harvester width/tramline width)
Where Y = chaff yield and Z = grain yield of wheat
Note: assuming chaff yield is 30% of grain yield
This formula is based on previous experimentation in wheat (data not shown), where chaff yield was determined to represent approximately 30% of the grain weight. For example, using a wheat yield of 3.5 t/ha, a 12m harvester width and a 30cm chaff line width, the amount of chaff concentrated into a chaff line would be 42 t/ha.
Statistical analysis
The treatments used in the Narrabri pot experiment were 8 rates of wheat chaff laid out in a randomised complete block design with four replicates to explore emergence of annual ryegrass. The Toowoomba-based pot experiment was a factorial combination of eight rates by two chaff types (wheat and barley) by two weed species (annual ryegrass and common sowthistle), also laid out in a randomised complete block design with latinisation of the treatment.
The emergence data from both the Toowoomba and Narrabri pot experiments were transformed using angular (or arcsine) transformation and predictions back-transformed. The data were analysed using ANOVA or REML procedure in Genstat 19th Edition (VSN International, 2017). In the analysis of the Toowoomba-based pot experiment the rate and chaff type treatments were partitioned for each weed species. The level of significance was set at 5% for all testing. The protected least significant test (LSD) was used for pair-wise comparisons of significant treatment effects.
Results and discussion
Annual ryegrass
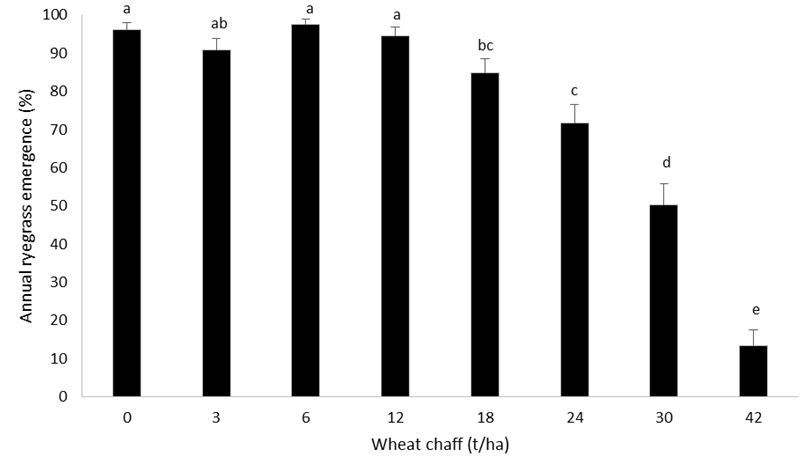
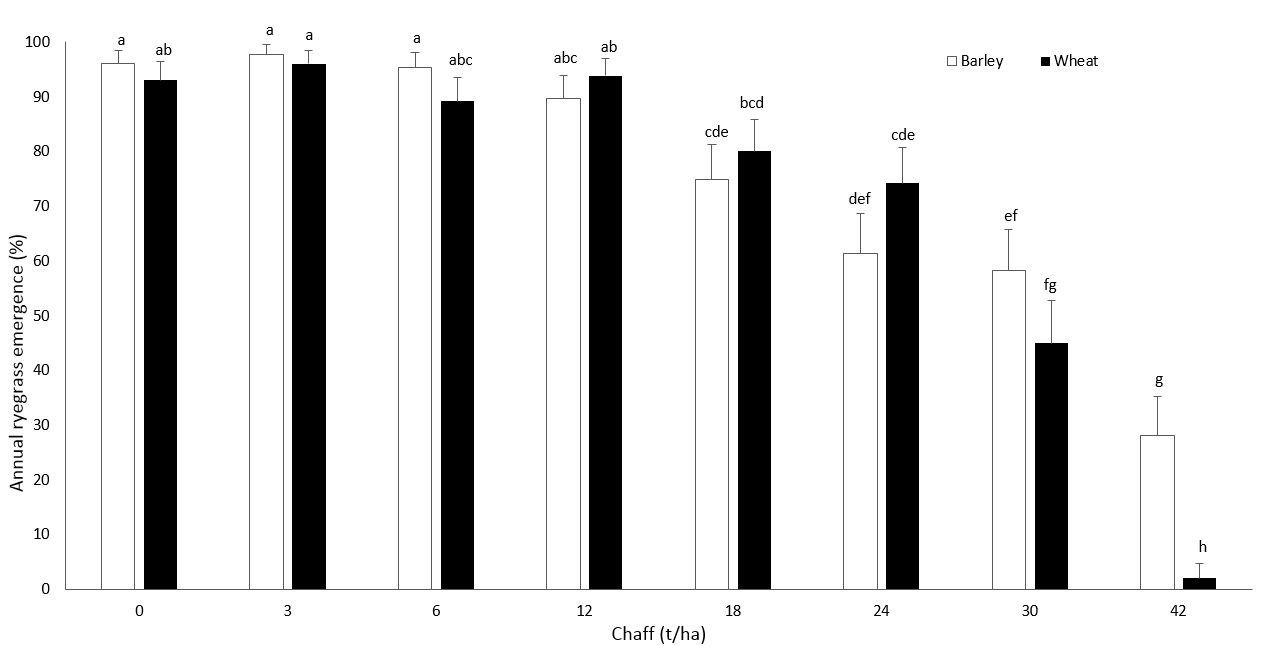
In both the Narrabri (Figure 1) and Toowoomba (Figure 2) pot experiments; there was a consistent reduction in annual ryegrass emergence with increasing amounts of wheat chaff. More detailed results including the LSDs used to compare treatments are presented in the Appendix. Relative to the zero chaff treatment, emergence of annual ryegrass was reduced by the presence of wheat chaff at rates equal to and over 18 t/ha and 24 t/ha in the Narrabri and Toowoomba experiment, respectively.

Figure 1. Emergence of annual ryegrass through wheat chaff at 8 different rates (t/ha) in a pot experiment conducted at Narrabri, NSW
 Figure 2. Emergence of annual ryegrass through barley and wheat chaff at 8 different rates (t/ha) in a pot experiment conducted at Toowoomba, QLD
There was an interaction between chaff amount (weight) and chaff type (barley vs wheat) on annual ryegrass emergence. There was no significant difference between chaff types at rates = 0, 3, 6, 12, 18, 24 and 30 t/ha. At 42 t/ha of barley chaff there was greater annual ryegrass emergence than at the same amount of wheat chaff (Figure 2).
At the greatest chaff rate (42 t/ha), annual ryegrass emergence from wheat chaff was 14% in the Narrabri experiment and 2% in the Toowoomba experiment. In the case of barley chaff, emergence was much greater (28%) at the 42 t/ha chaff rate. The Toowoomba pot experiment is currently being repeated to confirm the results of the first experiment and an additional greater chaff amount (60 t/ha) treatment is being used.
Common sowthistle
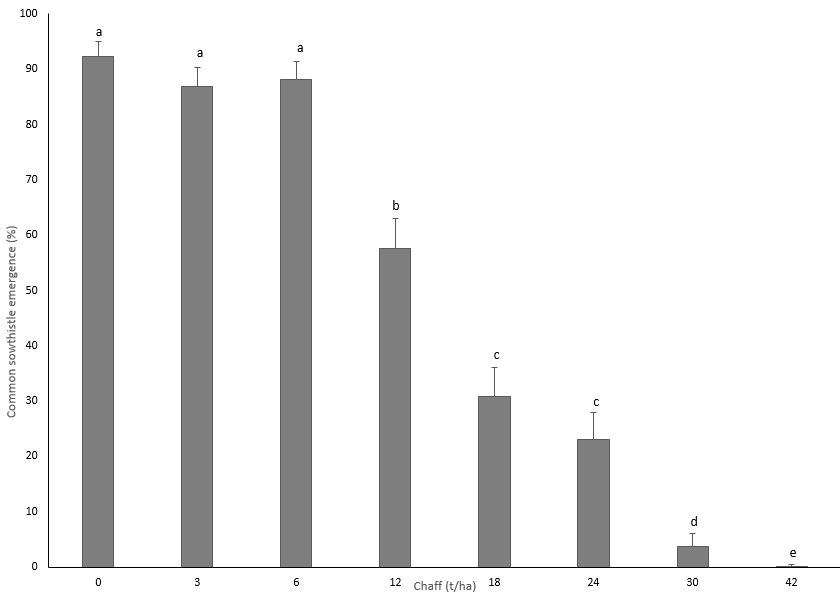
Emergence of common sowthistle declined sharply with increasing amounts of chaff at rates equal to and exceeding 12 t/ha (Figure 3). More detailed results including the LSD used to compare treatments are presented in the Appendix. There were significant main effects of chaff type and chaff rate, but no significant interaction (for this reason, data are combined for both chaff types). Overall, there was higher sowthistle emergence from beneath barley chaff (49.0%) compared with wheat chaff (40.6%). There was no difference between the chaff rates at 0, 3 and 6 t/ha, but emergence was reduced at all higher chaff amounts. Common sowthistle emergence was almost completely suppressed (0.02% emergence) at the heaviest chaff amount (42 t/ha).
 Figure 3. Emergence of common sowthistle through barley and wheat chaff (combined data) at 8 different rates (t/ha) in a pot experiment conducted at Toowoomba
The difference in emergence responses of the two weed types is likely due to the larger seed size of annual ryegrass, providing the seedlings with greater energy reserves to grow through deeper layers of chaff to reach light. An alternative suggestion is that, relative to grasses, the broad leaf structure of sowthistle seedlings renders them less capable of penetrating through chaff layers. These two reasons could work in combination to render common sowthistle more susceptible to smothering by chaff layers, relative to annual ryegrass.
Conclusions
The results of these pot studies indicate that emergence of common sowthistle will be better suppressed than annual ryegrass under similar amounts of chaff.
Relative to barley chaff, wheat chaff had a greater suppressive effect on the emergence of annual ryegrass seedlings. This could be due to structural or chemical (allelopathic) differences between the chaff types and will be the subject of further research over the next 6-12 months.
In a chaff tramlining system chaff material is deposited on both tramlines, and therefore each tramline will have only half the amount of material than is concentrated in a single chaff line. For this reason, chaff lining may be more effective than tramlining in achieving weed suppression, owing to the greater concentration of chaff in one line versus 2 lines.
In summary, using tramlining or chaff lining can considerably reduce weed emergence given sufficiently high chaff loads. Because chaff tramlining/chaff lining will concentrate the weed seeds into narrow strips, the bulk of the seed bank is distributed over a small area favouring the use of more efficient and targeted chemical/mechanical approaches.
Acknowledgements
The research undertaken as part of this project is made possible by the significant contributions of growers through both trial cooperation and the support of the GRDC, the author would like to thank them for their continued support.
References
Heap, I. The International Survey of Herbicide Resistant Weeds. Online. Internet. Sunday, June 17, 2018. Available www.weedscience.com
VSN International (2017). Genstat for Windows 19th Edition. VSN International, Hemel Hempstead, UK. Web page: Genstat.co.uk
Walsh MJ, Newman P, Powles SB (2013) Targeting weed seeds in-crop: A new weed control paradigm for global agriculture. Weed Technol. 27:431-436
Contact details
Annie Ruttledge
Department of Agriculture and Fisheries
Leslie Research Facility, 13 Holberton Street, Toowoomba QLD 4350
Ph: 07 4529 1247
Email: annemieke.ruttledge@daf.qld.gov.au
Appendix
Table 1. Predictions of annual ryegrass emergence through wheat chaff at 8 different rates (t/ha) from a pot experiment conducted at Narrabri. These are back-transformed means (figures in brackets are the transformed means). The protected least significant test was used for pair-wise comparisons of significant treatment effects on the transformed scale (LSD = 9.43). NB: Means with the same letter are not significantly different at the P = 0.050 level.
| Chaff rate t/ha | Emergence | ||
|---|---|---|---|
0 | 96.2% (78.8) a | ||
3 | 90.9% (72.4) ab | ||
6 | 97.5% (81) a | ||
12 | 94.6% (76.6) a | ||
18 | 84.8% (67) bc | ||
24 | 71.6% (57.8) c | ||
30 | 50.2% (45.1) d | ||
42 | 13.5% (21.5) e | ||
Table 2. Predictions of annual ryegrass emergence through barley and wheat chaff at 8 different rates (t/ha) from a pot experiment conducted at Toowoomba. These are back-transformed means (figures in brackets are the transformed means). The protected least significant test was used for pair-wise comparisons of significant treatment effects on the transformed scale (LSD = 12.3). NB: Means with the same letter are not significantly different at the P = 0.050 level.
Chaff rate t/ha | Barley | Wheat | ||
|---|---|---|---|---|
0 | 96% (78.5) a | 93% (74.6) ab | ||
3 | 97.7% (81.3) a | 96% (78.5) a | ||
6 | 95.3% (77.5) a | 89.1% (70.8) abc | ||
12 | 89.7% (71.2) abc | 93.8% (75.6) ab | ||
18 | 74.8% (59.9) cde | 80% (63.5) bcd | ||
24 | 61.3% (51.5) def | 74.2% (59.5) cde | ||
30 | 58.3% (49.8) ef | 44.9% (42.1) fg | ||
42 | 28% (32) g | 2% (8.1) h | ||
Table 3. Predictions of sowthistle emergence through barley and wheat chaff (combined data) at 8 different rates (t/ha) from a pot experiment conducted at Toowoomba. These are back-transformed means (figures in brackets are the transformed means). The protected least significant test was used for pair-wise comparisons of significant treatment effects on the transformed scale (LSD = 8.698). NB: Means with the same letter are not significantly different at the P = 0.050 level.
Chaff rate t/ha | Emergence | |
|---|---|---|
0 | 92.3% (73.85) a | |
3 | 86.9% (68.75) a | |
6 | 88.1% (69.83) a | |
12 | 57.6% (49.38) b | |
18 | 30.8% (33.69) c | |
24 | 23.1% (28.73) c | |
30 | 3.6% (11.01) d | |
42 | 0.02% (0.88) e | |
GRDC Project Code: US00084,
Was this page helpful?
YOUR FEEDBACK
