Yield gaps - how much yield potential is left behind by better growers on the Liverpool Plains and why? Identifying areas to capture lost yield and profit
Take home messages
- Average wheat yields between 2000 and 2014 for the Liverpool Plains (2.6 t/ha) are 2.3 t/ha below the water-limited yield potential for dryland wheat. On average, this is costing growers $575/ha.
- A national survey of 232 growers included 45 respondents from the Liverpool Plains. Of the 45 Liverpool Plains respondents, only 3 fell into the lower half of the national relative yield group, confirming the high standing of growers from the Liverpool Plains.
- At Quirindi, applying 45 kg N/ha resulted in a 36% yield gap. Failure to control weeds during the summer fallow could account for up to 14% yield loss and low seedling density for a 9% yield loss. Even at 90 kg N/ha a 14% yield gap remains.
- An emerging practice of sowing early (26 April) with a late maturing variety and flexible N fertiliser application is expected to have the potential to increase the yield frontier by 19%.
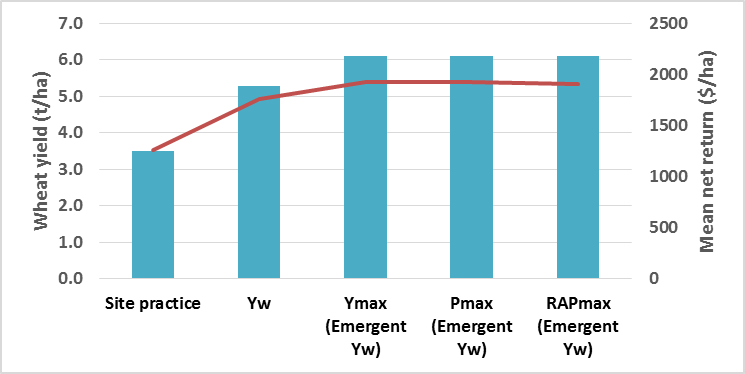
- This emerging best practice has the potential to increase financial returns in the Liverpool Plains from about $1260/ha to about $1930/ha. While proven in other regions, this emerging practice defies local convention and deserves to be investigated in local fields by growers, consultants and researchers.
Introduction
It is well known that Australia’s growers are among the best in the world and that Liverpool Plains growers are among the best in Australia. So why is the yield gap in the Liverpool Plains sub-region 47% of the yield potential? Between 2000 and 2014 average annual wheat yield (Ya) was 2.6 t/ha while the water–limited yield potential (Yw) was 4.9 t/ha. This means that there is a yield gap of 2.3 t/ha or $575 per ha (@250 $/t) that is not realised (www.yieldgapaustralia.com.au).
We ask why such a substantial yield gap exists and why some growers achieve their yield potential while others do not. We examined this in three different ways:
- A grower survey that investigated how farms with large yield gaps differ from farms with low yield gaps by relating yield gaps to grower characteristics, farm characteristics and farm management practices.
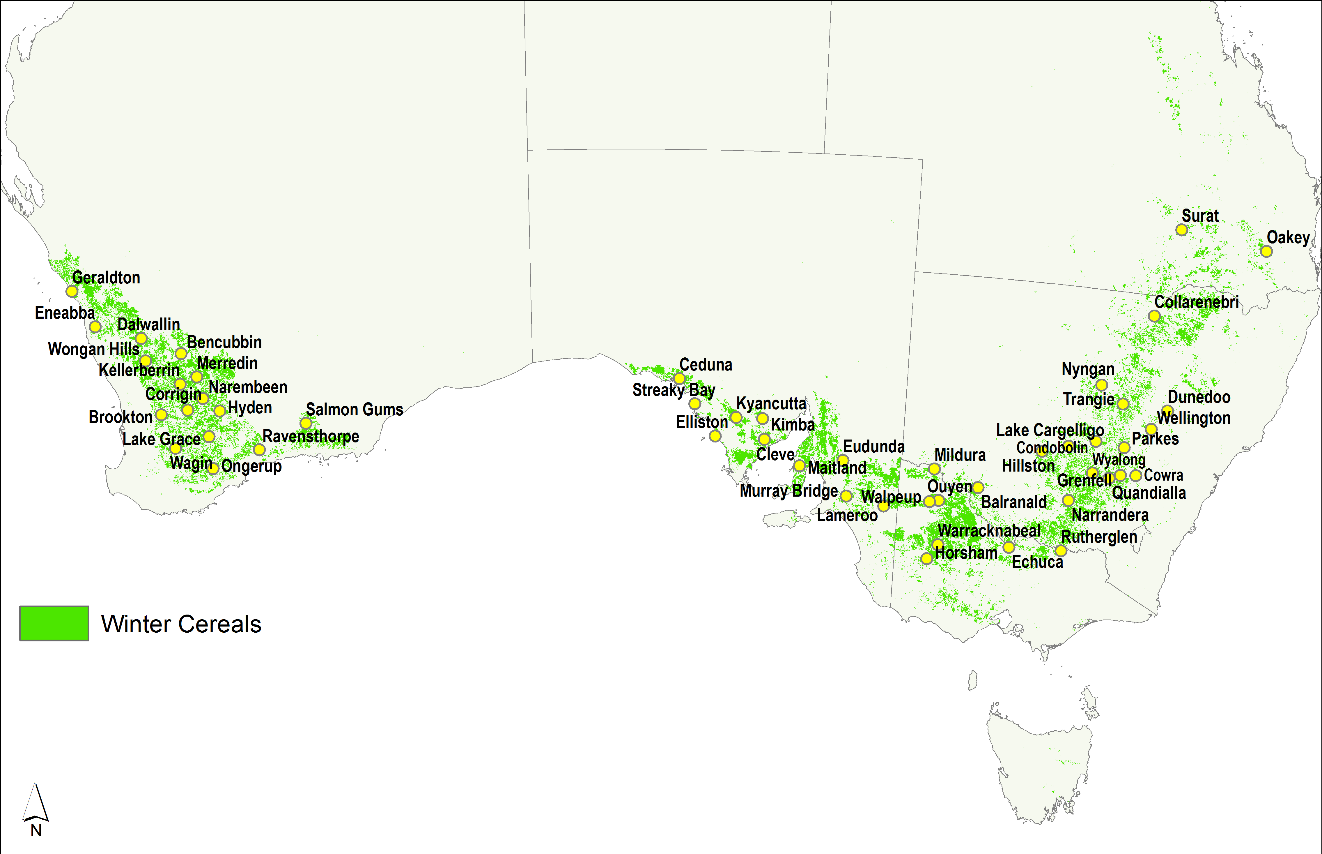
- A simulation study that examined the impact of sub-optimal management practices at 50 weather stations spanning the Australian grain zone.
- An economic (risk-adjusted profit) analysis that explored the results from the simulation study.
Grower survey
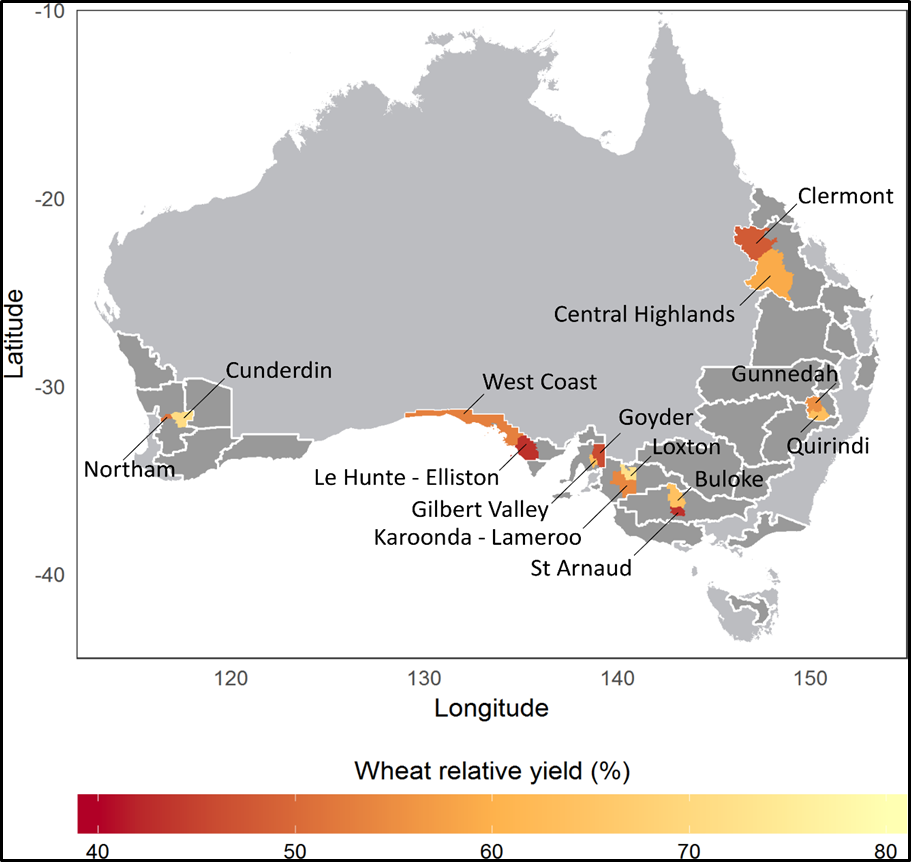
The survey aimed to comprehensively examine farm management practices as well as farm and farmer characteristics that may contribute to the wheat yield gaps in Australia. Using the GRDC customer relation database we conducted telephone interviews of 232 wheat producers from 14 contrasting local areas (SA2s; roughly equivalent to a shire) in the Australian grain zone (Figure 1).

Figure 1. Locations of surveyed local statistical areas (SA2s) with contrasting average relative yields. The relative yield of wheat (% of water-limited yield potential) is indicated by the red-yellow colour gradient. The white borders shows the GRDC sub-regions of the Australian grain zone
The average participants’ age was 51 years old (SD = 11, ranging from 20 to 89 years in age), with an average of 31 years (SD = 13) of experience in growing crops. Among the participants, there were only 10 female producers (4%). Seventeen participants (7%) identified as corporate farms while the rest identified as family farms. Thirty three participants (14%) owned or managed other farms in locations more than 50 km apart. The average cropping land area was 2,149 hectares (SD = 2,073). The total area cropped by participants was 0.5 million hectares, or about 2% of Australia’s cropped area.
Each farm’s yield gap was calculated by comparing their reported wheat yield in 2016 against the water-limited yield potential, simulated under best management practices for their three dominant soil types, using weather data from all stations in their postcode. All farms were ranked according to their relative yields (Y% = 100 X Ya/Yw). The median relative yield was 64% and this value was used as a cut-off for dividing the respondents into two equal sized groups: the high relative yield (=small yield gap) group (mean Y% = 96%; SD = 20%) and the low relative yield (= large yield gap) group (mean Y% = 47%; SD = 12%). Hence, an average yield gap of 49% exists between these two groups. All survey responses were analysed to determine if there were significant differences in how the high and low relative yield groups responded.
The results revealed significant differences between farms with smaller yield gaps and those with greater yield gaps in relation to farming management, farm characteristics, and grower characteristics. Australian farms with smaller yield gaps (high relative yield) are more likely to be smaller holdings (high relative yield: Mean = 1886 ha, SD = 1993 vs low relative yield: Mean = 2395 ha, SD = 2127; p = .061), growing less wheat (high relative yield: Mean = 743 ha, SD = 880 vs low relative yield: M = 1171 ha, SD = 1111.2; p = .001) on more favourable soil types.
These growers are more likely to apply considerably more N fertiliser to their wheat crop (Table 1), to grow a greater variety of crops, to soil-test a greater proportion of their fields, to have less area affected by herbicide-resistant weeds, and to be early adopters of new technology. They are less likely to grow wheat following either cereal crops or a pasture (Table 1). They are more likely to use and trust a fee-for-service agronomist, and to have a university education.
Table 1. Preceding crops before wheat crop and average nitrogen applied
| % of farms | Nitrogen application | |||
|---|---|---|---|---|
| High relative yield group (%) | Low relative yield group (%) | High relative yield group M (SD) (kg N/ha) | Low relative yield group M (SD) (kg N/ha) | |
A cereal crop | 37*** | 65*** | 79 (51)* | 57 (42)* |
A canola crop | 44 | 48 | 116 (146)** | 58 (45)** |
A pulse crop | 62 | 53 | 75 (61)*** | 42 (34)*** |
A pasture phase | 22*** | 44*** | 64 (58)** | 30 (33)** |
Note. The asterisk symbol indicates the statistical significance level of the differences between high and low relative yield groups, * p < .05, ** p < .01, *** p < .001.
Farms from the Liverpool Plains sub-region (Gunnedah and Quirindi SA2s) were massively over-represented in the high relative yields group with only 3 of the 45 respondents falling into the low relative yield (high yield gap) group. However, the large gap between highest and lowest yields reported for 2016 in the Liverpool Plains sub-region indicate that a significant yield gap still exists.
Simulation study
We conducted a simulation study on the impact of sub-optimal management practices at 50 weather stations that span the whole grain zone (Figure 2). A benchmark “best management practice” was defined by: zero tillage with clean fallows and stubble retained; a non-limiting supply of nitrogen to the crop; sowing at 150 plants/m² was activated between 26 April and 15 July when there were 30 mm of plant available water (PAW) and a 15 mm cumulative rain event occurred over any 3 consecutive days. Table 2 shows the average national impact, relative to water-limited yield potential (Yw), of selected sub-optimal management practices.

Figure 2. Fifty high quality weather stations and their distribution in Australia’s cropping zone
Nationally, the average rate of N applied to grain crops is 45 kg N/ha (Angus and Grace, 2017). This one practice is sufficient to account for a 40% yield gap. Even at double that rate, a 23% yield gap remains. Frost and heat stress accounted for yield losses of between 16% and 25% of Yw depending on the function used (two versions of the Bell et al., 2015 function were used due to uncertainty about the function’s parameters). Failure to control weeds during the summer fallow could account for up to a 26% yield loss; delayed sowing accounted for a 7% yield loss and low seedling density for an 8% yield loss. Any grower who is still practising conventional tillage could be missing out on 33% of their yield potential. Other factors that contribute to the yield gap, not included in simulations, include biotic stresses such as plant diseases, insects and other pests, in-crop weeds and extreme weather events (e.g. floods, strong winds and hail).
Since none of the 50 stations of Figure 2 were located in the Liverpool Plains, we repeated this analysis for Quirindi which had a 15 year average Yw of 5.1 t/ha. The impact of sub-optimal practices at this site were of a similar order to the national results with 45 kg N/ha accounting for a 36% yield gap. Even at 90 kg N/ha a 14% yield gap remains. Frost and heat stress accounted for yield losses of between 19% and 33% of Yw, depending on the function used. Failure to control weeds during the summer fallow could account for up to 14% yield loss and low seedling density for a 9% yield loss.
Despite the practice of late sowing in the Liverpool Plains, we found that the ideal sowing date was 26 April with a late maturing cultivar. This “emergent Yw” treatment, with a 15 year average yield of 6.0 t/ha, had a 19% advantage over Yw and should be considered as the new yield frontier. While frost and heat stress reduce the yield potential of both Yw and the new simulated yield frontier, the advantage of the new treatment is slightly enhanced when frost and heat stress are taken into account. The advantage of early sowing combined with later maturing (slower developing) varieties is consistent with recently published field and simulation work for sites from Dubbo south to Victoria, and west to SA and WA (Flohr et al., 2017) but will require flexible additional application of N fertiliser to meet N requirements of 6-9 t/ha crops when seasonal conditions are right (e.g. 2016).
Table 2. Impacts of management factors (treatments 2-7) and of frost and heat stress (treatments 9 & 10) on water-limited yield potential (Yw).
Treatment | Treatment | Mean (t/ha) | SD | CV | Y% |
|---|---|---|---|---|---|
1 | Yw (water-limited yield) | 4.28 | 0.92 | 21 | 100 |
2 | Seedling density (50 plants/m2) | 3.78 | 1.10 | 29 | 88 |
3 | Late sowing (2 week delay) | 3.97 | 1.04 | 26 | 93 |
4 | Summer weeds | 3.18 | 1.17 | 37 | 74 |
5 | Conventional tillage | 2.86 | 1.08 | 38 | 67 |
6 | N fertiliser (45 kg N/ha) | 2.57 | 0.44 | 17 | 60 |
7 | N Fertilizer (90 kg N/ha) | 3.30 | 0.96 | 29 | 77 |
9 | Frost and Heat | 3.15 | 1.00 | 32 | 74 |
10 | Frost and Heat 2 (moderate impact) | 3.60 | 0.95 | 26 | 84 |
Risk-adjusted profit
Growers generally do not seek to maximise yield but rather to maximise their profit. However, growers are also generally averse to risk, meaning that profits should be adjusted for yield and price risk via a measure of certainty equivalent. The certainty equivalent represents the smallest amount of certain money a farmer is willing to receive to forgo an uncertain profit, and can be calculated as the difference between average profit and a risk premium (e.g. Hardaker et al., 2004; Monjardino et al., 2015). When typical costs were built in to allow profit and risk-adjusted profit to be calculated for a risk-neutral and a moderate risk-averse context, respectively (Figure 3), we found that, despite the higher costs, both maximum profit and maximum risk-adjusted profit were achieved by the emergent Yw treatment.
 Figure 3. Wheat yield (t/ha) (blue bars) and net returns ($/ha) (red line) achieved by average site practice, water-limited yield potential (Yw) and yield-maximizing (Ymax), profit-maximizing (Pmax) and risk-adjusted profit maximizing (RAPmax) practices that are all emergent Yw treatments at a high yielding site (Dunedoo, NSW).
Conclusions
While wheat growers in the Liverpool Plains are among the most efficient in Australia, there is still room for closing the yield gap by adopting non-limiting N fertiliser practices and controlling fallow weeds.
Simulation analysis suggests that, contrary to current practice, early sowing with slow maturing varieties has the potential to lift the production frontier by 19% and significantly improve risk-adjusted profitability. This finding needs to be fully evaluated in local field experiments.
Acknowledgements
The research undertaken as part of this project is made possible by the significant contributions of growers through both trial cooperation and the support of the GRDC. The authors would like to thank them for their continued support. We gratefully acknowledge the expert advice provided by Jan Edwards and Alan Umbers of GRDC as well as by Pam Watson, CEO of Down To Earth Research who conducted the interviews. We wish to thank Dr Jeremy Whish who reviewed an earlier draft of this paper.
References
Angus, J.F., Grace, P.R., 2017. Nitrogen balance in Australia and nitrogen use efficiency on Australian farms. Soil Res. 55, 435-450.
Bell, L.W., Lilley, J.M., Hunt, J.R., Kirkegaard, J.A., 2015. Optimising grain yield and grazing potential of crops across Australia's high-rainfall zone: a simulation analysis. 1. Wheat. Crop & Pasture Science 66, 332-348.
Flohr, B.M., Hunt, J.R., Kirkegaard J.A., Evans J.R., 2017. Water and temperature stress define the optimal flowering period for wheat in south-eastern Australia. Field Crops Res. 209, 108-119.
Hardaker, B.J., Huirne, R.B.M., Anderson, J.R., Lien, G., 2004. Coping with Risk in Agriculture, second ed. CABI Publishing, Oxford.
Monjardino, M., McBeath, T., Ouzman, J., Llewellyn, R., Jones, B., 2015. Farmer risk-aversion limits closure of yield and profit gaps: A study of nitrogen management in the southern Australian wheatbelt. Agric. Sys. 137, 108-118.
Contact details
Zvi Hochman
CSIRO Agriculture and Food
Ph: 07 3214 2234
Email: zvi.hochman@csiro.au
GRDC Project Code: CSA00055,
Was this page helpful?
YOUR FEEDBACK
