GrainCam - a device for detecting contaminants in grain as it is being harvested
Author: John Moore, Carlos Babativa Rodriguez and Svetlana Micic. (Department of Primary Industries and Regional Development, Albany) | Date: 26 Feb 2019
Key messages
- Grain contaminants such as weed seeds and snails can be detected using GrainCam that is attached to the harvester although detection levels were low.
- GrainCam uses common components and is controlled by a smartphone.
- Maps of the locations of where the contaminants were harvested can be produced.
- It has been successfully deployed in rough country under difficult field conditions but requires some further work to improve reliability and create more accurate image analysis algorithms.
Background
Loads of grain may be rejected if weed or pest contamination levels are above receival standards (CBH, 2017). Knowing where the source of the contaminant occurs within a paddock allows for avoidance, targeted control or special treatment of infested areas.
Smartphones are powerful and portable computing devices that implement leading-edge technologies and are affordable. The introduction of IP68 weather proof devices allow for the phones to withstand rain and dust whilst still working reliably. These have been used to capture time-lapse imagery of crops in the field for many months.
Image analysis is a computational science used to process digital images in order to extract relevant information such as the number or position of items with certain characteristics which is often referred to as object detection. It is used in many fields of science such as medicine, security, and agriculture. Additionally, platforms that implement artificial neural networks or machine learning for image analysis have been developed and are being constantly improved by thousands of contributors around the world. There is good potential for processing imagery collected in crops to monitor pests and weeds.
Initially, an attempt was made to photograph moving grain as it was being harvested but this was not very successful with older smartphones that had limited camera controls. We therefore opted to photograph slow moving grain by delivering it to a plate beneath the camera. The amount of grain on the plate varied with the angle of the header, wind and other inertial forces. These could be overcome by manually altering the angle of the table, so an automated system was devised which is reported here and has been called the GrainCam.
Aims
To produce a prototype device that will enable smartphones to map weed seed or pest densities occurring in grain during harvest.
Method
Mobile smartphones and image analysis were used to control the movement of grain across a platform where it could be photographed for later examination for the presence of weed seeds such as bedstraw, or other contaminants such as snails.
This allowed high resolution photographs with GPS locations to be captured under field conditions where the angle and vibrations of the harvester could be counteracted. A smartphone app detected how much grain was on the photo table and sent a Bluetooth message to a 12 volt linear motor that increased the angle when the table was full to clear the grain and decreased the angle as required to maintain a consistent flow of grain past the smartphone camera. The images were stored on a SD card in the phone with the time and location of where they were taken. Image analysis was then used to detect the contaminant of interest and produce a map of its density and location.
Image capture
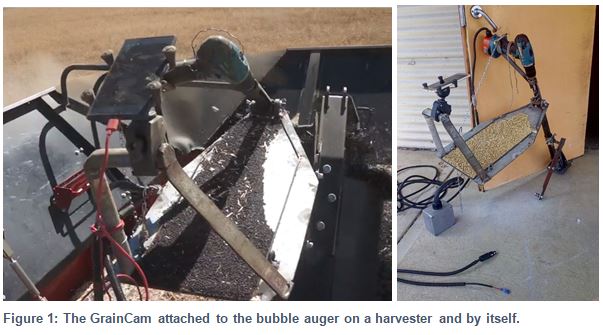
A small auger was placed at the outlet of the harvester’s bubble auger to deliver subsamples of grain that slowly slide over a silver coloured plate which sits in the field of view of the smartphone’s camera. The phone mount is fixed to the plate so that any movement generated by the header was followed by both simultaneously, reducing the likelihood of motion blur. Initially, an Android time lapse applications (Tina Time-lapse® or LapseIt®) were used to photograph the grain on the plate whose inclination was controlled manually (Figure 1).
This process was automated by attaching an electric linear motor to the table to adjust the degree of tilt under the control of an app we wrote for the smartphone. This app analysed the current camera image to determine the loading and location of the grain on the photographic table. The app sent a Bluetooth® signal to the linear motor controller to activate the linear motor and thereby adjust the tilt angle of the photographic table so that it is was always loaded with grain. This app also took geotagged photos with timestamps and controlled the camera functions such as the focus and time between photographs. The app was developed in Android Studio based on Google’s Camera2Basic, Bluetooth Chat and an implementation of the OpenCV library for android. The new app directly analysed the camera preview of the photo table and if it was more than one third empty it reduced the angle thus reducing the grain flow causing the table to fill with grain. When it was full it increased the table angle thus increasing the flow and helping to clear the table. This means that grains with different inherent flow rates e.g. Canola versus oats and different rates of grain delivery e.g. areas of thick versus thin crop can all be handled automatically without operator intervention.
Further improvements such as automatic image capture triggered by detection of grain moving on the plate, detection of the target weeds seed or insect, awareness of the inclination of the vehicle via the gravity sensor and notification alerts when something unusual occurs are also feasible.
Image analysis
Images of grain taken during harvest from paddocks that were suspected to have three-horned bedstraw were taken using the device and manually inspected for presence of the seed. Samples of grain were also taken and analysed conventionally as described by Moore and Gillespie (2010).
Images from snail infested paddocks at Mt Barker were also taken. Machine learning using neural networks was applied to create a model that could be used to count the number of snails in each image. A 16 layer neural network (YOLO) to predict the presence of snails in normal grain samples was used. These were applied to the grain images taken at harvest to produce a spreadsheet containing the predicted number of snails at a threshold score of 0.9, and the latitude and longitude of the image.
Results
Two mobile phone apps “Tina Time Lapse®” and “LapseIt®” were tested for recording the images of grain from the auger. Tina Time Lapse® was chosen as the better option as it captured high quality photos that could be image analysed at a later date. The apps performed adequately on Android and iPhones for this exercise.
Both programs had issues with losing photographs when the phone batteries went flat. Tina Time Lapse® was chosen as the most user-friendly though LapseIt® had more options. LapseIt® will be useful in some situations especially where video output is desired.
Bedstraw seeds in grain
A TensorFlow model was produced using grain that had bedstraw seed added. No seeds were detected when this model was applied to the field images taken during harvest. Manual inspection of the images found no bedstraw seed and no seeds were detected when physical grain samples were analysed conventionally by the conventional image analysis machine developed by Moore and Gillespie (2010). An accuracy of about 70% detections was achieved by the model in training when tuned to reduce false positives. Thus some seeds may be present under commercial conditions due to lack of detection and sampling error as less than 1% of the harvested grain is being sampled or photographed. However, this level of sampling is much higher than historic or industry practice levels.
Mount Barker Snails
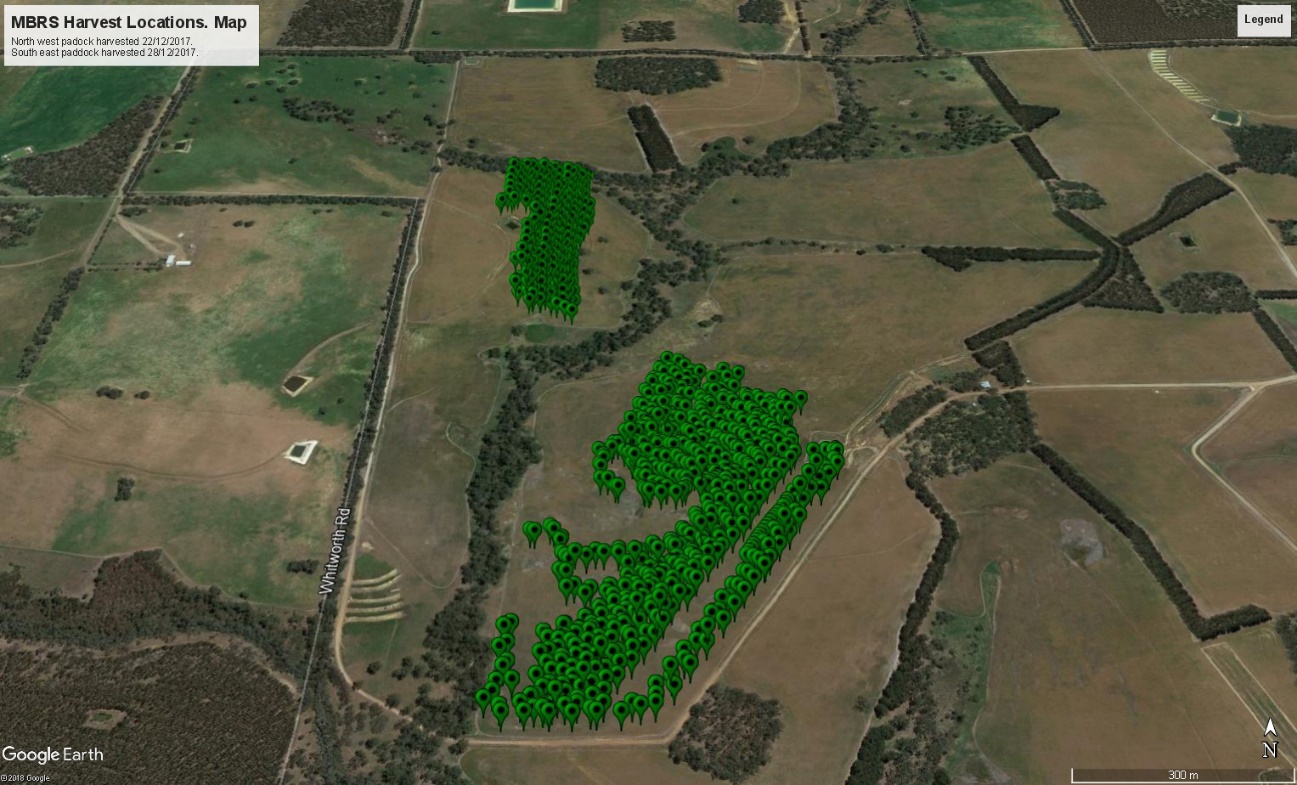
At Mount Barker Research Station (MBRS) the GrainCam was used to conduct surveillance for small pointed snails on two paddocks (Figure 2). On one paddock the WheelCam was also used to collect images of the ground during harvest and 54 physical samples of approximately 800g were taken about every two minutes during harvest. These samples were brought back to the laboratory and the number of snails in each sample was counted and another set of GrainCam images was taken of these samples.

Figure 2: Locations of the GrainCam images from the two sites harvested.
Grain images taken during harvest were collected into 2 georeferenced series shown in Figure 2.
An initial neural network model was produced but had too many false positives to be useful. 360 images were inspected resulting in 104 false positives and one true positive snail detection. A second model had similar issues even when the threshold scores were raised from 0.1 to 0.9. 300 images were inspected resulting in 35 false positives and one true positive snail detection. The training samples were then reviewed by an agricultural expert to provide a much tighter set. The model was rerun with this revised training set and the results improved but there were still high numbers of false positives and low number of snails detected in the grain images. 694 images were inspected resulting in 332 false positives and 14 true positive snail detections. For the snail densities present at the trial sites during 2018, more than 700 images were needed to provide a useful estimate of the snail densities and geographical distribution in the harvested grain. However, from a practical view point as the level of grain contamination was well below the acceptable level, the current level of sampling may be sufficient for use by growers who are only concerned about the current level of grain contamination. This work reinforced the need for large numbers of quality training images to achieve good models and predictions.
Conclusion
Understanding the density of contaminants across a paddock allows growers to target their control more effectively or avoid areas that are contaminated. Continuous detection will allow growers to identify the arrival of unwanted pests and diseases at low levels before they are easily detected manually or have become well established. This will allow more cost effective control of new invasions. Further field evaluation is required to ensure the models are robust under a range of conditions and new models need to be created for other species of interest and in particular the invasive species that many growers may not recognise such as bedstraw.
Testing of the new device is required to determine how well the app and linear motors work under a wider range of conditions. It is expected that modifications and fine tuning will be needed before public release.
References
CBH. (2017, September 5). Retrieved January 17, 2018, from Grains Industry Western Australia (GIWA): 2017 2018 CBH Public Receival Standards WA as at October 2017.pdf
Moore J.H. & Gillespie M. (2010) Image analysis for the detection of three-horned bedstraw seed in grain. In Zydenbos SM (ed) ‘Proceedings of the 17th Australasian Weeds Conference.’, 71–73. (New Zealand Plant Protection Society)
Moore C.B. & Moore J.H. (2017) HerbiGuide - The Pesticide Expert on a Disk. Version. 31.0, (PO Box 44, Albany, Western Australia, 6331, HerbiGuide, www.herbiguide.com.au).
Appendix
Raw results are in 2017-12-29mbrsseJMMod.csv.
Acknowledgments
We would like to acknowledge the Invasive Species directorate of DPIRD and Boosting Grains R&D for supplying the majority of funding for this work. Growers have provided valuable input and the use of their machinery and land.
Paper refereed by Martin Atwell and Dusty Severtson.
GRDC Project Code: DAW00256 Building crop protection and production agronomy R&D capacity in regional Western Australia.,
Was this page helpful?
YOUR FEEDBACK

