Wheat varietal tolerance to sodicity with variable subsoil constraints
Take home messages
- Common soil constraints in semi-arid regions such as the northern region include; high sodicity in surface and subsoil, high salinity and phytotoxic concentration of chloride (Cl) in subsoil, and alkaline surface soils with acidic subsoil
- The yield penalty due to soil constraints is greater in years with below average in-crop rain (ICR)
- Yield ranking at sites without soil constraints is not a good predictor of performance at sites with soil constraints
- Certain genotypes rank relatively more tolerant to sodic soils with variable subsoil constraints than others
- Less water extraction occurs between emergence and anthesis (plant available water capacity, (PAWC)) at constrained sites as compared to sites without soil constraints
- Wheat grain yield increased significantly with increasing calcium concentrations in young mature leaves
Introduction
High sodicity in surface soil and subsoil, high salinity and phytotoxic concentration of chloride (Cl) in subsoil, as well as alkaline surface soils with acidic subsoil are common soil constraints in many semi-arid regions worldwide and in particular in Australia. These constraints reduce the ability of crop roots to extract water and nutrients from soil. Sodic soils tend to have severe soil structural problems including poor aeration and restricted water transmission, resulting in reduced root growth (Dang et al. 2006). Subsoil constraints, reduce the ability of crop roots to extract water and nutrients from the deeper layers in the soil, especially from layers high in salt content and soil chloride concentrations (Dang et al., 2008).
Successful dryland crop production in the north-eastern grain growing region of Australia depends on utilising soil moisture accumulated in the period preceding sowing. Due to the high clay content of soils in this region, these soils can potentially store 200-250 mm of water in the soil profile or more. However, soil constraints, especially in the subsoil, reduce the effective rooting depth thus also limiting plant access to water and nutrients and as a result, limiting crop yield (Dang et al., 2006). Several soil physiochemical constraints in the surface and subsoil interact with each other to determine the local environment for root growth. Rarely do the various soil constraints occur independently (Nuttall et al., 2003). The effects of soil constraints vary both spatially and over time. Spatial variation can occur within a field, across the landscape and with depth in the soil profile. There are also complex interactions that exist among the various physio-chemical constraints (Dang et al. 2006). These complicated interactions limit the agronomic and management options. The variable impact on crop growth and yield is compounded by the complex interactions between the range of soil constraints and environmental factors. In particular the timing and amount of rainfall relative to the crop growth stage. Selection of genotypes tolerant to soil constraints and identification of traits for pre-selection may provide a long-lasting tangible solution to improve wheat yields on these soils.
Materials and methods
A series of paired experiments were conducted during 2015-18 to evaluate wheat genotypes on two sites in southern Queensland. Sites were a distance of 0.5 to 5 km apart, with one site containing a range of soil constraints predicted to reduce wheat yields (Dang et al. 2006), with the other relatively non-constrained. The long-term average annual rainfall for the area is 617 mm with an average in crop rainfall for wheat growing season (mid-May to mid-November) of 170 mm. Each year the exact location of both experimental sites was changed, but they were within the same area on similar soil type. The soils at both sites were grey Vertosols. Sites were on a <1% slope and sown to wheat genotypes in mid-May to mid-June each year. Wheat genotypes were selected to represent the diversity of Australian wheat germplasm, including current and older varieties with a range of morphological and physiological traits (Table 1).
Soil and plant sampling and analysis
Two soil samples were taken per location, using a 50-mm diameter tube and a hydraulic sampling rig. Soil samples were extruded onto a plastic liner and then sub-sampled into a surface interval (0.0–0.1 m), then successive 0.2 m intervals to 1.5 m and analysed for soil physical and chemical properties.
At anthesis, 50 youngest fully mature leaves (YML) were obtained randomly from each replicate plot of each genotype, rinsed with distilled deionized water and dried at 70°C for 48 hours. Dried plant samples were ground into a fine powder to pass a 0.5-mm sieve. To determine concentrations of sodium (Na), potassium (K), calcium (Ca), magnesium (Mg), sulfur (S), zinc (Zn), phosphorus (P), aluminium (Al), boron (B), copper (Cu), iron (Fe) and manganese (Mn), plant material was digested in a di-acid mixture of nitric and perchloric acid. Concentrations of ions were measured on an inductively coupled plasma-optical emission spectrometer (ICP). For chloride, ground samples of YML were extracted in hot water at 80°C for 4 hours. The chloride concentration was determined using an auto-analyser.
Crop water use
We used an electromagnetic induction (EMI) instrument (Geonics EM38®) to measure apparent electrical conductivity in a vertical coplanar at critical wheat growth stages (emergence, stem-elongation, mid-tillering, anthesis, heading and maturity) to monitor crop water use. Since EMI provides only qualitative values for electrical conductivity, calibration is needed. Volumetric water content was measured on a separate 50-mm diameter soil sample to 1.5 m taken using the hydraulic soil sampling rig.
Statistical analyses
Analysis of variance for data on soil water, grain yield for each site was done using Genstat 16. The effect of sites and genotypes was analysed in a two-way factorial design. Significant differences between treatments were assessed using Fisher’s l.s.d. (P=0.05). We used a paired t-test to examine whether, at a particular depth in the profile, the mean of a soil attribute differed significantly between the sodic and non-sodic sites.
Results and discussion
Soil constraints
Average and standard errors of soil constraints for the four sites are given in Figure 1. Compared to non-sodic sites, the sodic sites had significantly higher exchangeable sodium percentage (ESP) up to 0.6 m soil depth, significantly higher electrical conductivity (EC) and chloride concentrations to depth of 1.5 m. A value of ESP ≥6% in the surface soil would result in poor germination and water infiltration in soil (Rengasamy 2002). The sodic sites had chloride concentration >800 mg/kg below approximately 0.6 m soil depth, a threshold that generally results in reduced water and nutrient uptake and yield reduction in bread wheat (Dang et al. 2008). The non-sodic site had higher soil pH (>8.0) to a depth of 0.4 m soil and significantly lower pH (<5.0) below 0.9 m soil depth as compared to non-sodic sites. Acidic subsoils at sodic site containing toxic levels of aluminium or deficient amounts of calcium also restrict root proliferation.
Table 1. Details of wheat varieties (adapted from Anzooman et al. 2018)
Name | Type | Breeder1 | Grade2 | Target Australian region, comment |
|---|---|---|---|---|
Axe | Cultivar/Hexaploid | AGT | AH | SA, relatively drought tolerant |
Aurora | Cultivar /Durum | DBA | ADR | NSW and Qld |
Baxter | Cultivar/Hexaploid | QDAF | APH | NSW and Qld |
Batavia | Cultivar/Hexaploid | QDAF | APH | NSW and Qld |
Bremer | Cultivar/Hexaploid | AGT | AH | WA |
Corack | Cultivar /Hexaploid | AGT | APW | WA, relatively drought tolerant |
Caparoi | Cultivar /Durum | NSW DPI | ADR | Qld, NSW, WA and SA |
Dharwar | Cultivar/Hexaploid | India | Indian cultivar, drought tolerant, deep rooted, tall | |
Elmore | Cultivar/Hexaploid | AH | Nematode and rust tolerant | |
Emu Rock | Cultivar/Hexaploid | InterGrain | AH | WA |
Flanker | Cultivar/Hexaploid | LPB | APH | NSW and Qld, resistance to stripe, stem and leaf rust |
EGA Gregory | Cultivar/Hexaploid | EGA | APH | NSW and Qld |
Gladius | Cultivar/Hexaploid | AGT | AH | |
Hyperno | Cultivar /Durum | AGT | APDR | SA,NSW- performs well in high yielding environment |
Hartog | Cultivar/Hexaploid | QDAF | APH | NSW and Qld |
Hydra | Cultivar/Hexaploid | InterGrain | APW | WA |
Impala | Cultivar/Hexaploid | LPB | ASFT | NSW and Qld |
Krichauff | Cultivar/Hexaploid | UA | ASW | South |
Test line 1 | Elite breeding line | NSW and Qld | ||
Lancer | Cultivar/Hexaploid | LPB | APH | NSW and Qld |
Mace | Cultivar/Hexaploid | AGT | AH | NSW and Qld, less susceptible to downgrading |
Mitch | Cultivar/Hexaploid | AGT | AH | NSW and Qld |
Magenta | Cultivar/Hexaploid | InterGrain | APW | WA |
Pelsart | Cultivar/Hexaploid | QDAF | NSW and Qld | |
Janz | Cultivar/Hexaploid | QDAF | APH | Once widely grown in eastern Australia |
Jandaroi | Cultivar/Durum | NSW/DPI | NSW, SA, rust diseases resistant | |
Scout | Cultivar | LPB | APW | Victoria and SA, resistant to leaf rust |
SeriM82 | Breeding line | CIMMYT | Once grown in many countries but not Australia | |
Spitfire | Cultivar/ Hexaploid | LPB | APH | NSW and Qld |
Sunco | Cultivar/Hexaploid | AGT | AH | NSW and Qld |
Suntop | Cultivar/Hexaploid | AGT | APH | NSW and Qld |
Sunmate | Cultivar/Hexaploid | AGT | APH | NSW and Qld |
Trojan | Cultivar/hexaploid | LPB | APW | South and WA |
Tammarin Rock | Cultivar/Hexaploid | AH | WA | |
Wallup | Cultivar/Hexaploid | AGT | APH | WA |
Westonia | Cultivar/Hexaploid | APW | WA, widely adapted in international trials | |
Wyalkatchem | Breeding line | InterGrain | APW | WA |
Ventura | Cultivar/Hexaploid | AGT | ADR | NSW and Qld |
Viking | Cultivar/Hexaploid | LPB | APH | NSW and Qld |
Wylie | Cultivar | EGA | AH | NSW and Qld |
Yitpi | Cultivar/Hexaploid | AGT | AH | SA and Victoria |
Zen | Cultivar/Hexaploid | InterGrain | ASW | WA |
1 Breeding program abbreviations: Australian Grain Technologies (AGT), International Maize and Wheat Improvement Centre (CIMMYT), Commonwealth Scientific and Industrial Research Organisation (CSIRO), Enterprise Grains Australia (EGA), International Centre for Agricultural Research in the Dry Areas (ICARDA), Long Reach Plant Breeders (LPB), Queensland Department of Agriculture and Fisheries (QDAF), Durum Breeding Australia (DBA), University of Adelaide (UA).2Grain quality grade abbreviations: Australian Hard (AH),Australian Premium White (APW), Australian Standard White (Kumaraswamy), Australian Premium Durum (Florentino et al.), Australian Soft (ASFT), Australian Standard Noodle Wheat (ANW), Australian Premium White Noodle (APWN) is classified in the WA zone only, Australian Prime Hard (APH) is classified for the Northern & South Eastern zone only.
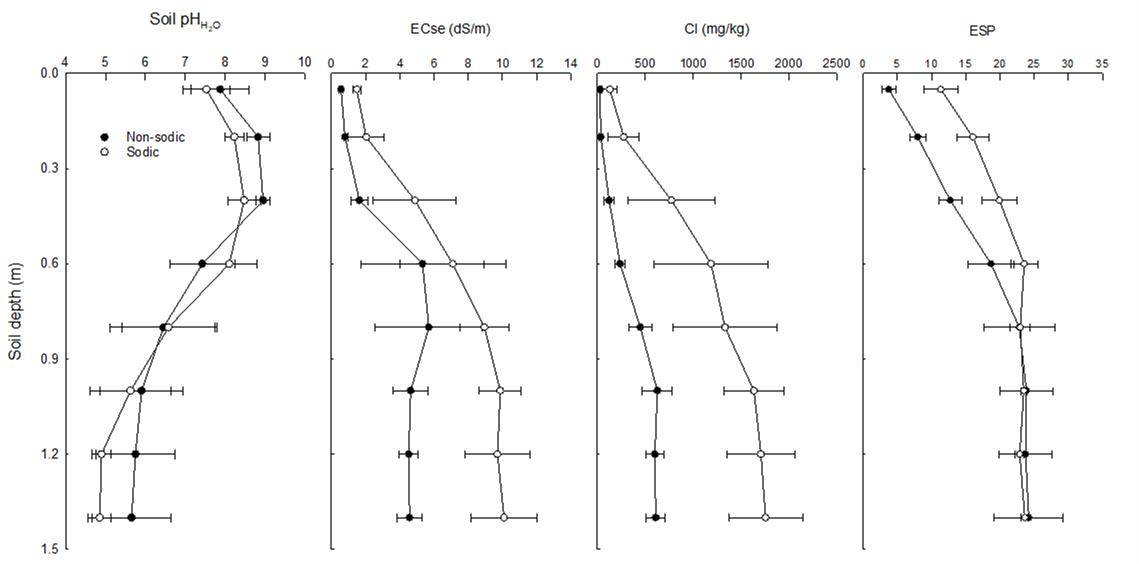
Figure 1. Average and standard errors of soil constraints for the sites during 2015-18 experiments
Yield penalty in sodic soil with subsoil constraints was seasonally variable
Substantially higher in-crop rainfall in 2015 and 2016 led to high average wheat grain yields at both sites with no significant differences between the sites for the 36 and 38 genotypes, respectively (Table 2). High in-crop rainfall allowed crops to grow with reduced reliance on extraction of water from the deeper soil profile. However, near average in-crop rainfall in 2017 and 2018 resulted in significantly reduced average wheat yield at the sodic site as compared to the non-sodic site. Sadras et al. (2003) in southern Australia hypothesised that plant available water is the key link between crop functionality and complex combinations of subsoil constraints, and that negative responses of subsoil constraints were more frequent in sites where conditions contributed to severe water deficits, i.e. low in-crop rainfall, less available water at sowing, and greater evaporative demands. Hochman et al. (2004), using APSIM simulation of wheat grown over 100 years in southern Queensland on relatively low and high subsoil constraint grey Vertosols, showed that yield differences vary from <200 kg/ha in some years to nearly 3 t/ha in others. The yield penalty due to subsoil constraints was seasonally variable; in-crop rainfall in the early part of the season (1 May to 15 August) was positively correlated with differences in grain yield (P < 0.001). Dang et al. (2008) in northern grain region showed that the presence of substantial higher chloride concentration (>800 mg Cl/kg) in the sodic subsoils restrict the ability of roots to extract subsoil water. Dang et al. (2010) analysing the results of 44 field trials in the case of bread wheat conducted in the northern region showed that yield penalty due to high subsoil chloride (>800 mg Cl/kg) was significantly higher in average in-crop rainfall seasons compared to high in-crop rainfall seasons.
Table 2. Date of wheat sowing (DOS) and harvesting (DOH), in crop rainfall (ICR) and site mean yield for wheat genotypes grown on non-sodic and sodic sites in 2015-18. Site wheat grain yield within a year followed by same letter are not significantly different (P<0.05)
Year | Field operations | in-crop rainfall (mm) | Wheat grain yield (t/ha) | |||
|---|---|---|---|---|---|---|
Date of sowing | Date of harvest | Non-sodic | Sodic | Non-sodic | Sodic | |
2015 (36) | 19.5.15 | 22.10.15 | 209 | 209 | 4.06a | 3.64a |
2016 (38) | 25.5.16 | 10.11.16 (S) 17.11.16 (NS) | 325 | 374 | 4.02a | 4.00a |
2017 (44) | 10.6.17 | 31.10.17 | 132 | 128 | 1.61a | 0.37b |
2018 (18) | 24.5.18 | 02.11.18 | 133 | 133 | 2.37a | 1.16b |
Numbers in parenthesis indicate the number of wheat genotypes grown in each year.
Yield ranking at non-sodic sites is not a good predictor of performance at sodic sites
Year 2015
Due to the timely in-crop rainfall (Figure 2), wheat grain yields at both sites were higher than normal and the grower reported his best crop yield ever at both sites. Site mean yields were 4.06 t/ha (sodic) and 3.64 t/ha at the non-sodic site (Table 2). In this ‘non-water limited season’, a number of genotypes exhibited higher yields at the sodic site than at non-sodic site (Figure 3). These included the breeder’s line LPB10-2555. Cultivars Baxter, Gregory and Mace which have been shown to perform well under subsoil constraints, also exhibited higher yield at the sodic site than the non-sodic site as did the land race Dhawar Dry.
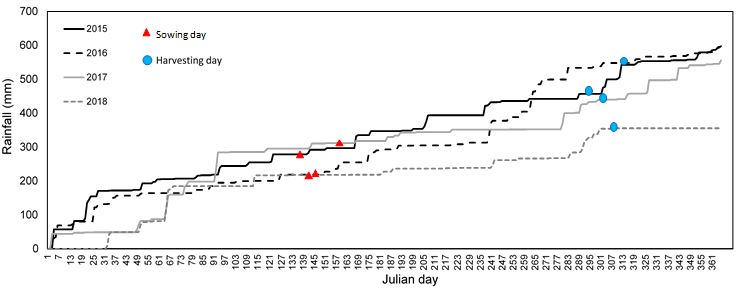
Figure 2. Cumulative rainfall during 2015-18 at the sites
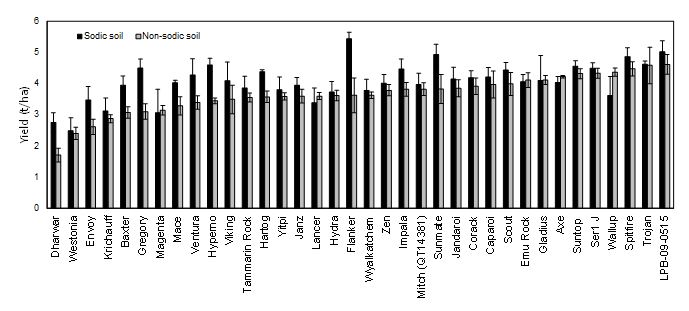
Figure 3. Genotype mean yields of 36 wheat lines at the non-sodic and the sodic site in 2015, ranked in ascending order of yield at the non-sodic site
Year 2016
Significant in-crop rainfall also occurred in 2016 just prior to each of the most critical crop developmental stages. As a result, the crop experienced little if any water-stress (Figure 2). This led to high grain yields at both sites with the non-sodic site averaging 4.02 t/haand the sodic site 4.00 t/ha, with no significant difference between sites. Trial mean yield levels in 2016 were similar to those in 2015. A small number of genotypes exhibited higher yields at the sodic site versus the non-sodic site (Figure 4). These included Mitch bread wheat and Aurora durum. Baxter exhibited lower yield than many other genotypes at the sodic site. This result contrasts with 2015 where Baxter has been a better performer than many other lines on the sodic site. Baxter is favoured by the grower at the sodic site as the historically best performing cultivar at this site. This result suggests that results in both 2015 and 2016 are likely to be a poor indication of performance in the terminal drought environments that are more common in this region.
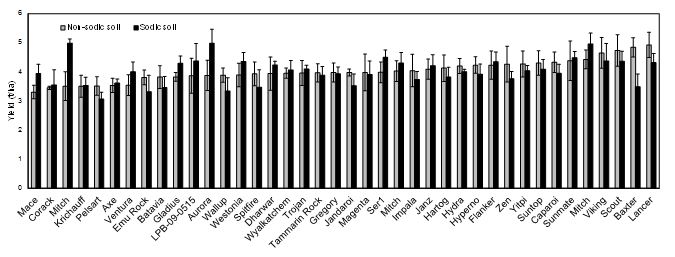
Figure 4. Average yields of 38 wheat lines at the non-sodic and sodic sites in 2016, ranked in ascending order of yield at the non-sodic site from left to right
Despite similar yields at the two sites in 2016, some symptoms of stress during early crop development were evident at the sodic site. The trial at the non-sodic site exhibited a mean emergent plant density of 86 m2 which is close to the target population density of 100 m2. In contrast, strong crust formation at the sodic site (Figure 5) resulted in reduced emergence averaging only 38 m2.
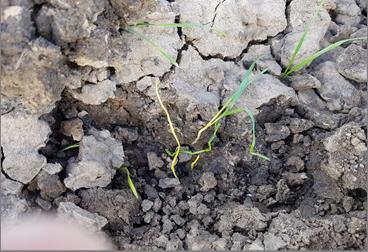
Figure 5. Crust formation at the sodic site in 2016 significantly reduced emergence. Crust segments in the lower portion of the image were removed to reveal etiolated (yellow) seedlings that failed to emerge when trapped beneath the crust
In addition to the difference in emergence between sites, there was also a difference in crop duration to anthesis. The average period from sowing to anthesis at the sodic site was 112 DAS (days after sowing), which was considerably shorter than at the non-sodic site (124 DAS). Plants at the sodic site seemed to have exhibited a remarkable ability to compensate for these early setbacks, likely due in large part to plentiful late season rainfall.
Year 2017
Crop establishment was reduced at both the sites due to dry top soil and a lack of follow up rainfall after sowing (Figure 2). However, the effect was much greater at the sodic site where establishment was 26% less than that at the non-sodic site. The lack of rainfall also meant that a surface crust failed to form at the sodic site as occurred in 2016. This suggests that the reduction in establishment observed at the sodic site was not mainly due to soil crusting. Wheat genotypes grown at the sodic site exhibited substantial yield reductions (62%-83%; av. 76%) as compared to the non-sodic site (Figure 6).
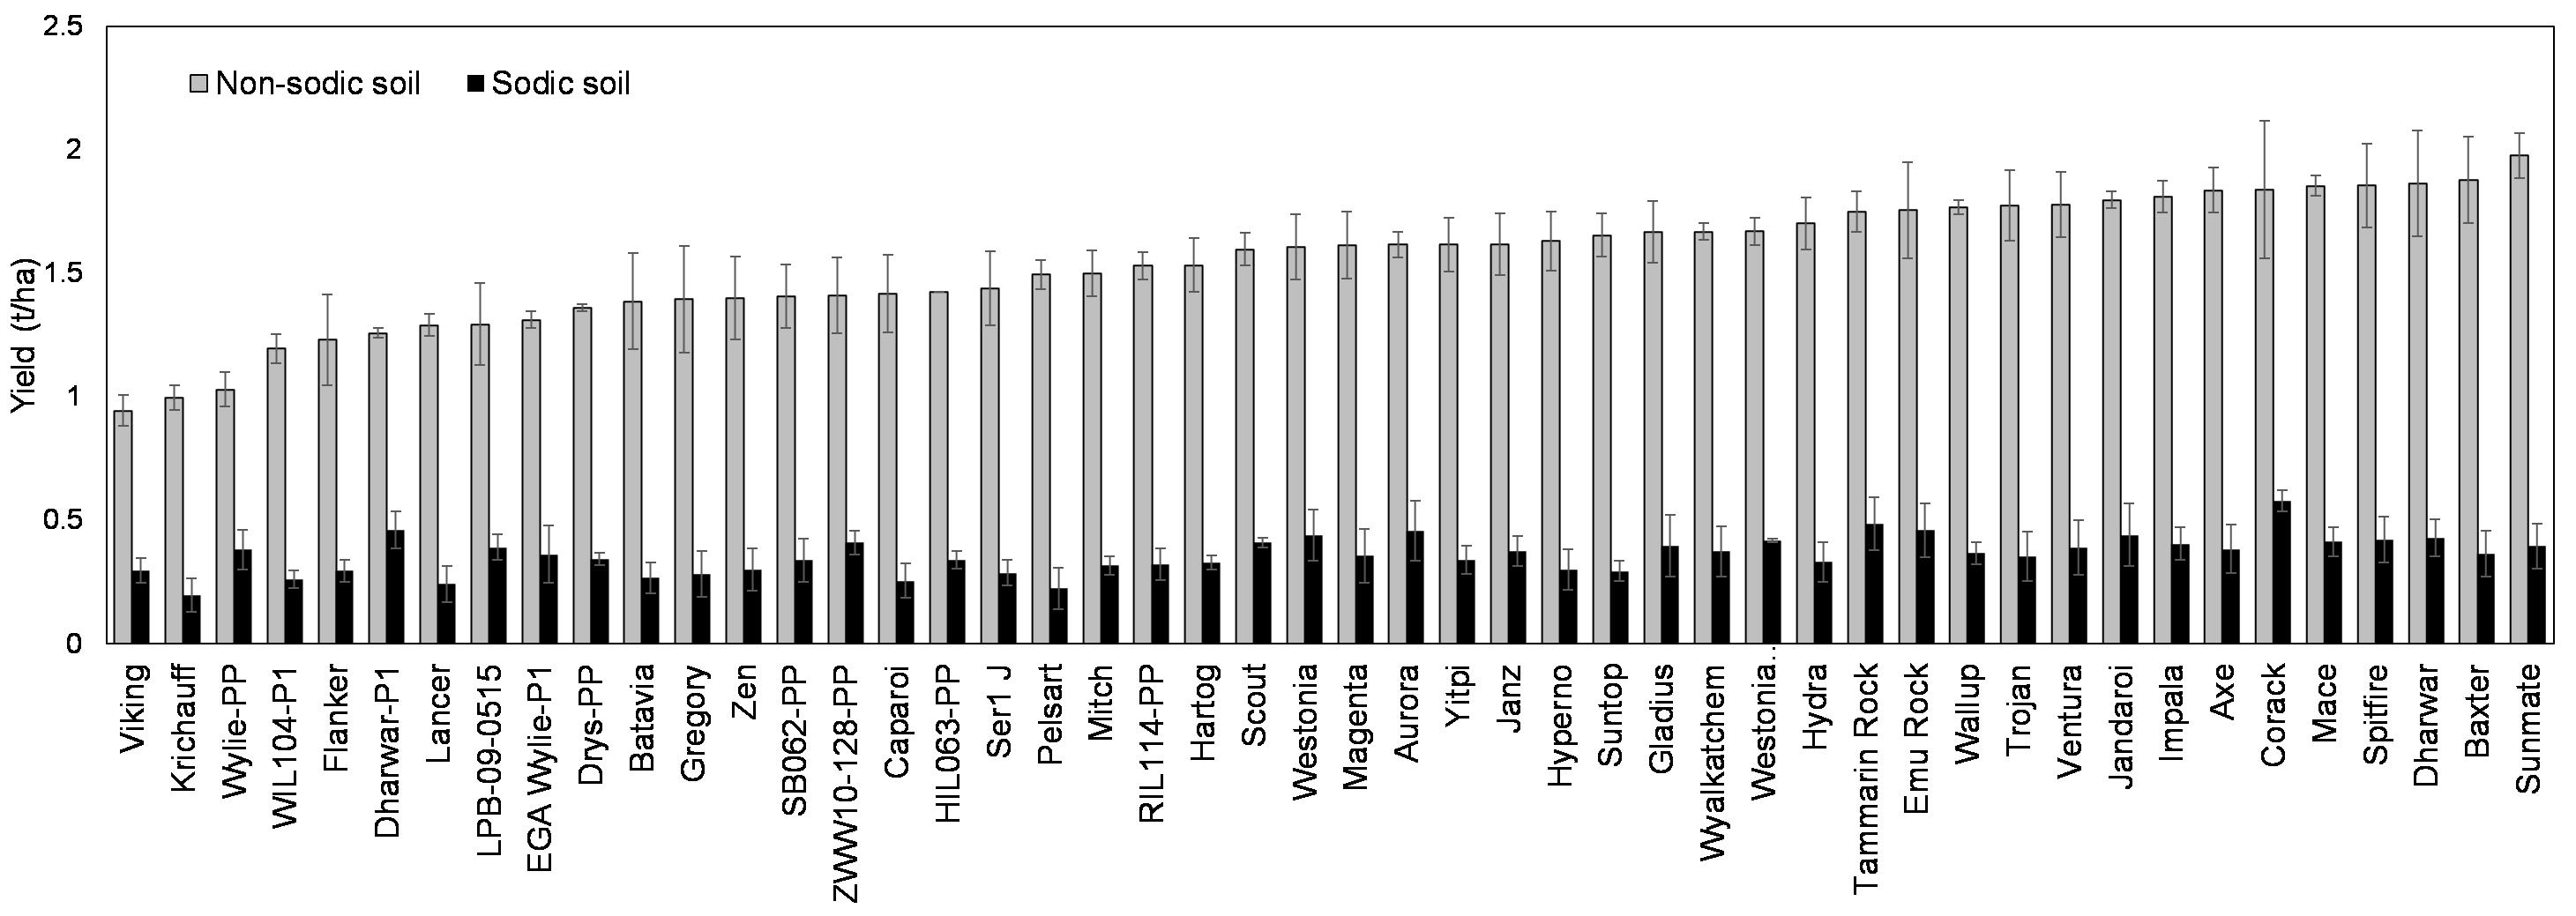
Figure 6. Mean grain yields of wheat lines at the sodic and the non-sodic site in 2017, ranked in descending order of yield at the non-sodic site.
As anticipated, northern adapted lines such as Baxter and Sunmate were highly ranked at the non-sodic site. However, rankings at the non-sodic site were not a good indicator of rank at the sodic site. Southern and western region lines such as Corack, Tammarin Rock and Emu Rock were highly ranked at sodic site (Figure 6). Durum genotypes were not poorly ranked at the sodic site, suggesting that sodium toxicity was not an important driver of yield. Mapping population parents Batavia and Pelsart both ranked poorly at the sodic site and there was little difference between the two. This suggests that the Batavia x Pelsart mapping population is not likely to be useful in dissecting the genetics of tolerance to sodicity with variable sub-soil constraints.
Year 2018
Crop establishment was reduced at both sites due to dry top soil and a lack of follow up rainfall after sowing. The impact was greater at the sodic site where establishment was 35% less than that at the non-sodic site (Figure 7). Similarly to 2017, the lack of rainfall after sowing failed to form surface crusting at the sodic site as occurred in 2016. This suggests that the reduction in establishment observed at the sodic site in 2018 was not largely due to soil crusting. Some other physical and/or chemical impacts of sodicity probably resulted in poor establishment. Wheat genotypes grown at the sodic site exhibited significant yield reductions (33%-66%; av. 51%) as compared to the non-sodic site. Although differences between wheat genotypes were not significant (P<0.09), the yield ranking for wheat genotypes between sites were similar to those observed in 2017. Wheat genotype yield rankings at the non-sodic site do not give a good indication of ranking at the sodic site. The ranking of certain wheat genotypes changed significantly in the presence of soil constraints. The cultivars Corack, Mitch, Trojan and Mace ranked highly at the non-sodic site. The wheat genotypes LBP10-255, Corack, Janz and Sunco ranked highly at the sodic site.
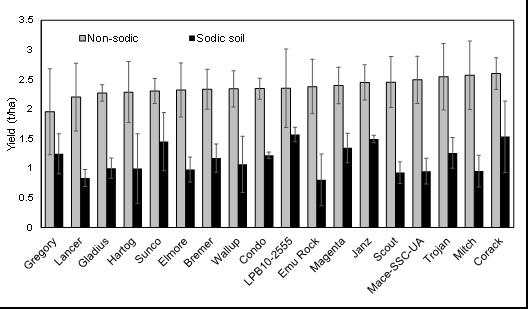
Figure 7. Mean grain yields of wheat lines at the sodic site in 2018, ranked in ascending order of yield at non-sodic site in 2018.
Soil water extraction was correlated with yield
Extraction of soil water from the soil profile was examined using the difference in the soil electromagnetic conductivity measured using an EM38 at near full soil water profile at sowing and that measured at different wheat growth stages (emergence, early tillering, mid-late tillering, head emergence and anthesis). In 2015 and 2016, there were no significant differences in the water extraction between sites and genotypes (data not shown). In 2017, the relationships between wheat grain yield and difference in EM38 reading between sowing and different growth stages of wheat were positive, however, this relationship was strongest at anthesis when soil water depletion was near its greatest. Further, this relationship was stronger in sodic soils as comparted to the non-sodic site (Figure 8). Positive relationships between grain yield of wheat genotypes and differences in water extraction between sowing and anthesis were obtained at both sodic and non-sodic sites.
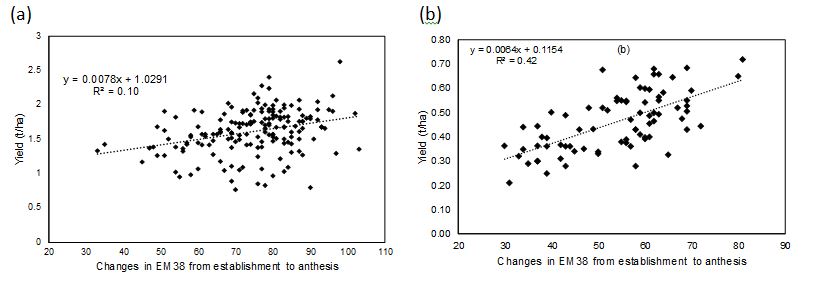
Figure 8. Relationships between soil water extraction between sowing and anthesis with wheat grain yield at (a) non-sodic site and (b) sodic site in 2018.
Calcium concentration in young mature leaf was correlated with higher yield
In 2015 and 2016, there were no significant differences in the concentration of elements measured in the youngest mature leaves between sites and genotypes (data not shown). By contrast, in 2017 and 2018, calcium and potassium concentrations were significantly higher in the youngest mature leaves at the non-sodic site than in the sodic site (Figure 9). However, the differences between wheat genotypes were significant only for calcium. This suggests that leaf calcium concentration might be useful to distinguish performance between sites and genotypes. This result agrees with observations made in previous seasons, where good discrimination in performance was observed between sodic and non-sodic sites (Dang et al. 2016).
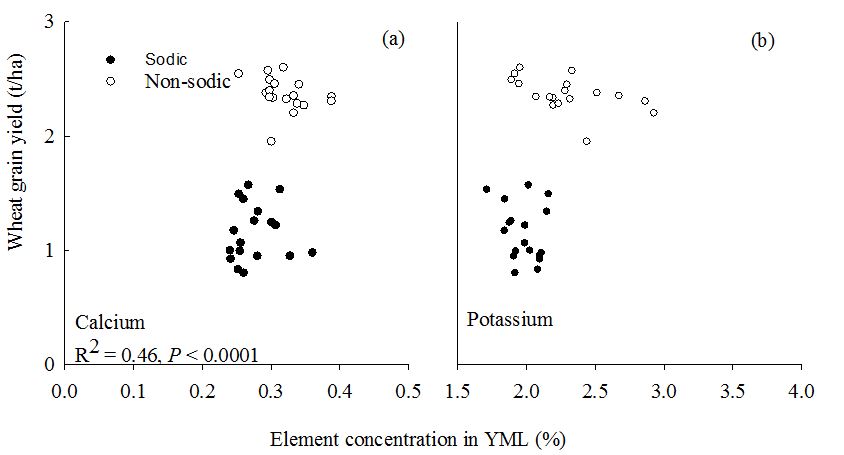
Figure 9. Relationships between element concentration in young mature leaf of wheat at anthesis and wheat grain yield at (a) non-sodic site and (b) sodic site in 2018
Discussion
Crop performance under non-sodic conditions is not a good indicator of that in the presence of sodicity
Experiments in 2017 and 2018 indicated substantial differences between performances of wheat genotypes under sodic soil conditions with subsoil constraints. Results indicated that performance under non-sodic conditions were not a good indicator of performance in the presence of sodic soils with variable subsoil constraints. Comparing the grain yields of wheat genotypes grown at the sodic site to that at the non-sodic site, significantly higher ESP to a depth of 0.6 m in the sodic soil resulted in reduced grain yields of wheat genotypes. It has been shown that ESP >6 % in the surface soil (Rengasamy et al. 2002) and >19 % in the subsoil (Nuttell et al. 2003) reduce grain yield of most crops. Grain yield on sodic soils is often less than 50% of the potential yield. Dalal et al. (2002) found that wheat yield in north-eastern Australia decreased from 3.5 t/ha to <2 t/ha as a result of sodicity (expressed as ESP) increasing from 4 to 16 % in the topsoil (0-0.1 m soil depth). In southern Australia, Rengasamy et al. (2002) reported a nearly linear decline in grain yield with increasing ESP in the surface soil for 30 different crop and pasture types. It is important to note that although all genotypes of wheat had reduced grain yield when grown at the sodic site compared to the non-sodic site in 2017 and 2018, the ranking of different genotypes varied at the different sites. In general, wheat cultivars Baxter and Sunmate were highly ranked at the non-sodic site. However, rankings at the non-sodic site were not a good indicator of rank at the sodic site. Southern and western regions lines such as Corack, Tammarin Rock and Emu Rock were highly ranked at the sodic site. These results suggest that selection and recommendation of wheat genotypes for sodic sites needs to be based on testing done in the presence of soil constraints.
Differences in soil moisture extraction was the major determinant of performance differences in sodic soils with sub-soil constraints
All genotypes of wheat grown at the sodic site had reduced water extraction as compared to the non-sodic site in 2017 and 2018. Shaw (1997) showed a strong negative relationship between the effects of exchangeable sodium in the root zone on measured PAWC over the rooting depth of a crop in clay soils. Dalal et al. (2002) reported decreased PAWC from 120 mm to 80 mm with increasing ESP from 5 to 30% in the top 0.6 m soil depth in clay soils from north-eastern Australia. In the present study, the presence of high chloride concentration in the subsoil (below 0.90 m soil depth) at the sodic site likely further restricted water extraction, resulting in further reduction in PAWC. Dang et al. (2008) showed that subsoil chloride concentrations had a greater effect in reducing soil water extraction and grain yields of five crop species studied than did salinity or sodicity, per se. Subsoil chloride in the 0.90-1.10 m soil depth layers at >800 mg/kg has been shown to reduce wheat grain yield by 10% (Dang et al. 2008). In the present study, the chloride concentration in the subsoil at the sodic site was well above this threshold chloride concentration.
Concentrations of calcium in wheat may provide a useful surrogate trait to select for adaptation to sodic soil with variable subsoil constraints
The relationship between calcium concentration in youngest mature leaves with grain yield of wheat genotypes grown on the sodic and non-sodic sites was clear. The calcium concentration in youngest mature leaves of wheat genotypes grown on sodic soil was <0.35% and most genotypes had calcium concentration ≤ 0.25%. These levels were less than the critical limit (0.25%) for plant growth (Reuter et al. 1997). Most wheat genotypes grown at the sodic site had sodium concentrations <0.05% (data not shown). Generally, sodium becomes physiologically toxic to wheat at plant tissue levels greater than 0.1% (R. Munns, pers. comm.). Most of the wheat genotypes in the present study had sodium concentration <0.1% which corroborates with an earlier report suggesting that most of the Australian wheat genotypes accumulate sodium in the tissue well below the critical level (Liu et al. 2000). Wheat accumulated higher concentrations of potassium in the youngest mature leaves, but the differences between genotypes grown on the sodic site compared to the non-sodic site were not significant. Potassium concentration in the youngest mature leaves of wheat was well above the critical concentration for the growth of wheat (Reuter et al. 1997). The decrease in grain yield of wheat genotypes in the present study, beside other factors, is likely due to a combination of factors that include decrease in water extraction and calcium concentration in the plant tissues in the sodic soil.
Conclusions
Differences in wheat grain yield between sites varied greatly between seasons. In 2017 and 2018, wheat yields were lower at the sodic sites with variable subsoil constraints. In contrast, there was little difference in yield between sites in 2015 and 2016 due to higher than normal in-crop rainfall which reduced reliance on stored soil water. The yield ranking for genotypes at the non-sodic sites was not well correlated with that at sodic sites. Thus, selection for yield potential at non-sodic sites is not a good predictor of performance at sodic sites. However, yield rankings of genotypes continued to differ between unconstraint and constraint sites. Overall, certain genotypes tended to rank relatively more tolerant to sodic soils with variable subsoil constraints than others. The difference in water extraction between emergence and anthesis (PAWC) was significantly different between genotypes at sodic site as compared to non-sodic. Most wheat genotypes grown at the sodic sites had calcium concentrations below the critical level of <0.25% in the youngest mature leaves. Wheat grain yield increased significantly with increasing calcium. We successfully identified and quantified useful genetic variation in tolerance to sodic soils with variable subsoil constraints suggesting potential to breed new cultivars with superior tolerance.
References
Anzooman M, Christopher J, Mumford M, Dang YP, Menzies NW, Kopittke PM (2018) Selection for rapid germination and emergence may improve wheat seedling establishment in the presence of soil surface crusts. Plant and Soil, 426: 227-239.
Dang YP, Christopher JT, Dalal RC (2016) Genetic diversity in barley and wheat for tolerance to soil constraints. Agronomy, 6(4), 55
Dang YP, Dalal RC, Routley R, Schwenke GD & Daniells I (2006) Subsoil constraints to grain production in the cropping soils of the north-eastern region of Australia: An overview. Australian Journal of Experimental Agriculture, 46, 19-35
Dang YP, Dalal RC, Buck SR, Harms B, Kelly R, Hochman Z, Schwenke GD, Biggs AJW, Ferguson NJ & Norrish S (2010) Diagnosis, extent, impacts, and management of subsoil constraints in the northern grains cropping region of Australia. Australian Journal of Soil Research, 48, 105-119
Dang YP, Dalal RC, Mayer DG, McDonald M, Routley R, Schwenke GD, Buck SR, Daniells IG, Singh DK & Manning W (2008) High subsoil chloride concentrations reduce soil water extraction and crop yield on vertosols in north-eastern Australia. Australian Journal of Agricultural Research, 59, 321-330
Dang YP, Routley R, McDonald M, Dalal RC, Singh DK, Orange D & Mann M (2006) Subsoil constraints in vertosols: Crop water use, nutrient concentration, and grain yields of bread wheat, durum wheat, barley, chickpea, and canola. Australian Journal of Agricultural Research, 57, 983-998
Dalal R, So B & Blasi M (2002) High sodium levels in subsoil limits yield and water use in marginal cropping areas; Grains Research & Development Corporation, Final Report DNR 6, 2002
Hochman Z, Probert M, Dalgliesh NP (2004) Developing testable hypotheses on the impacts of sub-soil constraints on crops and croplands using the cropping systems simulator APSIM. In ‘Proceedings of the 4th International Crop Science Congress, 26 Sep – 1 Oct 2004, Brisbane, Australia’ (Eds. T Fischer, N Turner, J Angus, L McIntyre, M Robertson, A Borrell).
Liu CY, Paull JG & Rathjen AJ (2000) Shoot mineral composition and yield of wheat genotypes grown on a sodic and non-sodic soil. Australian Journal of Experimental Agriculture, 40, 69-78
Nuttall JG Armstrong RD & Connor DJ (2003) Evaluating physio-chemical constraints of calcarosols on wheat yield in Victorian southern Mallee. Australian Journal Agricultural Research, 54, 487-498
Nuttall JG & Armstrong RD (2010) Impact of subsoil physicochemical constraints on crops grown in the Wimmera and Mallee is reduced during dry seasonal conditions. Australian Journal of Soil Research, 48, 125-139
Munns R & James RA (2003) Screening methods for salinity tolerance: A case study with tetraploid wheat. Plant and Soil, 253, 201-218
Munns R, Gardner PA, Tonnet ML & Rawson H (1988) Growth and development in NaCl-treated plants. Ii. Do Na or Cl-concentrations in dividing or expanding tissues determine growth in barley? Functional Plant Biology, 15, 529-540
Rayment GE& Lyons DJ (2011) Soil chemical methods: Australasia. CSIRO publishing.: 2011; Vol. 3.
Rengasamy P (2002) Transient salinity and subsoil constraints to dryland farming in Australian sodic soil: An overview. Australian Journal of Experimental Agriculture, 42 (3), 351-361
Reuter DJ, Robinson JB& Dutkiewicz C (1997) Plant analysis: An interpretation manual. CSIRO Publishing: Melbourne
Sadras V, Baldock J, Roget D, Rodriguez D (2003) Measuring and modelling yield and water budget components of wheat crops in coarse-textured soils with chemical constraints. Field Crops Research 84, 241–260
Shaw R (1997) Salinity and sodicity. In Sustainable crop production in the sub-tropics: An Australian perspective pp 79-96.
Acknowledgements
The research undertaken as part of this project is made possible by the significant contributions of growers through both trial cooperation and the support of the GRDC, the authors would like to thank them for their continued support.
Contact details
Yash Dang
School of Agriculture and Food Sciences
The University of Queensland
Ph: 0427 602 099
Email: y.dang@uq.edu.au
Varieties displaying this symbol beside them are protected under the Plant Breeders Rights Act 1994
® Registered trademark
GRDC code: UA00159 Improving wheat yields on sodic or magnesic or dispersive soils
GRDC Project Code: UA00159,
Was this page helpful?
YOUR FEEDBACK
