Tactical decisions on crop sequencing - opt in/opt out decisions based on PAW triggers
Author: Jeremy Whish (CSIRO), Lindsay Bell (CSIRO), Peter DeVoil (QAAFI) | Date: 02 Aug 2019
Take home messages
- Planting an opportunistic crop to reduce fallow lengths can improve economic returns if strict rules are followed
- Increasing the intensity of a rotation beyond the environmental potential of the area reduces the returns across the whole rotation
- Planting on less than 100 mm of stored soil water in eastern environments and less than 150 mm in western environments significantly increases the probability of failed (negative gross margin) crops.
Introduction
This paper reports on some of the work conducted as part of GRDC’s Northern Farming Systems project. One of the goals of this project is to use both experimental research and simulation modelling to understand the benefits and trade-offs associated with different crop rotations across the northern grains region. For this paper we will use the term rotation to mean a sequence of crops and fallows that regularly follow each other in a cyclic pattern. We are aware that not all grain growers follow a structured fixed rotation and we are not advocating this approach. However, by examining rotations in this structured way, key features (benefits and costs) of the sequence can be observed.
Long fallows are a feature of northern grain production and are mainly used to move between summer and winter phases and to accumulate water to reduce the risk of crop failure. However, there are times when the crop sequence could be intensified by replacing a long fallow with a double crop to move between summer and winter phases or to incorporate an additional wheat crop that reduces a long fallow to a short fallow.
Our previous modelling analyses have shown that time in fallow/crop are key drivers of system water use efficiency, profitability and risk. In most production environments, cropping sequences with higher intensity (i.e. more time in crop) have higher average returns over the long-term, however, this comes with increased risk (frequency of crops with negative gross margins). However, our previous analysis only considered strict rotations where all crops were sown irrespective of soil water conditions and as a result, crops are frequently sown on marginal soil water levels in higher intensity systems. Hence, the question we have examined here, how much can risk be mitigated by only taking opportunities to sow double crops in the rotation when soil water triggers are met. We have tested some opportunistic rules to try and identify when to plant an opportunity crop and what effect it has on the overall rotation. In particular we aim to identify where, when and how the rotation can be intensified to increase profitability without significantly increasing production risk, and what triggers to use to make these decisions. This analysis will help guide answers to the questions:
- What amount of soil water do I need to put that additional opportunity crop in?
- What affect will it have on the rest of the rotation and subsequent crops?
- Is it worth the additional risk?
Methods
Simulations
This study is a simulation analysis that uses the APSIM systems framework (Holzworth et al. 2015) to simulate crop rotations from historic climate records (1957-2017). APSIM has a long history of simulating northern farming systems (Whish et al. 2007;Carberry et al. 2009) and uses environmental signals to trigger appropriate management decisions. However, these simulations only considered the dynamics of water and nutrients. Losses due to waterlogging, heat or frost shock events, disease, pests, weeds or crop nutrition other than nitrogen were not considered by these simulations.
The simulations of all crop sequences were phased, so that each year of the rotation was exposed to each year of the climate record (1956-2016). All rotations were run at each of 6 sites (Table 1) to highlight the importance of matching crop choice and intensity to the environmental conditions. The sites were selected to represent an east-west rainfall gradient at both a northern (Pampas – Billa Billa – Mungindi) and southern latitude (Breeza – Gilgandra – Nyngan). This paper will focus on the northern transect only. Each site used a locally representative soil (Table 1).
Table 1. Soil details used in simulations at the 6 locations across the northern grains region
Location | Soil description | APSoil No. | Soil plant available water capacity (PAWC) (mm) | Annual rain | |||
|---|---|---|---|---|---|---|---|
Wheat | Sorghum | Chickpea | Mungbean | ||||
Pampas | Black Vertosol | 006 | 290 | 234 | 290 | 211 | 698 |
Billa Billa | Grey Vertosol | 220 | 188 | 188 | 167 | 140 | 619 |
Mungindi | Grey Vertosol | 157 | 186 | 201 | 186 | 141 | 505 |
Breeza | Black Vertosol | 123 | 264 | 273 | 210 | 207 | 680 |
Gilgandra | Clay loam | 249 | 195 | 195 | 195 | 89 | 560 |
Nyngan | Sandy clay | 1162 | 188 | 188 | 188 | 108 | 445 |
Rotations
This analysis is designed to look in detail at increasing intensity both in a fixed pattern and using opportunistic crop inclusion. A set of three base crop sequences were simulated each with a low and a high crop intensity, with varying lengths of fallows and time in crop (Table 2). The three sequences were chosen to span different cropping intensities that match the different production environments of the east west transect. In these base rotations (high and low intensity) the crops in the sequence were sown every year (must sow crops) in a fixed pattern within their sowing window (Table 2). If the sowing rule had not been met by the end of the sowing window then the crop was sown at this time. In contrast to these higher and lower intensity systems, an opportunistic sequence was simulated where a crop was either sown or remained in fallow based on the volume of soil water. Crops were sown when the volume of soil water exceeded the critical threshold during the sowing window (Table 3). Simulations were also conducted with two different soil water thresholds used to trigger a planting event (base – higher PAW at sowing, and aggressive – lower PAW at sowing) (Table 3). To ensure that the rotations did not get out of sequence and could be phased, specific parts of the rotation were fixed so these crops were sown every year despite the rules.
Table 2. Description of low and high intensity rotations where all crops are sown every year and opportunistic crop rotation where some crops are only grown when soil water exceeds a minimum threshold (shown in grey with an underline).
Rotation Intensity | Winter | Balanced - conservative | Balanced - aggressive | |||
|---|---|---|---|---|---|---|
Crops | /yr | Crops | /yr | Crops | /yr | |
Low | xW|xx|xCh|xx | 0.5 | Sx|xCh|xW|xx | 0.75 | Sx|xW|xx | 1.0 |
High | xW|xW|xCh|xW | 1.0 | Sx|xCh|xW|Mgx | 1.0 | SCh|xW|Mgx | 1.33 |
Opportunity | xW|xW|xCh|xW | 0.5-1.0 | Sx|xCh|xW|Mgx | 0.75-1.0 | SCh|xW|Mgx | 0.66-1.33 |
Moderate Intensity | SCh|xW|xx | 1 | ||||
Mod-Int Opportunity | SCh|xW|xx | 0.5-1.0 | ||||
W= Wheat, Ch = Chickpea, Mg = Mungbean, x= 6 month fallow.
Table 3. Summary of key management rules to trigger sowing, and crop agronomic management rules applied to crops across the set of simulations
Crop | Sowing window | Minimum planting soil water (mm) | APSIM variety used | Row spacing (cm) | Plant density (#/m2) | Starter fertiliser (N kg/ha) | |
|---|---|---|---|---|---|---|---|
base | agg. | ||||||
Wheat | 15 May-1 Jul | 150 | 100 | Gregory | 25 | 100 | 25 |
Chickpea | 1 May-1 Jul | 150 | 100 | Amethyst | 50 | 30 | 0 |
Sorghum | 15 Oct – 15 Jan | 150 | 100 | Buster | 100 | 7 | 25 |
Mungbean (spring) | 15 Oct-15 Nov | 100 | 60 | Green Diamond | 50 | 30 | 0 |
Mungbean (double) | 15 Nov – 15 Jan | 100 | 60 | ||||
Economic analysis parameters
Average annual gross margin (GM) analysis was conducted for each phased crop sequence using the equation below. Long-term average grain prices (2008-2017) and current variable input prices were used and these were held constant across all locations. Insurance and levy costs together were 2% of the grain income value and were deducted from grain prices. The price for nitrogen (N) fertiliser applied was set at $1.30/kg N and the cost of each fallow spray was set at $17/ha. The simulations did not account for application losses of N fertilisers; therefore, an additional 30% of applied N was used to ensure fertiliser N reached the soil mineral N pool. The baseline “variable cost” for each crop included planting, non-N nutrients and in-crop pesticide applications. Harvesting costs, N fertiliser and fallow spray frequency were included separately, as these varied between the crop sequences or if crops failed. Crops were considered as failed if the yield was less than the thresholds (Table 4) and harvesting costs were not included. Machinery costs were based on an owner-operated production system; therefore, fuel, oil, repairs and maintenance (FORM) costs where included in the variable costs.
Table 4. Crop prices and variable costs used in gross margin calculations for crop sequences
Crop | Average price ($/t)# | Harvest cost ($/ha) | Variable costs ($/ha) |
|---|---|---|---|
Wheat | 264 | 40 | 175 |
Sorghum | 225 | 55 | 218 |
Chickpea | 569 | 45 | 284 |
Mungbean | 710 | 55 | 276 |
#farm gate price with grading & additional harvesting costs already deducted
Results
There are a large range of combinations of crop sequence by locations that were generated in this analysis. Only a selection of the most illustrative results are presented to highlight how the different options behave in the different environments.
Winter crop sequence
This conservative low intensity rotation (xW|xx|xCh|xx) is commonly used in more marginal western sites and has been previously shown to be effective for minimising risk in such environments. A large gap exists between the low intensity rotation (xW|xx|xCh|xx) and the more intensive sequence (xW|xW|xCh|xW) when sown at Pampas or Billa Billa because these environments are too reliable for such a conservative strategy and can support a more intensive crop rotation. However, at Mungindi about 50% of the time either the high or low intensity sequences have the best gross margin - the higher intensity is best in the better seasons and the low intensity in poorer years (Figure 1). This analysis shows an opportunistic strategy fills the gap between the conservative and the high intensity strategy to capitalise on the good seasons and remain conservative in the poor.
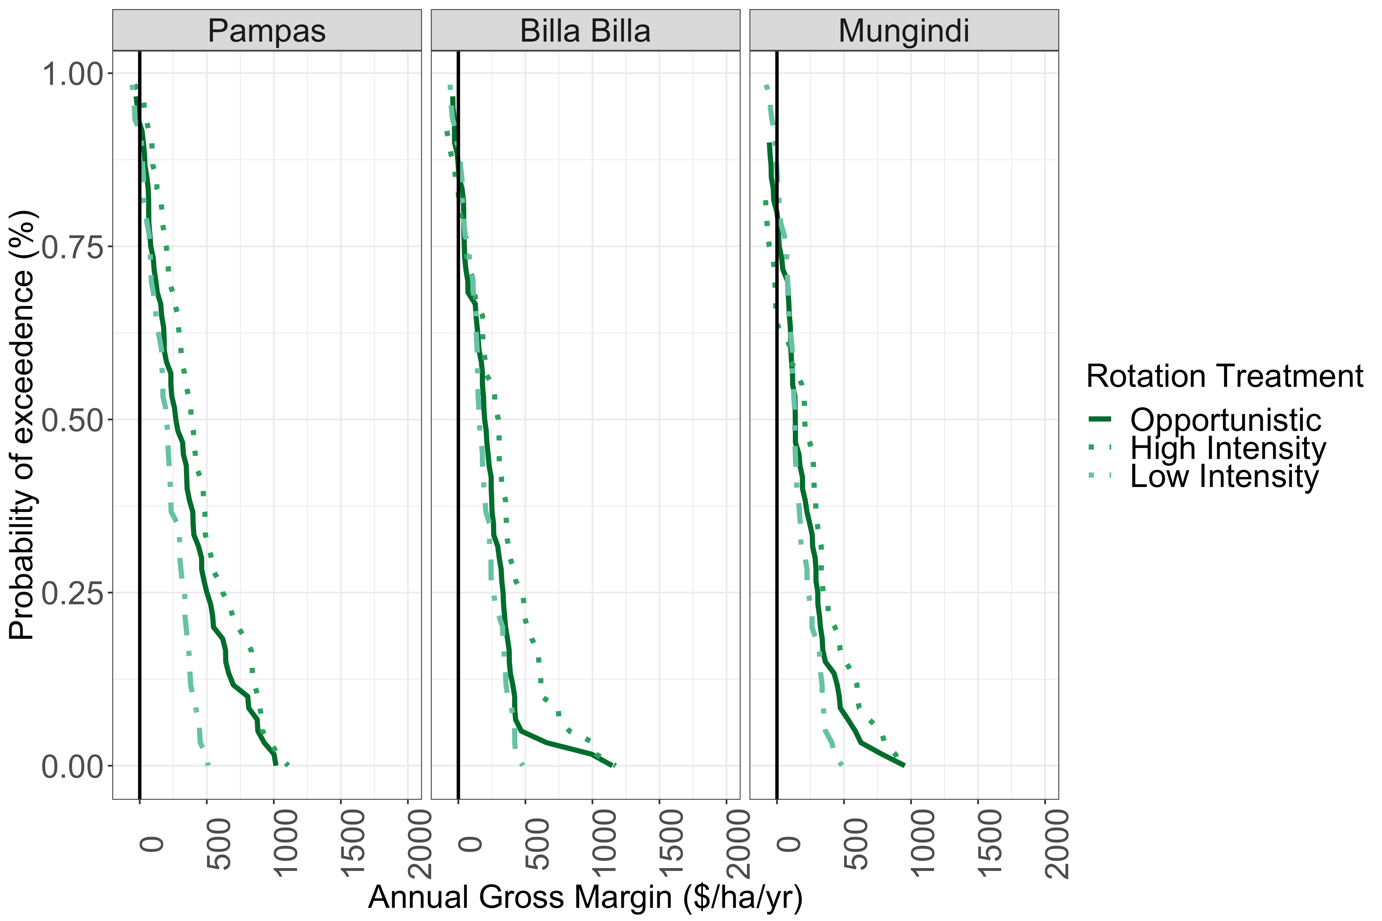
Figure 1. Comparison of the three winter-based crop rotations for low intensity (dot dash), high intensity (dot dot), and with opportunistic crop decisions (solid) at each of the three sites examining their probability of exceeding an annual rotation gross margin. The solid black line marks the zero gross margin point with negative gross margins occurring to the left of this line.
Increasing risk is associated with increasing intensity and the chance of returning a negative gross margin is one way to assess this risk (Figure 2). The environments of Pampas and Billa Billa have few failed crops with less than 20% of crops not breaking-even. However, in the more marginal area of Mungindi, imposing a rotation that has an intensity of 1 crop per year (xW|xW|xCh|xW) resulted in more than 30% of crops failing. Using the opportunistic rule the average gross margin was similar to the more intensive system, but the risk was significantly reduced to around 20% or 1 crop in 5 failing. The aggressive sowing rule increased both the risk and the returns for the opportunistic strategy in Mungindi, but reduced the risk while improving returns at Billa Billa and had no effect in Pampas.
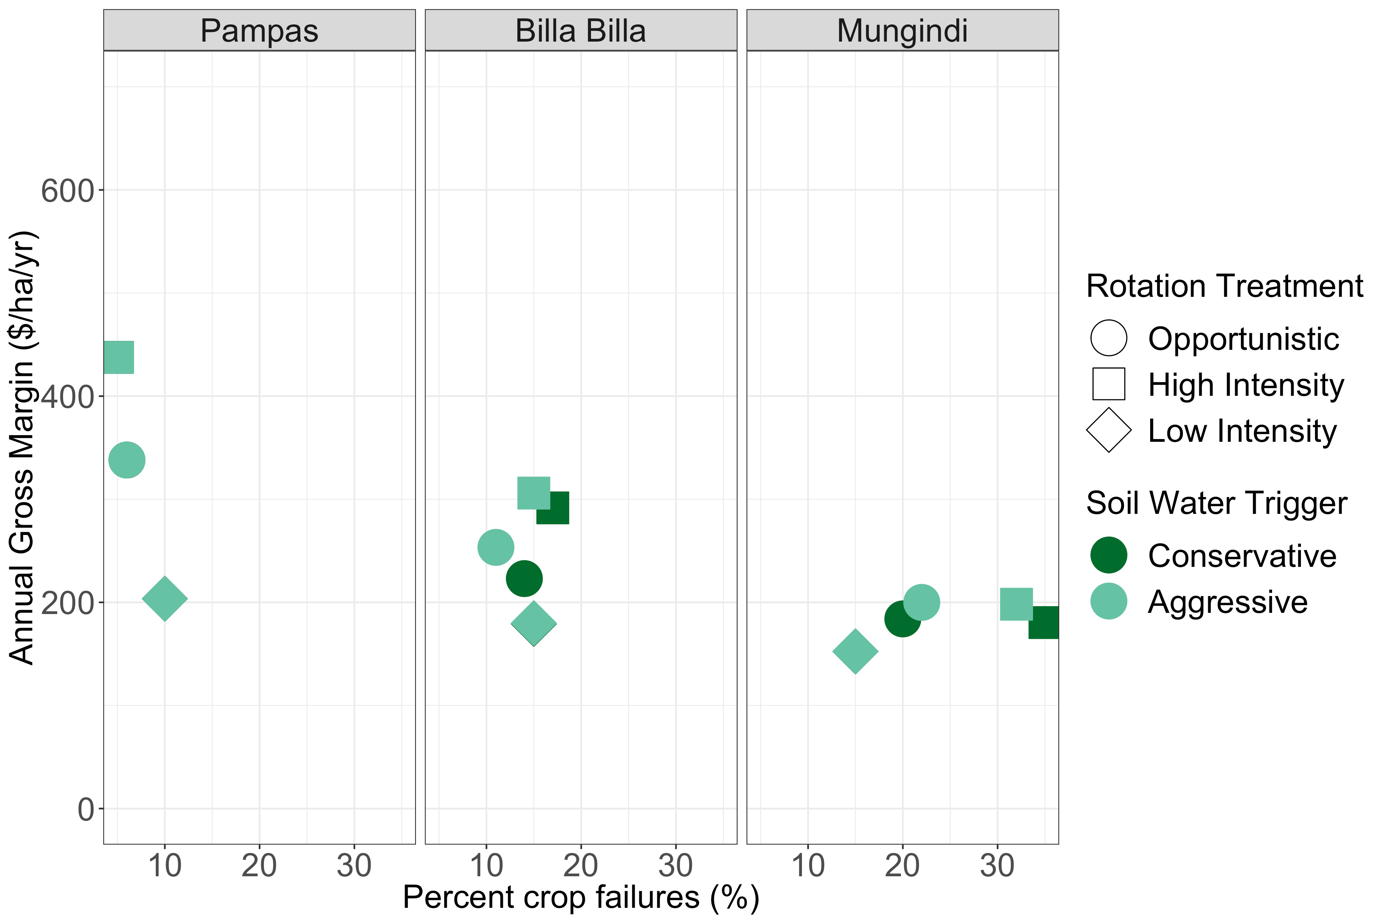
Figure 2. Mean annual gross margin compared to the percentage of failed crops for winter-based rotations of low intensity (Dimond), high intensity (Square) and using an opportunistic sowing rule (Circle). The light coloured symbols indicate an aggressive soil water trigger (100mm-wheat) and the dark symbols indicate a conservative soil water trigger (150mm-wheat).
Looking more closely at the individual components of the rotation (Table 5) highlights how the opportunistic decision, but more importantly, the decision not to sow, affects the rotation.
The second and third wheat crops (wheat_2, wheat_3) were the opportunistic crops and were only sown when 150 mm of soil water had accumulated in the sowing window. At Mungindi this meant that only 1 in 3 years would one of the additional wheat crops be sown. Hence, crop intensity over the long term only increases from 0.5 crops per year in the low intensity system to 0.66 crops per year. The average return from these crops sown only when the soil water threshold was met was more than 36% higher than the average return from crops that were sown every year. The returns from the fixed crops wheat_1 and chickpea_1 (sown every 2 years) was also increased in the opportunistic rotation. This was because when crops are sown on marginal soil water and fail, they consume resources that are no longer available to the following crops, thus reducing the subsequent yields and gross margins of these crops. On average the opportunistic strategy improved returns over the low intensity rotation by $30 and $48 if a more aggressive soil water trigger was applied.
Table 5. Individual crop performance for the conservative rotation at the low rainfall site of Mungindi. All crops are sown each year in the low and high intensity rotations, in the opportunistic rotation wheat crops may be sown in the long fallow when soil water exceeds 150 mm (base) or 100mm (aggressive) during the sowing window.
site | State | Low intensity | High intensity | Opportunistic | ||||||
|---|---|---|---|---|---|---|---|---|---|---|
% crops sown | % crops fail† | GM ($/ha) | % crops sown | % crops fail† | GM ($/ha) | % crops sown | % crops fail† | GM ($/ha) | ||
Mungindi Base soil water rule | 60 yr ave | 0.5 | 15 | 152 | 1.0 | 35 | 181 | 0.66 | 20 | 182 |
Chickpea_1 | 100 | 8 | 395 | 100 | 27 | 282 | 100 | 12 | 377 | |
Wheat_1 | 100 | 22 | 214 | 100 | 40 | 132 | 100 | 28 | 190 | |
Wheat_2 | 0 | 0 | 0 | 100 | 40 | 129 | 33 | 25 | 251 | |
Wheat_3 | 0 | 0 | 0 | 100 | 32 | 179 | 30 | 17 | 283 | |
Mungindi Aggressive soil water rule | 60 yr ave | 0.5 | 15 | 152 | 1.0 | 32 | 198 | 0.71 | 22 | 200 |
Chickpea_1 | 100 | 8 | 395 | 100 | 25 | 311 | 100 | 13 | 376 | |
Wheat_1 | 100 | 22 | 214 | 100 | 38 | 142 | 100 | 30 | 178 | |
Wheat_2 | 0 | 0 | 0 | 100 | 38 | 136 | 43 | 27 | 255 | |
Wheat_3 | 0 | 0 | 0 | 100 | 27 | 204 | 42 | 16 | 323 | |
†refers to the number of crops that failed relative to the percentage of crops sown
Balanced - conservative
The balanced- conservative rotation is designed to have both summer and winter phases (Sx|xCh|xW|xx), which was intensified through the use of either a scheduled (sown every year) or opportunistic mungbean crop (Sx|xCh|xW|Mgx) to move between the winter and summer phase. At Pampas and Billa Billa the inclusion of mungbeans opportunistically matched the returns of the high intensity strategy where they were sown every year for the majority of the seasons. A few occurrences occurred around the average when the opportunistic crop was not sown and subsequently a good season enabled a good yield and the intense system had higher returns. Pampas and Breeza show a distinct difference between the conservative 3 crops in four year rotation (SxxChxWxx) and the higher intensity system which has 1 crop per year (Sx|xCh|xW|Mgx). This suggests that in these environments there is still room for intensification to at least 1 crop per year. The minimal difference between the different rotations at Mungindi suggest this level of intensity is too high for this environment and the low intensity option is no worse than the either of the others.
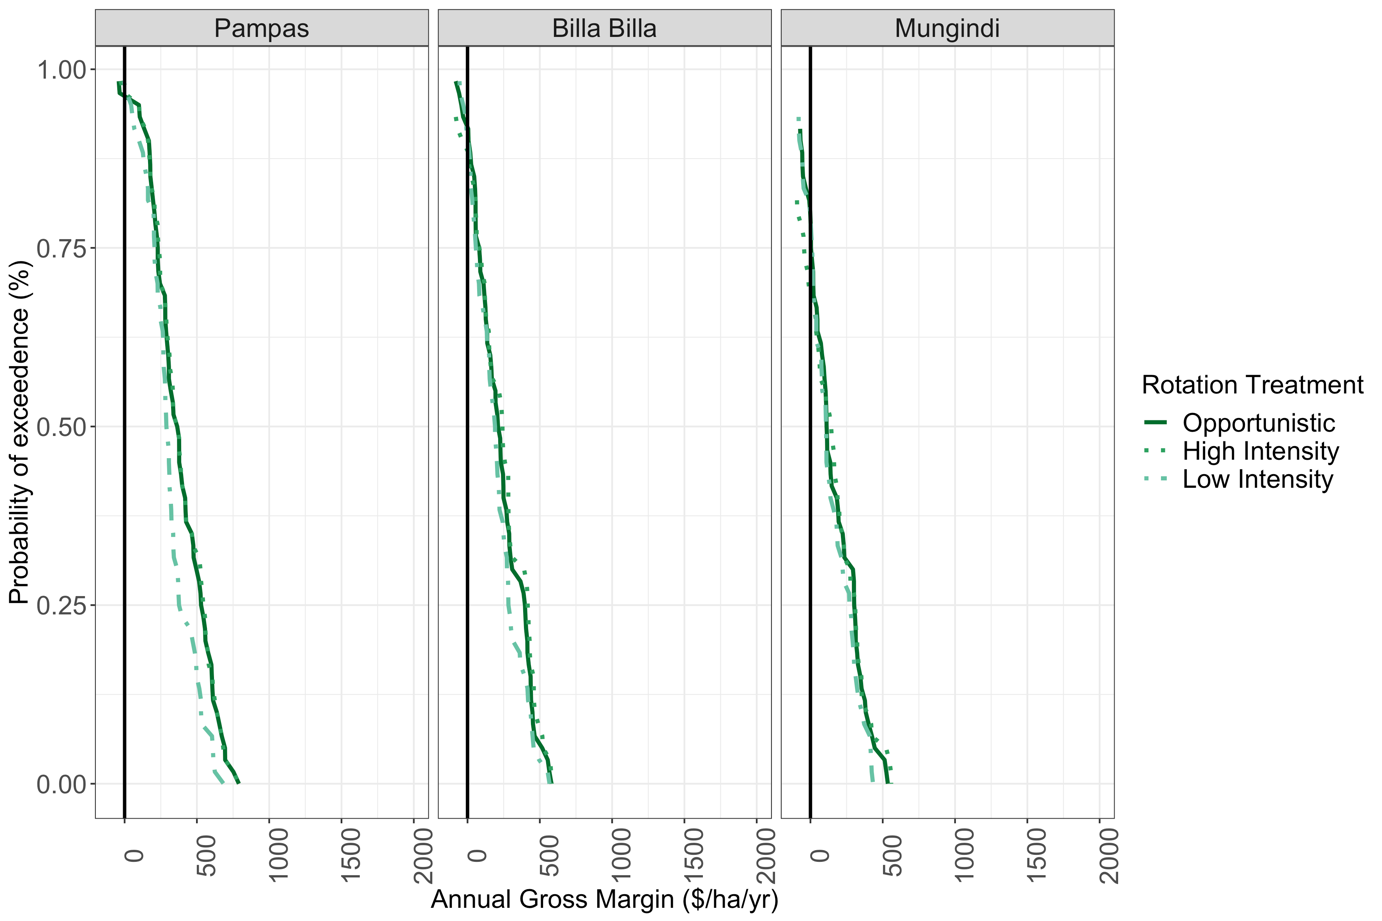 Figure 3. Comparison of the three balanced-conservative crop rotations of low intensity (dot dash), high intensity (dot dot), and with opportunistic crop decisions (solid) at each of the three sites examining their probability of exceeding an annual rotation gross margin. The solid black line marks the zero gross margin point with negative gross margins occurring to the left of this line.
The Opportunistic use of mungbeans reduced the risk of crops with negative gross margins compared to a crop sequence where these were sown every year. In fact the risk of crop failures was hardly higher than the low intensity system where mungbeans were not used at all. The examination of the number of failed crops highlights the limitations of intensifying a crop sequence in the dryer environment of Mungindi (one in three crop failures) and the minimal difference between treatments at pampas show there is still potential to intensify more in this environment. The aggressive sowing strategy had no effect on the low intensity rotation at Billa Billa, but increased risk and lowered the average returns for the opportunistic and intense sequences.
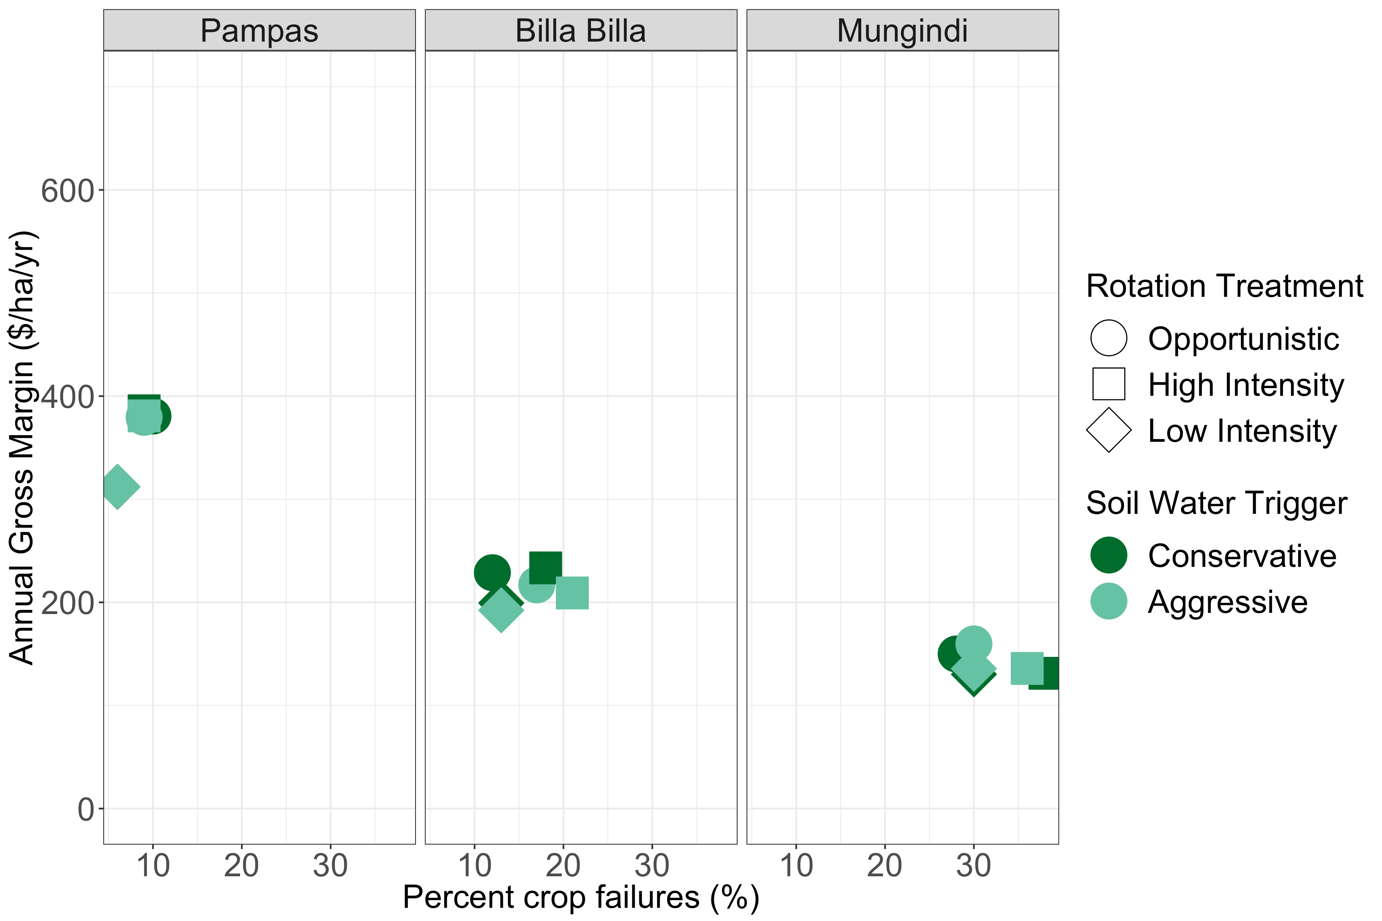 Figure 4. Mean annual gross margin compared to the percentage of failed crops for the balanced conservative rotations of low intensity (Dimond), high intensity (Square) and using an opportunistic sowing rule (Circle). The light coloured symbols indicate an aggressive soil water trigger (100mm-wheat) and the dark symbols indicate a conservative soil water trigger (150mm-wheat). The opportunistic sowing of mungbean achieved a gross margin similar to or better than the high intensity rotation with similar risk to the low intensity rotation at all sites when the conservative (base) sowing rule was applied.
Examining the components of the rotation (Table 6) highlights the importance of only planting a crop when resources are present to give it the best possible chance of success. The fixed rotation that sowed mungbeans every year had 38% and 44% of crops failing at Billa Billa for the base and aggressive sowing water strategies. In comparison, the opportunistic rotation had 11% failed mungbean crops for the base soil water trigger, but 39% for the aggressive strategy. At the same time the annual gross margin was similar but 60% fewer crops were planted using the conservative base sowing trigger and 31% fewer crops were sown with the aggressive sowing strategy.
Table 6. Individual crop behaviour for the balanced rotations conducted at the medium rainfall site of Billa Billa
site | State | Low intensity Sx|xCh|xW|xx | High intensity Sx|xCh|xW|Mgx | Opportunistic Sx|xCh|xW|Mgx | ||||||
|---|---|---|---|---|---|---|---|---|---|---|
% crops sown | % crops fail† | GM ($/ha) | % crops sown | % crops fail† | GM ($/ha) | % crops sown | % crops fail† | GM ($/ha) | ||
Billa Billa Base soil water rule | 60 yr ave | 75 | 13 | 266 | 100 | 19 | 311 | 85 | 12 | 298 |
Chickpea_1 | 100 | 9 | 500 | 100 | 9 | 510 | 100 | 9 | 508 | |
Mungbean_1 | 0 | 100 | 38 | 113 | 40 | 11 | 313 | |||
Sorghum_1 | 100 | 11 | 351 | 100 | 16 | 396 | 100 | 11 | 370 | |
Wheat_1 | 100 | 18 | 210 | 100 | 11 | 224 | 100 | 18 | 215 | |
Billa Billa Aggressive soil water rule | 60 yr ave | 75 | 13 | 267 | 100 | 21 | 280 | 92 | 19 | 279 |
Chickpea_1 | 100 | 9 | 503 | 100 | 9 | 535 | 100 | 9 | 522 | |
Mungbean_1 | 0 | 100 | 44 | 76 | 69 | 39 | 168 | |||
Sorghum_1 | 100 | 14 | 311 | 100 | 20 | 276 | 100 | 18 | 298 | |
Wheat_1 | 100 | 11 | 216 | 100 | 11 | 231 | 100 | 11 | 225 | |
†refers to the number of crops that failed relative to the percentage of crops sown
Balanced - aggressive
The intense rotations tested here were examined to push the environment and capitalise on the higher rainfall conditions in the more eastern environment of Pampas. In these sequences two options for intensifying the farming system were used. These were: 1. involving a chickpea double crop sown either every year or opportunistically following sorghum (SCh|xW|xx) and 2. further intensifying the system with a mungbean double crop sown either every year or opportunistically following wheat (SCh|xW|Mgx). These three different options provide a wide range of crop intensities, ranging from 2 crops in 3 years (0.66 crops/yr) to 4 crops in 3 years (1.3 crops per yr). The data falls into 2 clumps, but the key message is that in the eastern environment of Pampas the opportunistic rotations matched the fixed rotations in terms of gross margin for the majority of seasons with little difference between the opportunistic and the intense rotation (Figure 5) apart from risk (Figure 6).
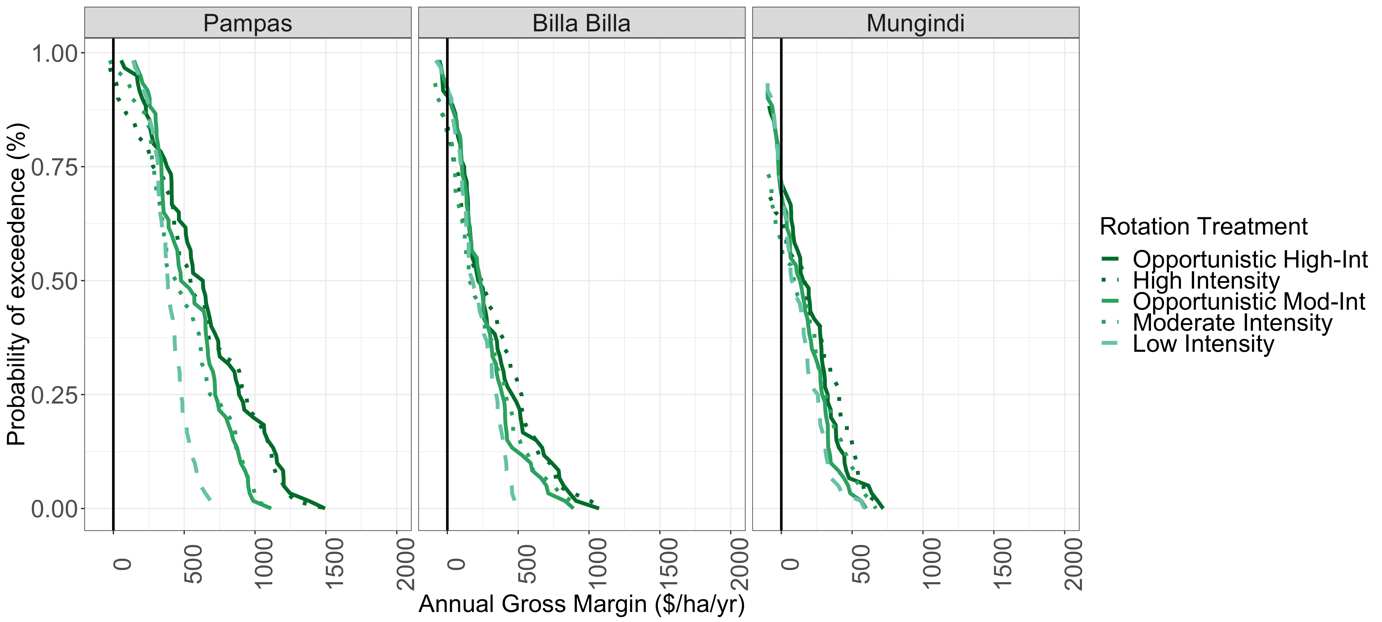 Figure 5. Comparison of the balanced- aggressive crop rotations of low intensity (light grey dash), high intensity (dot dot), and with opportunistic crop decisions (solid). The summer opportunity rotations are dark and the winter rotations are grey. The solid black line marks the zero gross margin point with negative gross margins occurring to the left of this line.
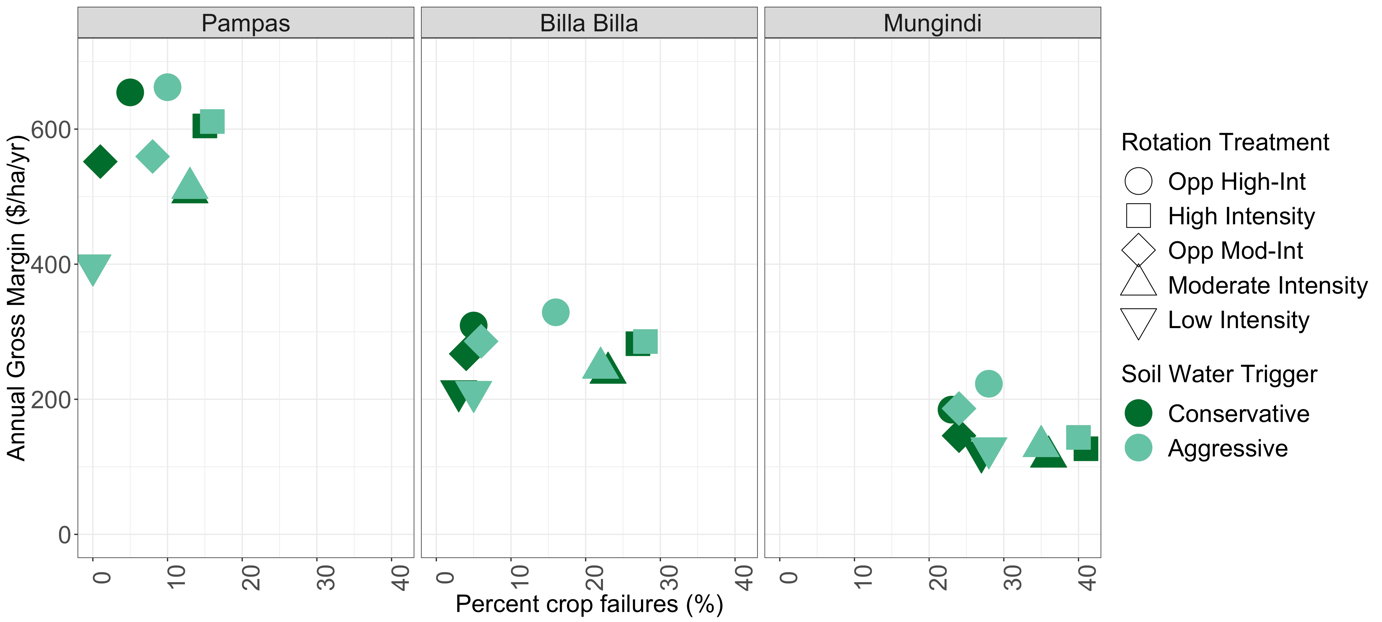 Figure 6. Mean annual gross margin compared to the percentage of failed crops for balanced-aggressive rotations of low intensity (downward triangle), high intensity summer(square), high intensity winter (upward triangle), using an opportunistic sowing rule for summer (circle) and using an opportunistic sowing rule for winter (diamond). The light coloured symbols indicate an aggressive soil water trigger (100mm-wheat) and the dark symbols indicate a conservative soil water trigger (150mm-wheat). The opportunistic sowing of mungbean and chickpea reduce the fallow length and achieved a high gross margin with minimal risk when sown in the eastern environments of Pampas.
The use of the opportunistic planting rules significantly reduced the number of crops producing a negative gross margin while increasing the average returns from each of the individual crops. For example, by only sowing the chickpea double crop after sorghum when 150 mm of soil water was present, reduced the frequency of crop failures from 38% at Pampas to 6%. This also increased the average gross margin for chickpea by over $400/ha. A similar story was also true for the opportunistic incorporation of mungbeans into the cropping system. Overall, using an opportunistic approach to double-crops of chickpea and mungbeans in this environment was predicted to achieve equal or higher overall average annual returns and dramatically reduced risk compared to a scheduled approach. The use of a lower threshold for sowing decisions did increase the risk and reduced the returns from each individual crop; however, the increased number of crops sown increased long term returns on average by about $10/ha/yr. (Table 7)
Table 7. Individual crop behaviour for each of the intense rotations conducted at the high rainfall sites of Pampas
Site | State | Low intensity | Moderate intensity | Opportunistic | High intensity | Opportunistic | ||||||||||
|---|---|---|---|---|---|---|---|---|---|---|---|---|---|---|---|---|
% crops sown | % crops fail† | GM ($/ha) | % crops sown | % crops fail† | GM ($/ha) | % crops sown | % crops fail† | GM ($/ha) | % crops sown | % crops fail† | GM ($/ha) | % crops sown | % crops fail† | GM ($/ha) | ||
Pampas Base soil water rule | 60 yr ave | 0.66 | 0 | 395 | 1 | 14 | 508 | 0.86 | 3 | 546 | 1.33 | 17 | 604 | 1.11 | 7 | 652 |
Chickpea_1 | 0 | 0 | 0 | 100 | 38 | 176 | 60 | 6 | 610 | 100 | 42 | 153 | 48 | 10 | 623 | |
Mungbean_1 | 0 | 0 | 0 | 0 | 0 | 0 | 0 | 0 | 0 | 100 | 17 | 395 | 85 | 14 | 412 | |
Sorghum_1 | 100 | 0 | 807 | 100 | 0 | 886 | 100 | 0 | 851 | 100 | 2 | 803 | 100 | 2 | 832 | |
Wheat_1 | 100 | 0 | 391 | 100 | 5 | 462 | 100 | 3 | 444 | 100 | 5 | 467 | 100 | 3 | 484 | |
Pampas Aggressive soil water rule | 60 yr ave | 0.66 | 0 | 396 | 1 | 14 | 515 | 0.94 | 9 | 550 | 1.33 | 17 | 611 | 1.25 | 12 | 662 |
Chickpea_1 | 0 | 0 | 0 | 100 | 38 | 198 | 83 | 24 | 439 | 100 | 38 | 198 | 77 | 24 | 434 | |
Mungbean_1 | 0 | 0 | 0 | 0 | 0 | 0 | 0 | 0 | 0 | 100 | 22 | 353 | 100 | 18 | 378 | |
Sorghum_1 | 100 | 0 | 807 | 100 | 0 | 885 | 100 | 63 | 867 | 100 | 3 | 807 | 100 | 3 | 823 | |
Wheat_1 | 100 | 0 | 392 | 100 | 5 | 462 | 100 | 35 | 452 | 100 | 3 | 480 | 100 | 3 | 482 | |
†refers to the number of crops that failed relative to the percentage of crops sown
Conclusions
This paper has demonstrated that opportunistic sowing rules can be employed to increase the intensity of the farming system and increase returns relative to low intensity conservative approaches at the same time as managing risk. Two different sowing rules were examined: base (150 mm of stored water at sowing for all crops apart from mungbean that used 100 mm) vs aggressive (100mm of stored water at sowing for all crops apart from mungbean that used 60 mm). Reducing the soil water trigger marginally improved returns, but also increased risk. However, it is one tactic to intensify a rotation without including new crops. Alternatively, Increasing the soil trigger can reduce risk in some environments, but will come at the cost of cash flow and issues associated with increasing fallow length. The higher rainfall environment of Pampas was expected to significantly benefit from the more aggressive sowing strategy. However, despite significantly planting more crops, the overall returns were not dramatically increased. This suggests that even in these reliable rainfall environments a conservative soil water trigger has value in increasing production efficiency.
This work shows there are considerable benefits of opting out of a crop if the conditions are not favourable or opting in to crops opportunistically based on soil water triggers. The rules presented are robust when run over a 60 year period and show the carryover effect of a failed crop can reduce the returns of those crops that follow. However, it is always easier to not plant a crop while sitting on a computer and not looking at a pile of expensive seed in the shed. This is a difficult decision, but knowing how much water you have in the soil and how forgiving your environment is, can help answer the question should I opt in or opt out.
References
Carberry, P.S., Hochman, Z., Hunt, J.R., Dalgliesh, N., McCown, R.L., Whish, J.P.M., Robertson, M.J., Foale, M., Poulton, P.L., van Rees, H. (2009) Re-inventing model-based decision support with Australian dryland farmers. 3. Relevance of APSIM to commercial crops. Crop Pasture Sci. 60:1044–1056. doi:10.1071/CP09052
Holzworth, D.P., Snow, V.O., Janssen, S., Athanasiadis, I.N., Donatelli, M., Hoogenboom, G., White, J.W., Thorburn, P. (2015) Agricultural production systems modelling and software: Current status and future prospects. Environmental Modelling & Software 72:276–286. doi:10.1016/j.envsoft.2014.12.013
Whish, J.P.M., Castor, P.A., Carberry, P.S. (2007) Managing production constraints to the reliability of chickpea (Cicer arietinum L.) within marginal areas of the northern grains region of Australia. Crop Pasture Sci. 58:396–405. doi:10.1071/AR06179
Whish, J.P.M., Price, L., Castor, P.A. (2009) Do spring cover crops rob water and so reduce wheat yields in the northern grain zone of eastern Australia? Crop Pasture Sci. 60:517–525. doi:10.1071/CP08397
Acknowledgements
The research undertaken as part of this project is made possible by the significant contributions of growers through both trial cooperation and the support of the GRDC, the author would like to thank them for their continued support.
Contact details
Jeremy Whish
CSIRO Agriculture and Food
Ph: 07 4571 3215
Email: jeremy.whish@csiro.au
Varieties displaying this symbol beside them are protected under the Plant Breeders Rights Act 1994.
GRDC Project Code: CSP1406-007RTX,
Was this page helpful?
YOUR FEEDBACK
