Farming systems (Emerald) – Five years on, what have we learnt so far?
Author: Darren Aisthorpe (Queensland Department of Agriculture and Fisheries) | Date: 27 Nov 2019
Take home messages
- Fallow Efficiency (FE) % measures a system’s ability to convert rainfall into PAW prior to planting
- Efficiency of systems which strongly rely on stored PAW to grow a crop tend to have much lower FE %
- Water Use Efficiency (WUE) measures how efficiently a system converts water into grain or income
- A system’s ability to not only fill the PAW bucket quickly, but also take full advantage of that PAW during the growing season, tends to perform best.
Background
While advances in agronomy and the performance of individual crops have helped grain growers to maintain their profitability, current farming systems are under performing, with only 30% of the crop sequences in the northern grains region achieving 80% of their water limited yield potential. Growers face challenges from declining soil fertility, increasing herbicide resistance and increasing soil-borne pathogens in their farming systems. Changes will be needed to meet these challenges and to maintain the productivity and profitability of our farming systems.
Consequently, the Queensland Department of Agriculture and Fisheries (DAF), Commonwealth Scientific and Industrial Research Organisation (CSIRO) and the New South Wales Department of Primary Industries (NSW DPI) are collaborating to conduct an extensive field-based farming systems research program focused on developing farming systems to better use the available rainfall to increase productivity and profitability with the question;
‘Can systems performance be improved by modifying farming systems in the northern region?’
This research question is being addressed at two levels by the Northern Farming Systems Initiative; to look at the systems performance across the whole grains region, and to provide rigorous data on the performance of local farming systems at key locations across the region.
In early 2015, six locally relevant, farming systems were implemented in Emerald. A range of agronomic practices (i.e. rows spacing, plant population), crop types and rotations, crop frequency, planting time/windows, tillage practices, fertiliser rates and planting moisture triggers were adopted and strategically used to develop the following six farming system treatments:
1. Baseline- A conservative zero tillage system targeting one crop/year. Crops include wheat, chickpea and sorghum.
2. Higher legume- The frequency of pulses is increased in this system (i.e. one pulse every two years) to assess the impact of more legumes on profitability, soil fertility, disease and weeds.
3. Higher crop intensity- Focused on increasing the cropping intensity to 1.5 crops/year when water allows. Crops include wheat, chickpea, sorghum, mungbean and forage crops/legumes.
4. Higher nutrient supply- Nitrogen fertiliser will be applied to allow the crops to achieve 90% of the maximum seasonal yield potential for the PAW at planting. Additional phosphorus (P) fertiliser will also be applied to fully replace P removed by the previous crop. This system will be planted to the same crop as the Baseline each year, so that the only difference is the amount of applied nutrients. This system will answer what are the economic and agronomic implications of increased nitrogen and phosphorus rates that target higher yields and protein level in an environment of variable climate.
5. Higher soil fertility- This system is a repeat of the Higher nutrient supply, but with the addition of 60 t/ha of manure added up front. The system was designed to see if higher initial soil fertility could be maintained with greater nutrient inputs (targeting 90% of yield potential based on soil moisture (PAW).
6. Integrated weed management - This minimum tillage system is focused on one crop/year but employs a wide range of practices to reduce the reliance on traditional knockdown herbicides in Central Queensland (CQ) farming systems. Crops include wheat, chickpea, sorghum and mungbean.
Table 1. Crop rotation used for different treatments
Treatment | Winter 2015 | Summer 2015/16 | Winter 2016 | Summer 2016/17 | Winter 2017 | Summer 2017/18 | Winter 2018 | Summer 2018/19 | Winter 2019 |
|---|---|---|---|---|---|---|---|---|---|
Baseline | Wheat | Fallow | Chickpea Kyabra | Fallow | Wheat Sunguard | Sorghum MR-Buster | Fallow | Fallow | Wheat Mitch |
Higher Crop Intensity | Wheat | Mungbean Jade | Wheat | Fallow | Wheat Sunguard | Sorghum MR-Buster | Fallow | Fallow | Chickpea Kyabra |
Higher Legume | Chickpea Kyabra | Fallow | Wheat | Fallow | Chickpea Seamer | Sorghum MR-Buster | Fallow | Fallow | Chickpea Kyabra |
Higher Nutrient | Wheat | Fallow | Chickpea Kyabra | Fallow | Wheat Sunguard | Sorghum MR-Buster | Fallow | Fallow | Wheat Mitch |
Higher Soil Fertility | Wheat | Fallow | Chickpea Kyabra | Fallow | Wheat Sunguard | Sorghum MR-Buster | Fallow | Fallow | Wheat Mitch |
Integrated Weed Management | Wheat | Fallow | Chickpea Kyabra | Fallow | Wheat Sunguard | Sorghum MR-Buster | Fallow | Fallow | Wheat Mitch |
Water use and infiltration
A system’s ability to convert rainfall to plant available water (PAW) is a primary driver in success or failure. Emerald’s rainfall pattern over the past five years has been ‘boom or bust’. The region is currently sitting at a 450 mm deficient under the long-term average (annual average rainfall is 600 mm), for the past five years of the trial (Figure 1).
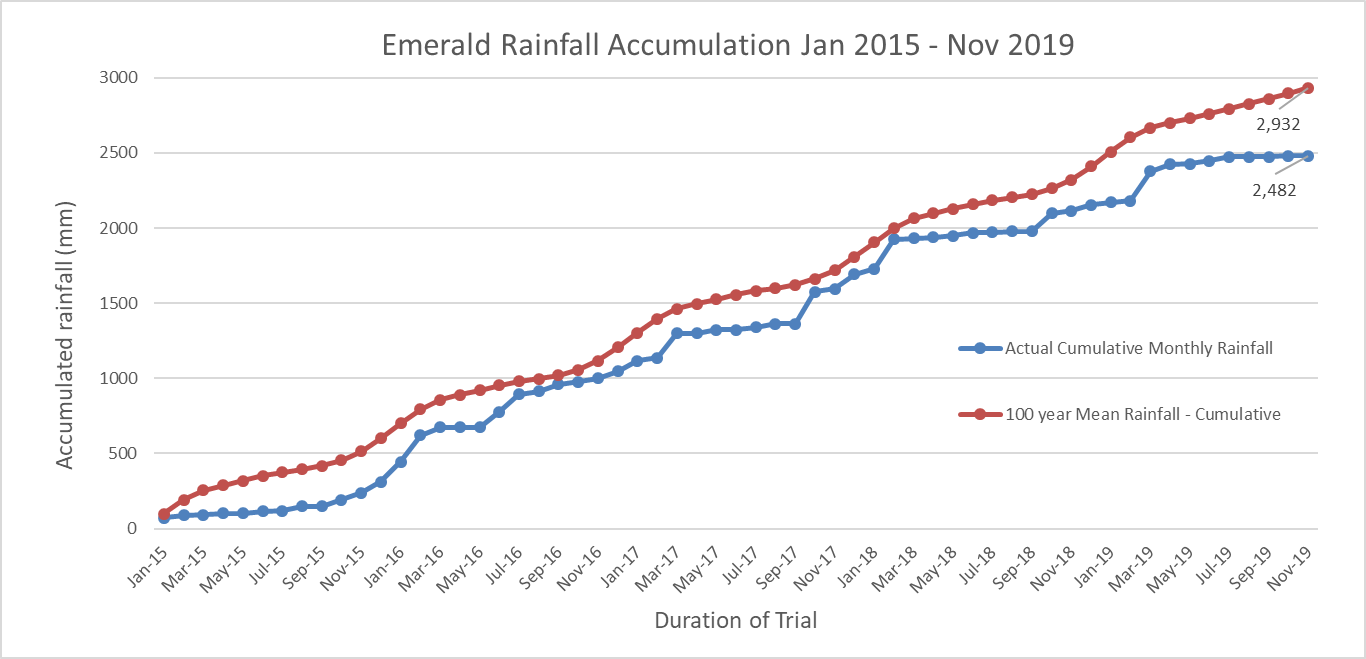
Figure 1. Cumulative rainfall (blue) compared to 100-year average (red) annual rainfall from 2015 - 2019. During the period, at no time has cumulative average rainfall exceeded the long-term average.
The CQ cropping system relies on soil water storage, particularly for winter crops. In-crop rainfall totals for winter crops; 2015 (46 mm), 2017 (61 mm) and 2019 (99 mm), (Figure 2) all under 100mm, still produced average yields over 2 t/ha in the Baseline system. To understand a system’s water use efficiency (WUE), it is necessary to look at how much starting and finishing water was available to the plant over the growing season, in addition to in-crop rainfall.
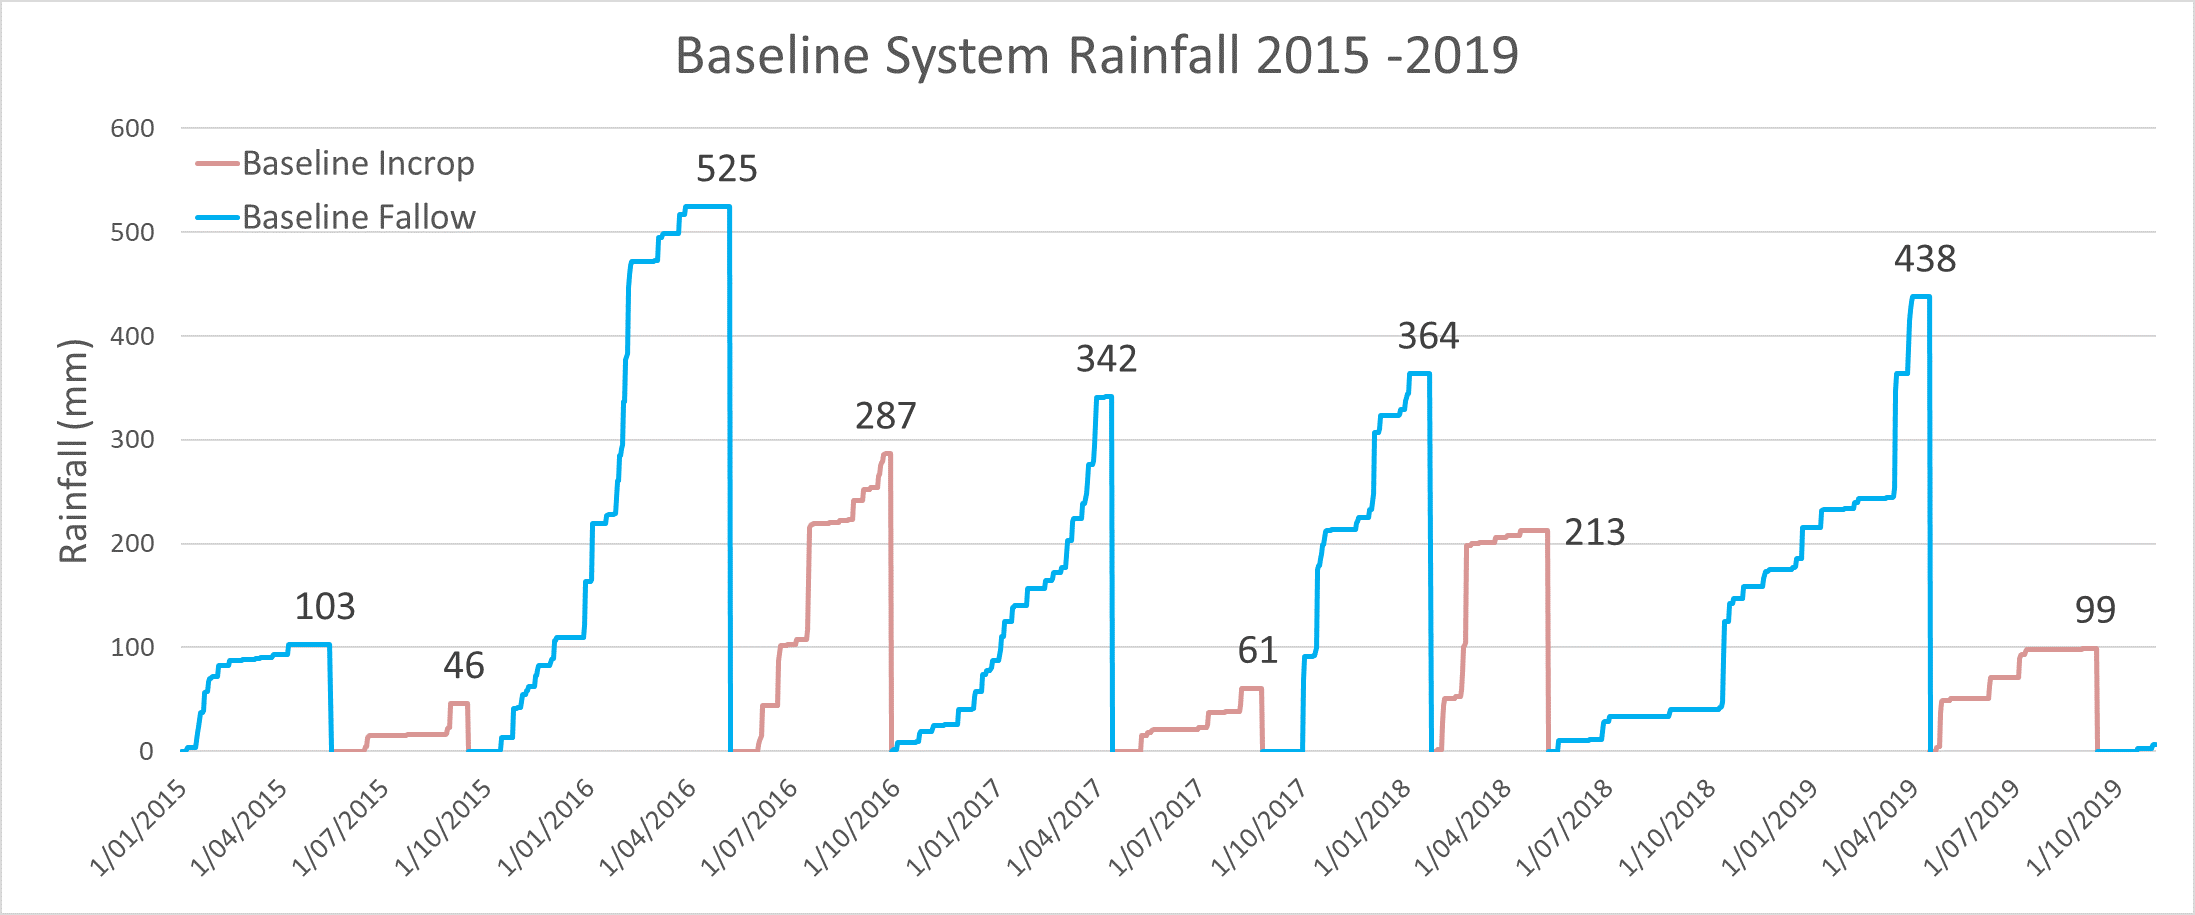
Figure 2. Cumulative rainfall received for fallow and in-crop periods the Baseline system over the past five cropping cycles.
System assessment
An effective type of assessment for systems is to calculate its Fallow Efficiency (FE). Rainfall patterns have meant that the trial has experienced large singular downpours of rain, then effectively gone months without follow-up rainfall. How effectively rainfall received is converted to PAW (Figure 3) over the fallow period is calculated as the FE percentage.
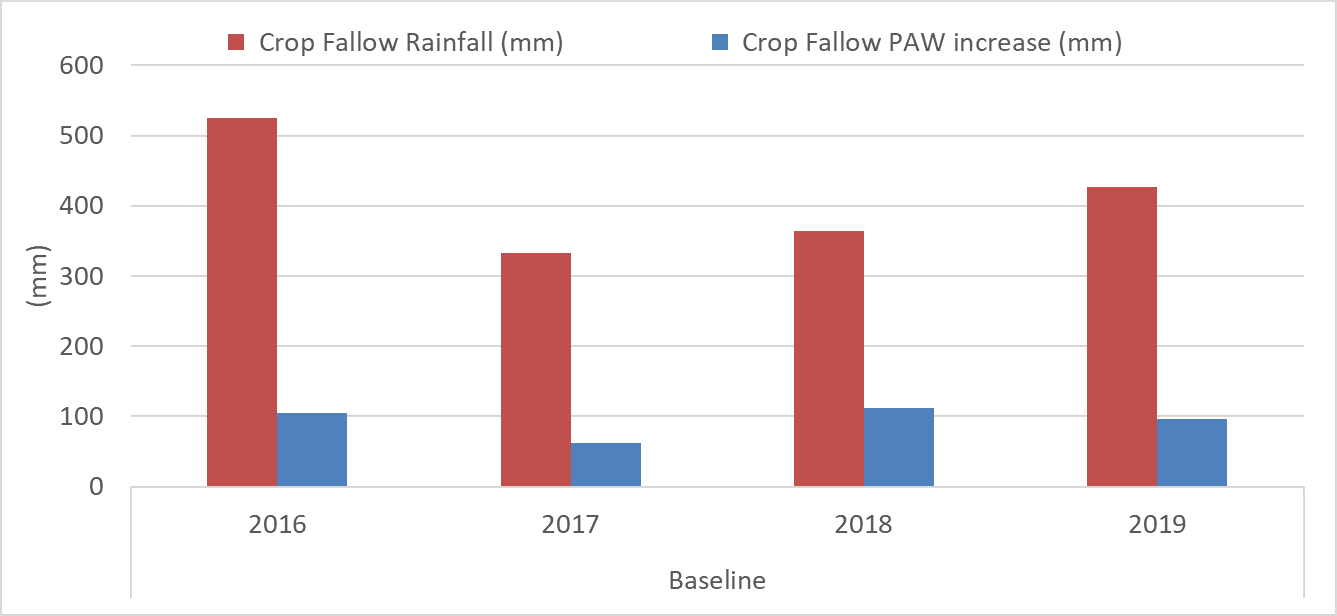
Figure 3. Fallow rainfall and PAW accumulation during the fallow periods from harvest 2015 to harvest 2019 for the Baseline System.
As an average figure for the past five years, the fallow efficiency (FE) of the Emerald site is approximately 22% (22 mm stored for every 100 mm of rain). When you break this figure down across the treatments, it varies from 25% for the Higher intensity system, to 19% for the Higher legume system. In the table below (Table 2) you can see how the fallow efficiency has varied from year to year and crop to crop.
While individual crop or year figures are of interest, a single number is not as reliable an indicator of a system’s performance as a five or more year average can be. The equation used to calculate fallow PAW accumulated subtracts the starting PAW after harvest from the pre plant PAW value collected at the end of the fallow period.
Table 2. System’s fallow efficiency (%) from period starting harvest 2015 to harvest 2019 for the Emerald northern farming systems site.
System treatments - Emerald | 2016 | 2017 | 2018 | 2019 |
|---|---|---|---|---|
Baseline | 20 | 18 | 31 | 22 |
Higher intensity | 38 | 15 | 26 | 14 |
Higher legume | 19 | 16 | 23 | 16 |
Higher nutrient supply | 21 | 15 | 34 | 18 |
Higher soil fertility | 20 | 24 | 35 | 16 |
Integrated weed management | 20 | 24 | 33 | 16 |
Yearly site average | 25 | 19 | 30 | 17 |
When compared across the other farming system sites, the numbers are similar (Table 3); however, the Emerald site sits at the higher end of the scale when it comes to proportion of total rainfall, which falls in the fallow. For the past five years, only 27% of Emerald total rainfall has fallen in-crop. This percentage is on the lower side compared to sister sites in the project (Figure 4). Length of fallow also plays a significant role in fallow efficiency; typically the shorter the fallow length, the higher the fallow efficiency.
Table 3. System Fallow Efficiency (FE) across the northern farming systems sites.
Note: This data set was compiled prior to harvest 2019 for Emerald; there are no Low intensity or High diversity treatments at the Emerald site.
System | System FE (%) (all sites average) | System FE (%) (Emerald) |
|---|---|---|
Baseline | 22 | 22 |
Higher intensity | 33 | 25 |
Higher legume | 17 | 19 |
Lower intensity | 16 | n/a |
Higher nutrient | 24 | 22 |
Higher fertility | n/a | 23 |
Higher diversity | 21 | n/a |
Integrated weed management | n/a | 23 |
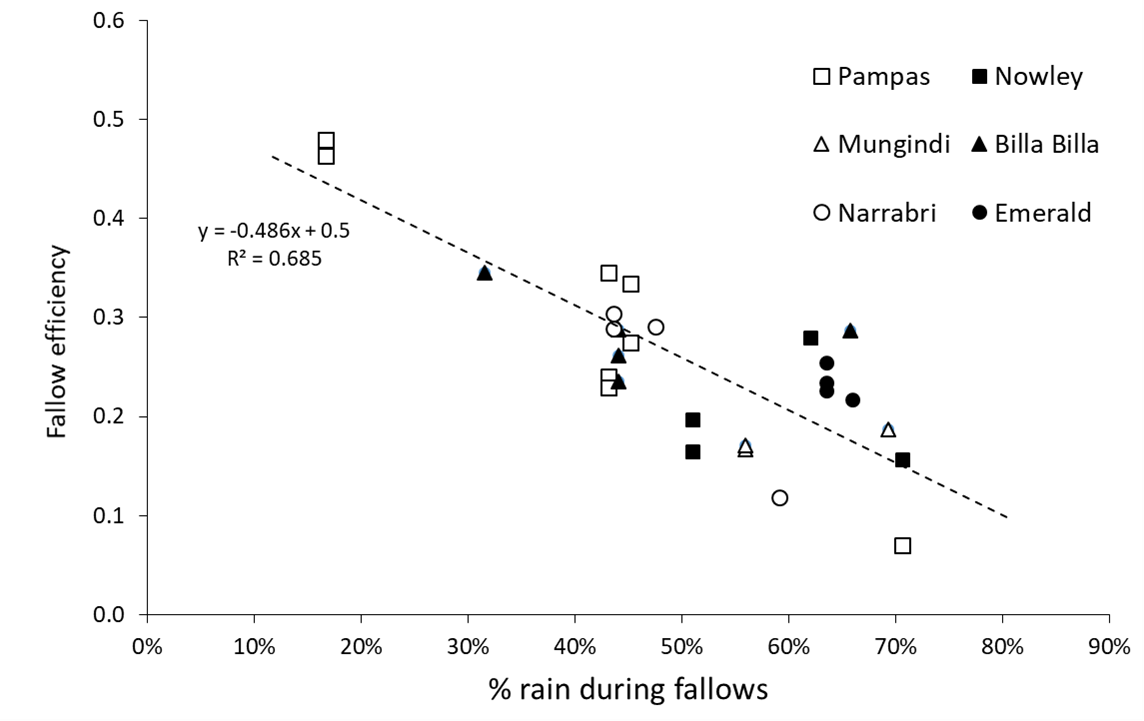 Figure 4. Fallow Efficiency for six of the NFS trial sites, when compared to when the rainfall has occurred. This cross-site data set was compiled prior to harvest 2019 for the Emerald site.
It is important to understand what is driving FE and how to optimise fallow water capture, but ultimately the soil characteristics determines the maximum amount of PAW (PAW capacity) available to a crop. Factors like soil depth, amount of clay, structure and any pre-existing soil constraints all impact a soil’s PAWC i.e. how much of the water we capture, we can actually use. Interestingly, when you look at total rainfall over the five years, and the proportion of rainfall the crops used, the ratio improves significantly.
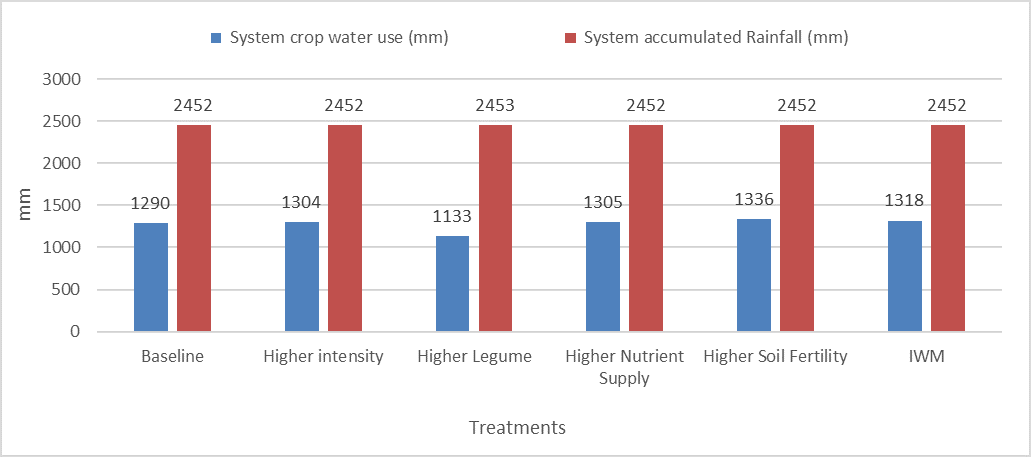
Figure 5. System water used compared to system accumulated rainfall 2015 - 2019.
While FE for the systems sits at around 22%, the ratio of water used in-crop to total rainfall (in-crop and fallow) is around 50% (Figure 5). All the systems have seen the same amount of rainfall over the duration for the trial; however, the higher legume treatment has been the poorest converter of rainfall into grain (45% of the total rainfall). The difference has less to do with ground cover or crop structure, rather than actual time the crops were in the ground relative to the other treatments.
Because of the rotation applied to the higher legume system, it has twice been planted up to a month later than other treatments in the past five years. The difference in planting date has meant a higher proportion of that systems’ rainfall has occurred in a late fallow situation; (44mm more in 2016 and 51mm in 2019) rather than in crop, which is a much poorer converter of rainfall to plant available water, than occurs in a growing crop.
Water Use Efficiency(WUE) (kg/mm) and ultimately ($/mm) provide an insight into how efficiently the system converts available water into grain and income. The calculations for both are based on the production or profitability of the systems. For WUE (kg/mm) the calculation is all grain (or plant material) produced / the sum of the water used by the crops grown. The calculation for the water used figure is (PAW at planting – PAW at harvest) + any rainfall (or irrigation) which was applied between planting and harvest.
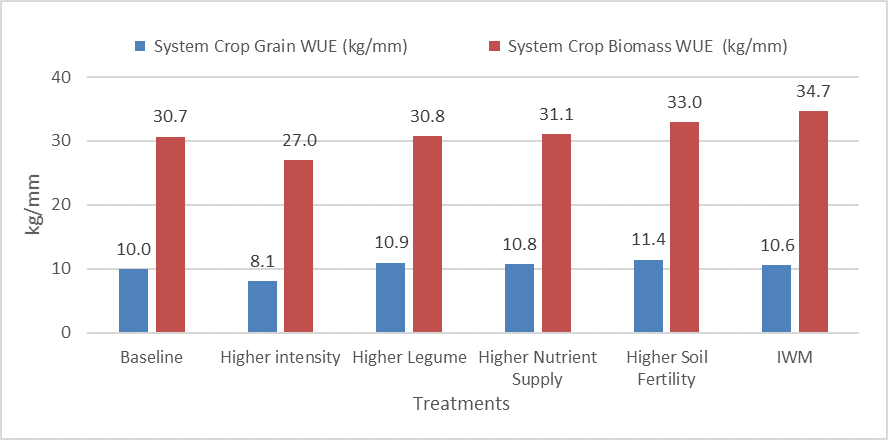
Figure 6. Water use efficiency of both grain and biomass production over the past five years at the Emerald site.
To date, the IWM system (Figure 6) has been the most efficient at converting water into biomass (plant material), with 34.7 kg of biomass produced for every mm of water used. This system produced 4 kg/ha more biomass than the Baseline system. Grain WUE however sees the Higher fertility system ahead of all other systems, with a 1.4 kg/mm improvement over the Baseline. Higher legume and Higher nutrient supply follow with a 0.9 kg/mm and a 0.8 kg/mm respectively improvement over Baseline.
While those values do not seem large, when put into the context of five years of below average rainfall, the difference in yield per hectare between the Baseline and the Higher fertility system is 2.3 t/ha (Table 4).
Table 4. Effect differences of WUE can have on system production levels. Comparison between Baseline and Higher fertility systems, under observed rainfall conditions.
Treatment | System rainfall (mm) | Crop water used (mm) | System conversion % | Grain WUE (kg/mm) | Grain produced (kg/ha) | Benefit (kg/ha) |
|---|---|---|---|---|---|---|
Baseline | 2452 | 1290 | 53 | 10.00 | 12897 | |
Higher fertility | 2452 | 1336 | 54 | 11.43 | 15273 | 2376 |
Gross margin (GM) and $ return/mm water
Utilising WUE $/mm can be calculated. Unsurprisingly the fallow costs nor the variable costs change a great deal between the six systems (Figure 7). For Emerald, the Higher intensity system has grown one extra crop yet has the lowest variable costs of all the systems.
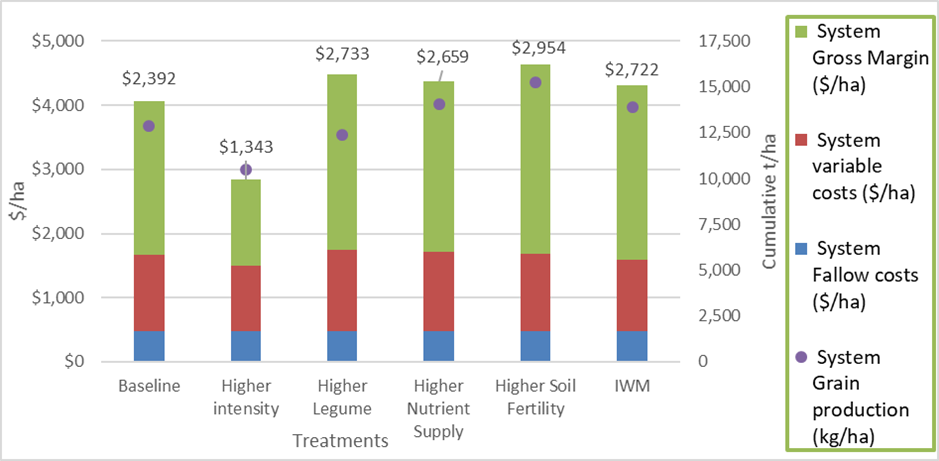
Figure 7. Gross margin breakdown for all six systems at the Emerald site. Graph shows fallow costs (blue bars), variable costs (red bars), system gross margin (green bars and data labels) and system grain production (purple dots) over the past five years.
The Higher fertility system currently has the highest cumulative gross margin at $2945/ha, $221/ha better than Higher legume or $232 ahead of the Integrated weed management system. All systems to date have remained profitable, despite the poor run of seasons (Figure 8); however, the Higher intensity system has struggled ever since the wheat – mungbean – wheat double crops of 2015/16. Frost took a toll on the 2019 chickpea crops of both the higher legume and particularly the higher intensity systems, leaving a gross margin of only $69/ha.
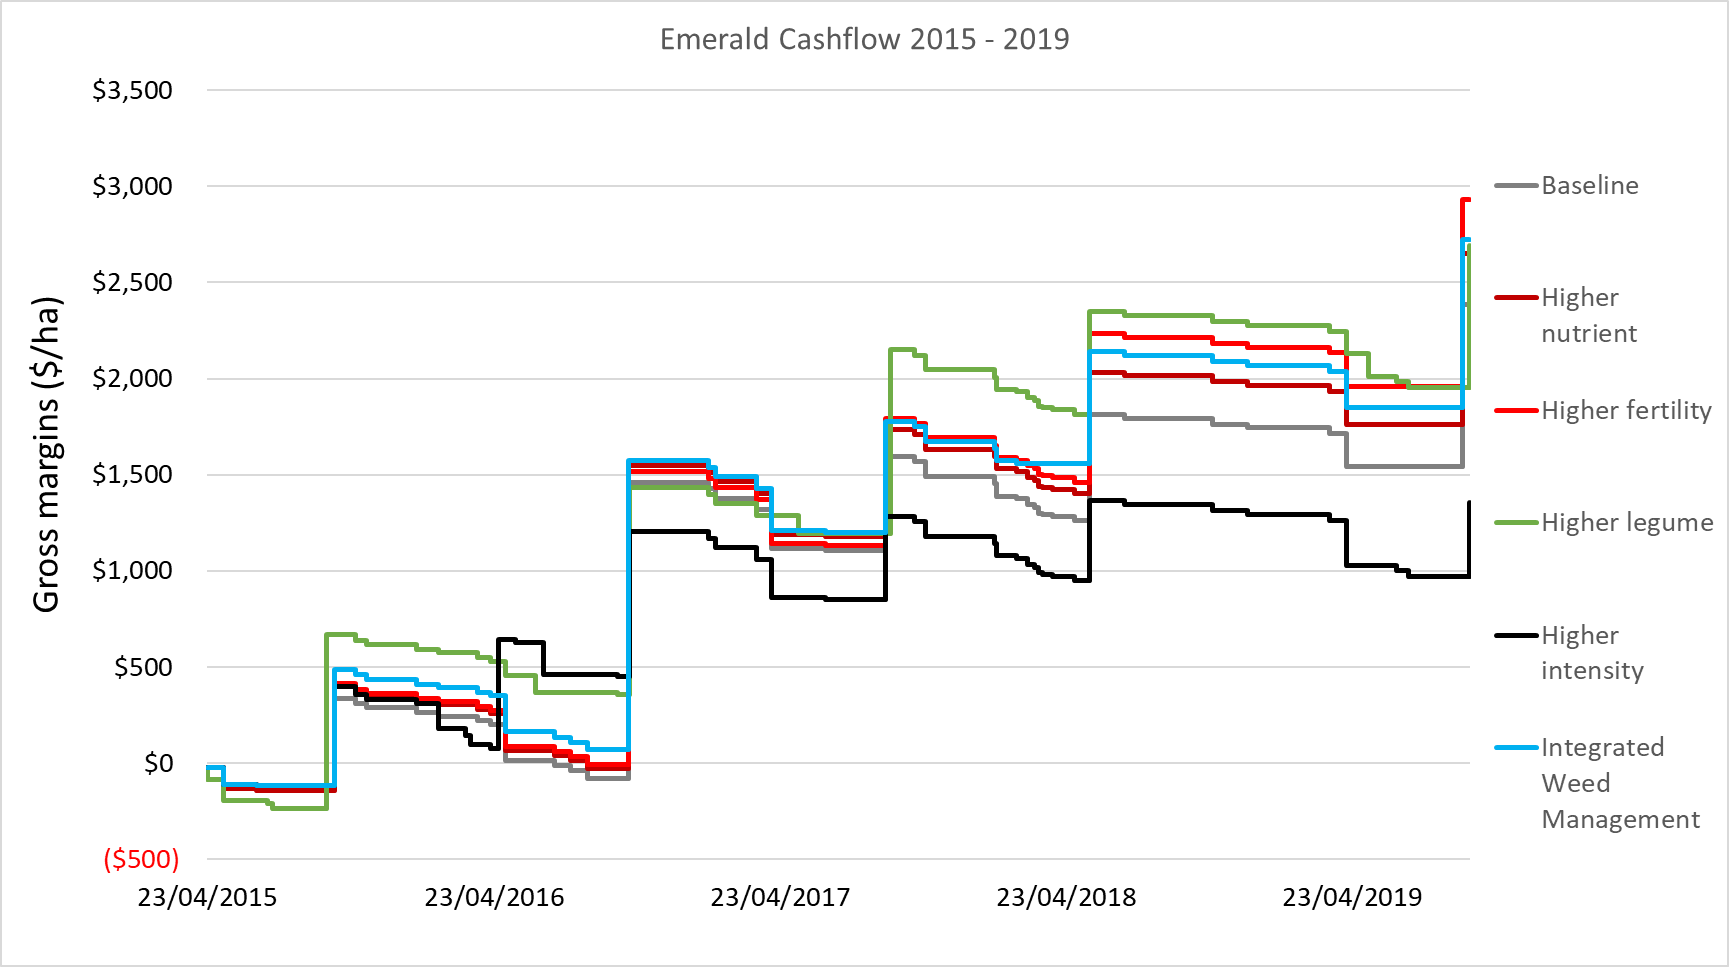
Figure 8. Emerald cash flow for the six systems from 2015 through to harvest 2019.
However, if the higher intensity crop had been cut for hay (instead of being taken through to grain) we would have dramatically changed this outcome. Utilising the biomass cuts taken, post the frost in July in the Higher intensity system, we have calculated the following:
- Avg. biomass @ “frost event” 5420 kg/ha
- Less 25% loss from baling process
- 75% x 5420 = 4065 kg/ha
- Chickpea hay value on-farm – approx. $450/tonne
- Gross value of hay - $1830/ha
- Taken through to grain…
- Grain yield – 0.65 t/ha
- Grain value/tonne - $500 (long term average value used)
- Gross value of grain - $325/ha
System water use efficiency
System WUE has been calculated comparing the total gross margin for each system over the last five years / system water used (starting PAW in 2015 less harvest PAW for the last crop) + any rainfall or irrigation between those two points in time). Baseline system WUE (Figure 9) for the trial to date at Emerald is currently sitting at $0.93/mm. The Higher fertility system has produced the highest $/mm at $1.14 cents per mm and the lowest is Higher intensity ($0.52). Lack of yield, particularly with the frosted chickpea crop this year and the poorer yields in 2016 and 2017 relative to other systems has severally impacted the Higher intensity system.
For a number of years, the Higher legume system has led the way , but as the systems began to separate over time, the enhanced fertility provided by the manure in the Higher fertility system sees it now clearly in front. Higher Nutrient and IWM treatments are still performing better than the Baseline system, and to date show a financial advantage in maintaining a higher nutrition status and keeping plant populations at higher levels, relative to the baseline system.
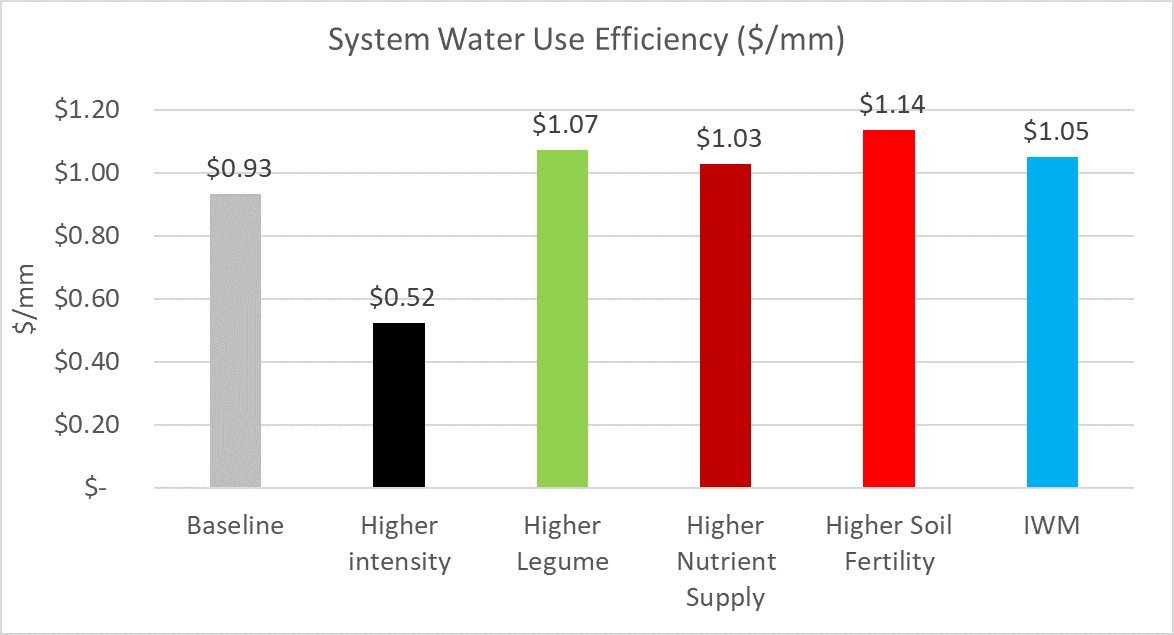
Figure 9. System water use efficiency of all six systems.
Final observations
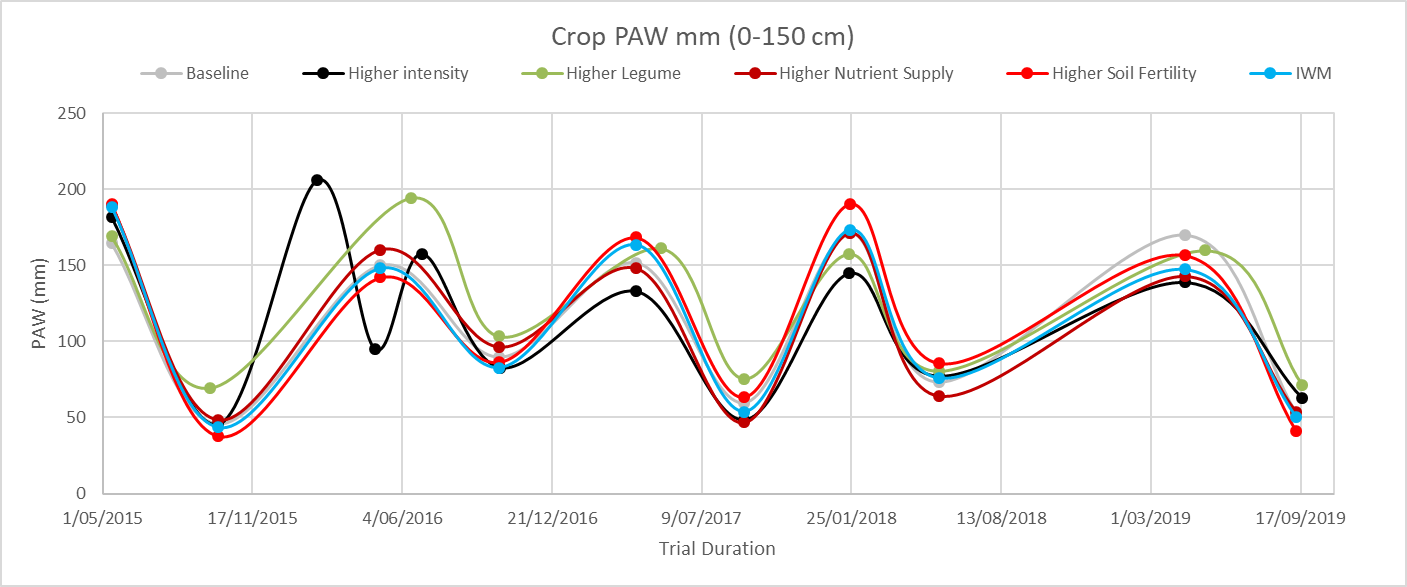 Figure 10. System plant available water (PAW) fluctuations for all six systems over the past five (six) cropping cycles.
The crops use of plant available water plays a significant part in farming system profit, with most of the data reviewed indicating that if the system crops have access to more water (and can use it) during the growing season, typically it will lead to higher yields and improved profitability relative to other systems.
When PAW of all systems is represented in a line graph (Figure 10) the variation between their ability to capture water and then use water during the season becomes evident. When you compare Higher intensity with Higher fertility, particularly over the past two to three years as treatments begin to diverge, the difference in starting and finishing PAW is quite pronounced, with as much as a 40 mm difference at sowing.
However, not all may be as it seems. We look at the systems and as indicated in (Figure 6), the IWM system should have had a lot more ground cover than the other systems based on biomass produced, yet it is firmly placed in the middle to lower end of the pack when it comes to PAW.
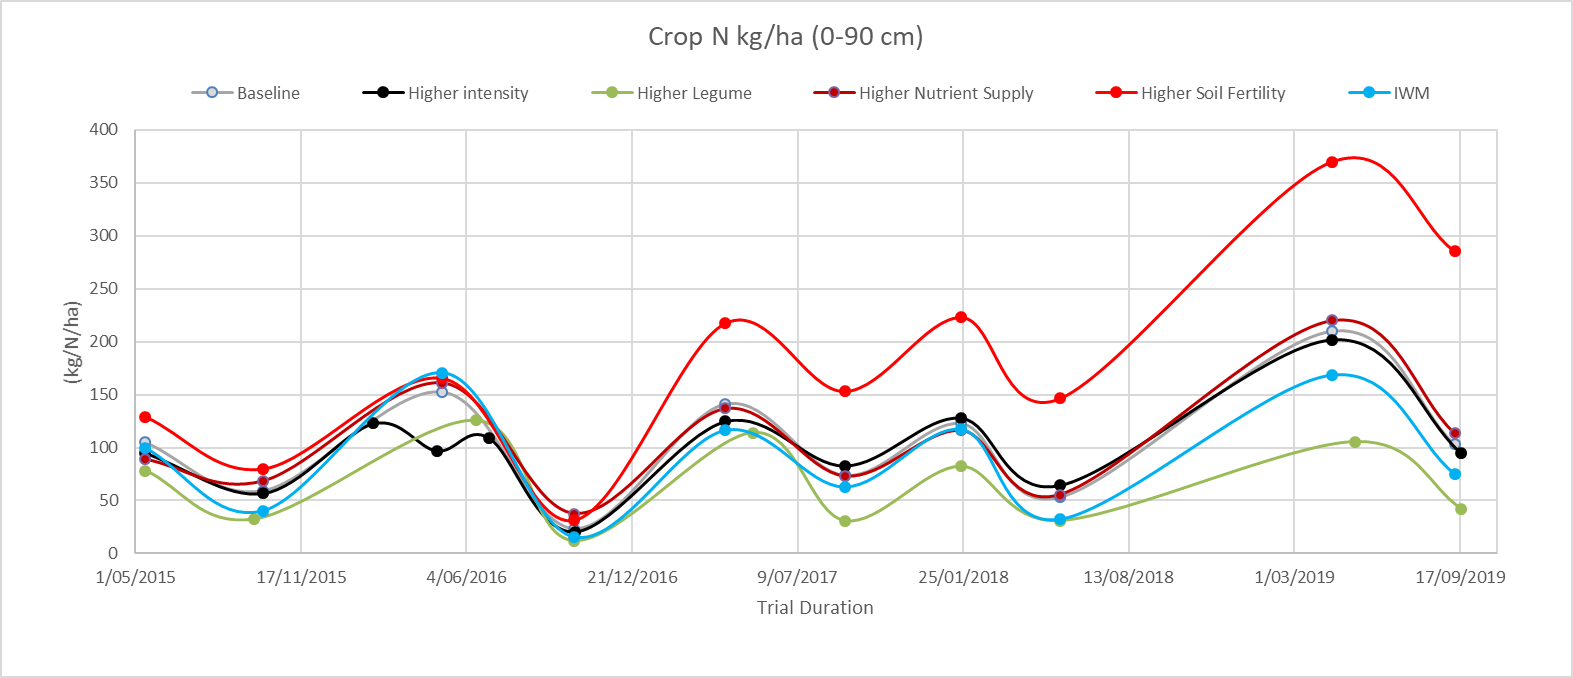
Figure 11. System crop N (0 - 90cm) fluctuations for all six systems over the past five (six) cropping cycles.
The system’s soil nutrient status is the missing part of this discussion, which will not be covered in this paper except for the final graph (Figure 11). It shows crop available nitrogen at planting and harvest over the duration of the farming systems trial at Emerald. Higher fertility had 45 t/ha of feedlot manure (dry weight) applied, split across two applications (early 2015 and a second at the end of 2016). The Higher legume system has had no bagged N applied since the start of the trial, and IWM has produced the highest amount of biomass since the start of the trial. The systems are dramatically separating with the Higher soil fertility system holding larger amounts of available nitrogen in comparison to the other systems.
Acknowledgements
The research undertaken as part of this project is made possible by the significant contributions of growers through both trial cooperation and the support of the GRDC, the author would like to thank them for their continued support.
I would like to acknowledge CSIRO as the lead of the Pampas core farming system site and the New South Wales Department of Primary Industries and their staff who manage the four NNSW sites. The Queensland Department of Agriculture and Fisheries Regional Research Agronomy teams based in Goondiwindi and Toowoomba have led the regional site component of the project to date under the leadership of Dr. David Lawrence and now Jayne Gentry.
Finally, I would like to particularly acknowledge Ellie McCosker and more recently Jane Auer, both part of the local Emerald Regional Research Agronomy team who have managed the day to day observations of the Emerald site for the past three years.
Contact details
Darren Aisthorpe
Queensland Department of Agriculture and Fisheries
99 Hospital Road, Emerald, QLD
Mb: 0427 015 600
Email: Darren.Aisthorpe@daf.qld.gov.au
Varieties displaying this symbol beside them are protected under the Plant Breeders Rights Act 1994.
GRDC Project Code: DAQ1406-003RTX,
Was this page helpful?
YOUR FEEDBACK
