How has central Queensland climate changed and what impact has it had on sorghum productivity (Capella)
Author: Jeremy Whish (CSIRO) and Elizabeth Meier (CSIRO) | Date: 27 Nov 2019
Take home message
- Increasing temperatures and reduced rainfall have lowered the yield potential of sorghum in many areas
- Avoiding high temperatures at flowering and using a conservative sowing trigger (>100mm) can reduce the impact of a changing climate
- There is still room to reduce the yield gap with targeted sowing dates, nitrogen rates and soil water triggers despite a changing climate reducing sorghum yield potential
Introduction
Australia’s climate is warming, including an increase in average temperature, increase in number of days exceeding 35°C and a decrease in rainfall (CSIRO and BOM, 2015).
But what is happening at Capella? How will this affect the crops I grow? What can I do to manage this change?
These are some of the questions we have tried to address in this study.
Over the last few years, several suggestions have been made to GRDC that have warranted our examination of sorghum production in response to changing climates. The key concern was that a changing climate had reduced the yield potential of central Queensland crops and would cause the key sorghum production areas to move south to cooler and less variable climates. In this paper we review local annual and growing season climates, sorghum production and compare these results to other sorghum production areas to see how or if things have changed.
Methods
Current climate was compared with historical climate using a ‘climate normal’ approach to compare overlapping 30-year time periods. This is recognised as the most statistically sound method to determine if a change in climate has occurred (Arguez and Vose, 2011) and is recommended by the World Meteorological Organisation’s standard for placing current climate conditions in a historical perspective. A simulation analysis of sorghum production in response to a range of initial soil water and sowing dates was then conducted using APSIM to identify whether changing these management practices could mitigate the effect of any changes in climate.
How is the Capella environment changing?
Rainfall
 Figure 1. Sum of rainfall for each 30-year climate normal period on an annual (A) and cropping season (B) basis at Capella. The results show how rainfall has changed over time. In general rainfall has had minimal change over the study period. However, greater variability is observed in the most recent 30-year period (1988-2017) with this variability predominantly in the summer.
Temperature
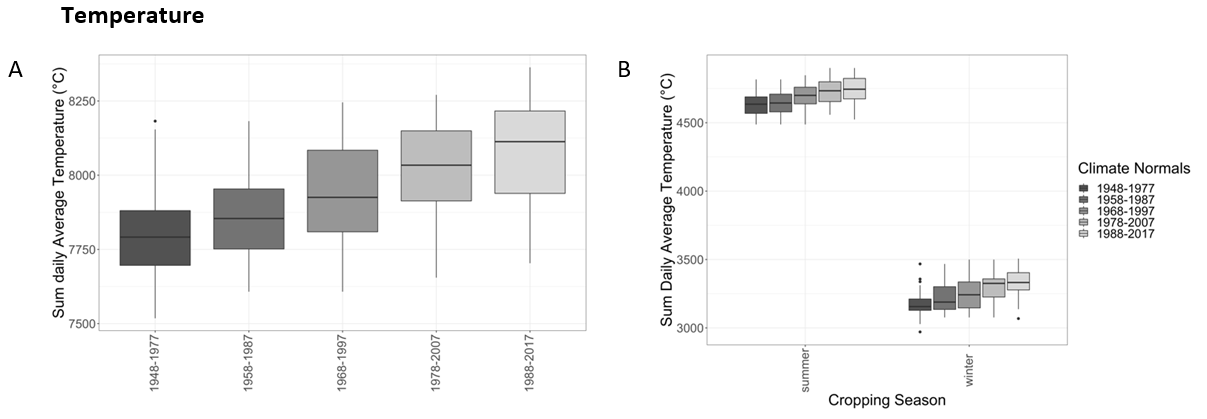 Figure 2. Sum of daily average temperature on an annual (A) and cropping season basis at Capella. Average temperature showed a continual increase in heat to the 1978-2007 normal and then levelling for the most recent climate normal (1988-2017). The change in accumulation of heat was similar in both summer and winter growing seasons.
Extreme temperatures

How will these changes in climate affect sorghum?
Higher temperatures increase the rate of crop development and the amount of water transpired by the crop. If rainfall remains stable or decreases, then this will increase the chance of moisture stress occurring in the crop. However, if the growing period of the crop can be matched to the timing of rainfall then it may be possible to maintain or increase crop grain yield despite an annual reduction in rainfall.
To identify whether the yield potential of sorghum crops had changed over the last 60 years a series of simulations was undertaken. The 60-year period from 1958-2017 was used for this analysis and sub-divided into two climate normals – 1958-1987 and 1988-2017 - that could be compared.
Water stored within the soil helps to buffer crops from variability in the climate. In order to understand the effect on yield of changes in the climate, the median yield from a crop sown into a full profile of water was compared across the 60-year period. This approach was expected to demonstrate the least difference between the two climate normal periods for effect of change in climate on crop yield because each site and sowing date combination had optimal soil water at sowing. The study was completed for a selection of locations (‘transects’) in both the eastern and western parts of the GRDC northern growing region (Figure 4).
Sorghum crop yields sown on a full profile of soil water
For northern sites of the western transect (from Mungindi north) there was little change in yield except for a reduction in yield of around 0.5 t/ha at the extremes of early sowing and late sowing (Figure 4). For the northern sites of the eastern transect there was a clear reduction in yield for sites north of Goondiwindi, especially for sowing dates before November. For the eastern transect there were distinct groupings of change in yield: improved yield between Goondiwindi and Moree for crops sown between November and January and decline in yield on the Liverpool Plains that worsened with later sowings and culminated around a mid-December plant.
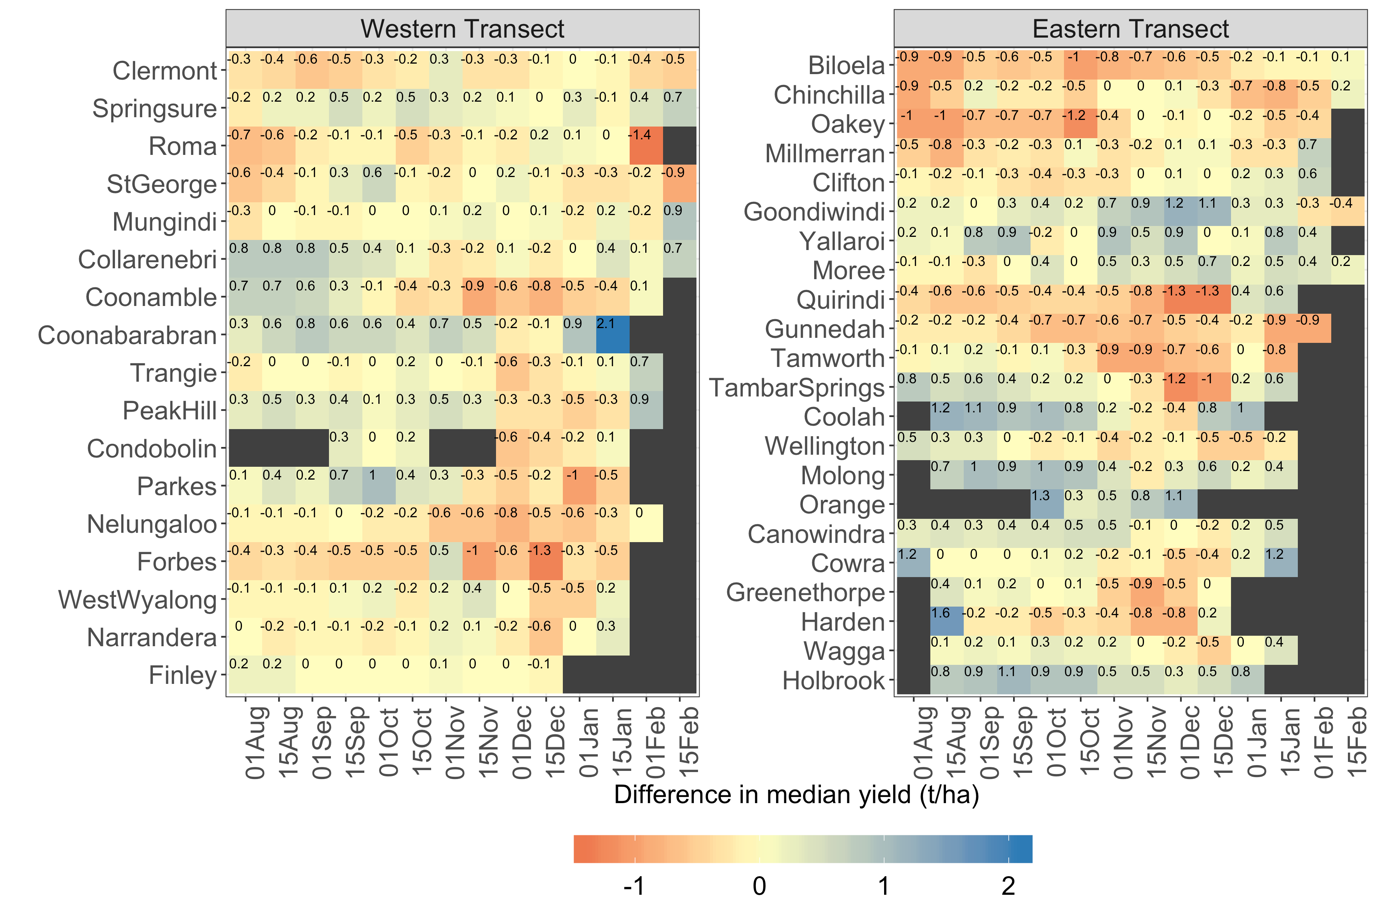 Figure 4. Difference in median yield of sorghum crops between climate normals 1958-1987 and 1988-2017 when sown into a full profile of water, for different sowing dates for locations divided into western and eastern transects. Red shading in cells indicates a decrease in yield, blue indicates an increase, and yellow indicates sowing dates where there was minimal to no difference in crop yield. Only median yields from sowing dates that had fewer than 50% failed crops are included (other location-sowing date combinations were considered unsuitable for crop production and are coloured black). Values within each cell are the difference in yield between the climate normals (t/ha).
What has been the effect of changing climate on yield when there isn’t a full profile of soil water at sowing?
The objective of simulating sorghum crop yields in response to a full profile of water in the previous step above was to understand whether the most recent 30-year climate normal period was different to the previous 30-year normal in terms of its effect on crop yield. However, it is inefficient to wait for a soil profile to fill because producing adequate crops regularly can be financially better than waiting for conditions (such as a full soil water profile) that will produce potential crop yields. In this section we present results for crops sown into a profile with an initial amount of 100 mm of available soil water. This amount is towards the lower end of soil water that would be present when a decision to sow occurs (the general sowing rule for western sites is more commonly to have 150 mm of plant available water). In the eastern sites with higher rainfall as little as 50mm is used, but 100 is more common. The use of 100mm for both transects is a compromise and if sowing below this value, then agronomic factors other than initial soil water, such as row configuration (Whish et al., 2005) would be used to reduce risk (such practices are not included in this study).
There was an increase in crop failure (cells shaded black) between crops sown on a full profile of soil water (Figure 4) and those sown into a profile containing 100mm (Figure 5). This difference in initial soil water also explains the use of wide row configuration and 150 mm soil water trigger that is used by many grain growers along the western transect. However, despite these differences in yield arising from differences in initial soil water, the general patterns of changes in yield and optimal sowing dates between climate normals were the same. There were minimal differences in yield between climate normals for the north-western sites, but a decrease in yield potential for the eastern sites. The November to mid-January sowing dates between Goondiwindi and Moree continued to demonstrate an increase in yield for the more recent normal, while later sowing in the Liverpool Plains continued to demonstrate a yield reduction.
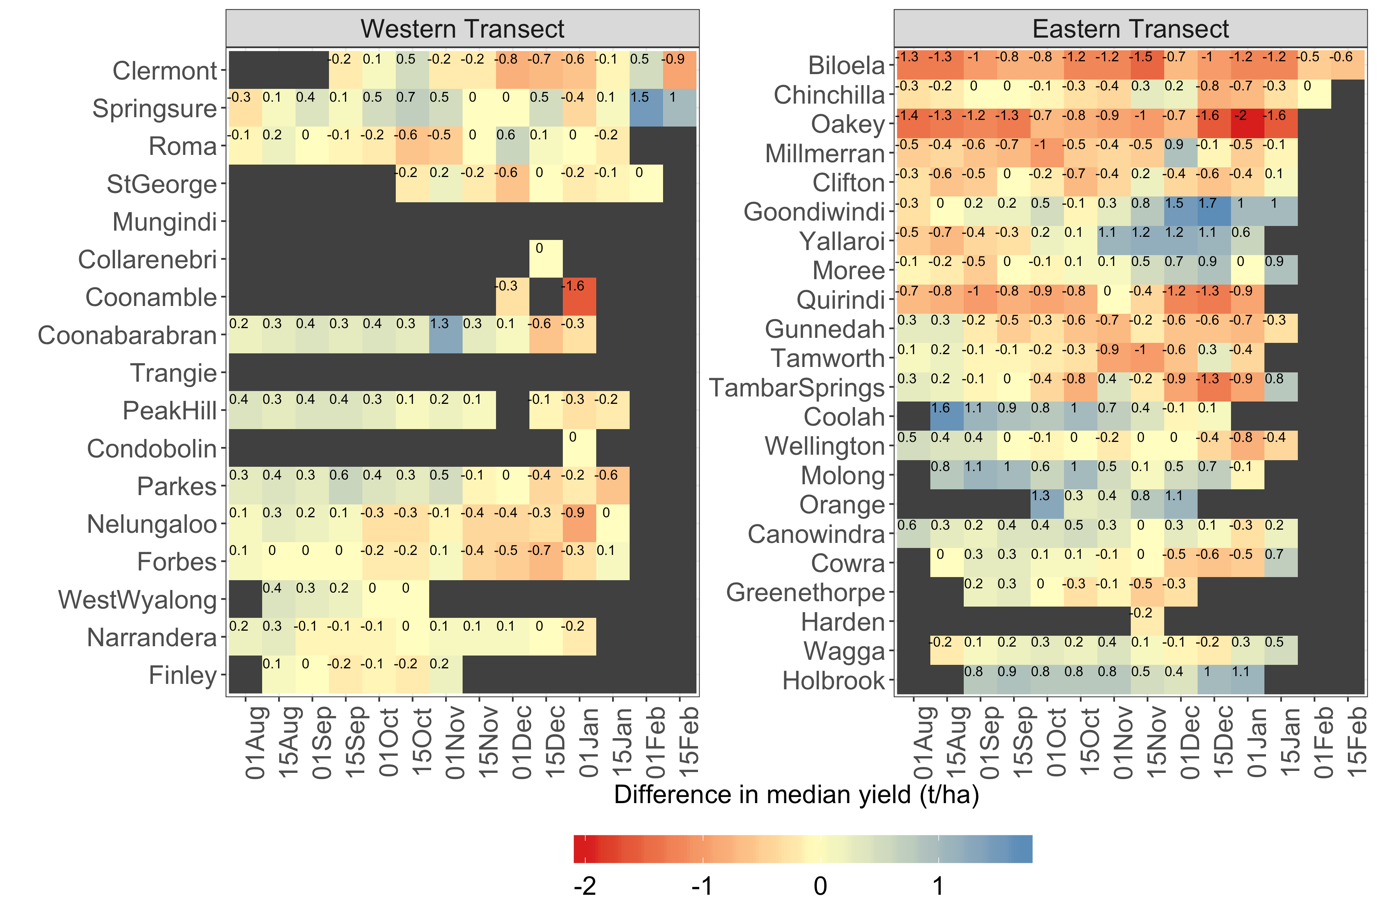 Figure 5. Difference in median yield of sorghum crops between climate normals 1958-1987 and 1988-2017 when sown into a profile of 100 mm of water, for different sowing dates for locations divided into western and eastern transects. Red shading indicates a decrease in yield, blue shading indicates an increase in yield, and yellow shading indicates sowing dates for each location with minimal to no difference in yield. Only median yields from sowing dates that had fewer than 50% failed crops are included (other location-sowing date combinations were considered unsuitable for crop production and are coloured black). The values within each cell specifies the magnitude of the difference in yield between the climate normal periods (t/ha).
Why are yields changing?
Rainfall
The availability of water to the crop is the key determinant of yield in Australia. The value of stored soil water is its ability to buffer the demands of the plant in between rainfall events and ensure optimal plant growth. The timing and size of rainfall events are critical to maintaining this buffer as is the specific soil type. In general, the quantity of in-crop rainfall decreased or remained neutral across locations in both eastern and western transects, although there was an increase in in-crop rainfall at a few locations (e.g. Coonabarabran, Goondiwindi and Yallaroi for some times of sowing). These locations are those that showed an increase in water limited yield potential (Figures 4 and 7), and highlight that this increase in rainfall pattern has directly resulted in increased yield.
For Capella lying between Clermont and Springsure the yield difference between the two time periods was neutral to slightly positive as you move south.
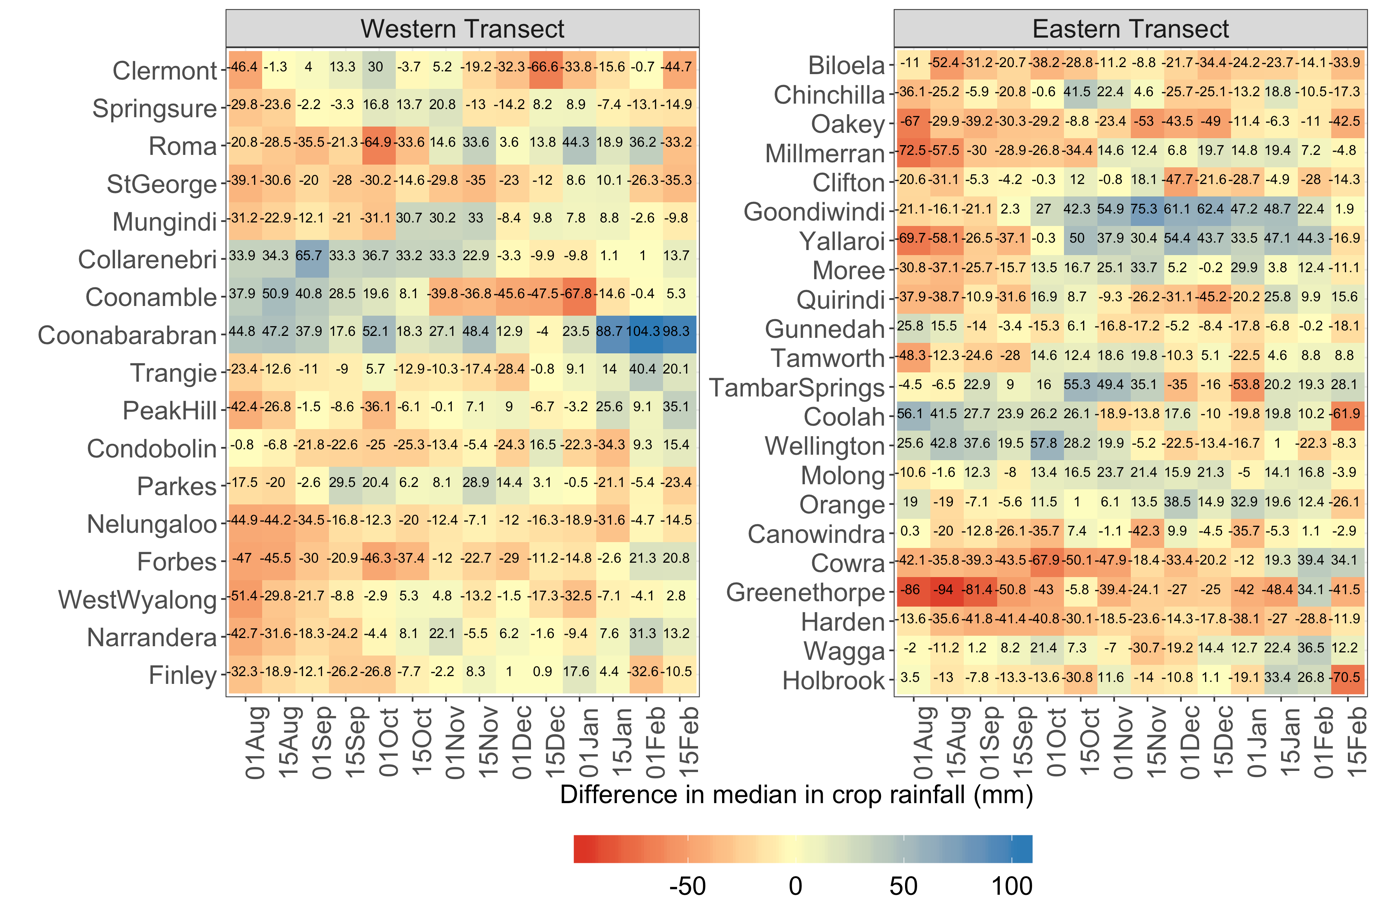
Figure 6. Difference in median in-crop rainfall for the 14 different sowing dates between the two climate periods 1958-1987 and 1988-2017, for locations in western and eastern transects. Red shading indicates a decrease in in-crop rainfall, blue shading indicates an increase in rainfall, and yellow indicates sowing dates with minimal to no difference in rainfall between normals. The values within each cell are the difference in median in in-crop rainfall (mm).
Extreme temperatures
High temperatures around flowering can significantly reduce sorghum grain yield (Lobell et al., 2015; Singh et al., 2017; 2016). The difference in the number of days with temperatures in excess of 35°C increased between the past 30-year climate normal period (1958-1987) and the more recent 30-year normal (1988-2017). The increase in days with extreme temperatures was greater for the western transect, especially for crops sown between October and November. For the eastern transect there was a general increase in the number of days with extreme temperatures for all sowing dates before December. However, a few specific sites experienced a reduction in extreme temperatures; these sites and sowing dates correspond with those that experienced an increase in rainfall and consequently an increase in median yield potential (Figure 7).
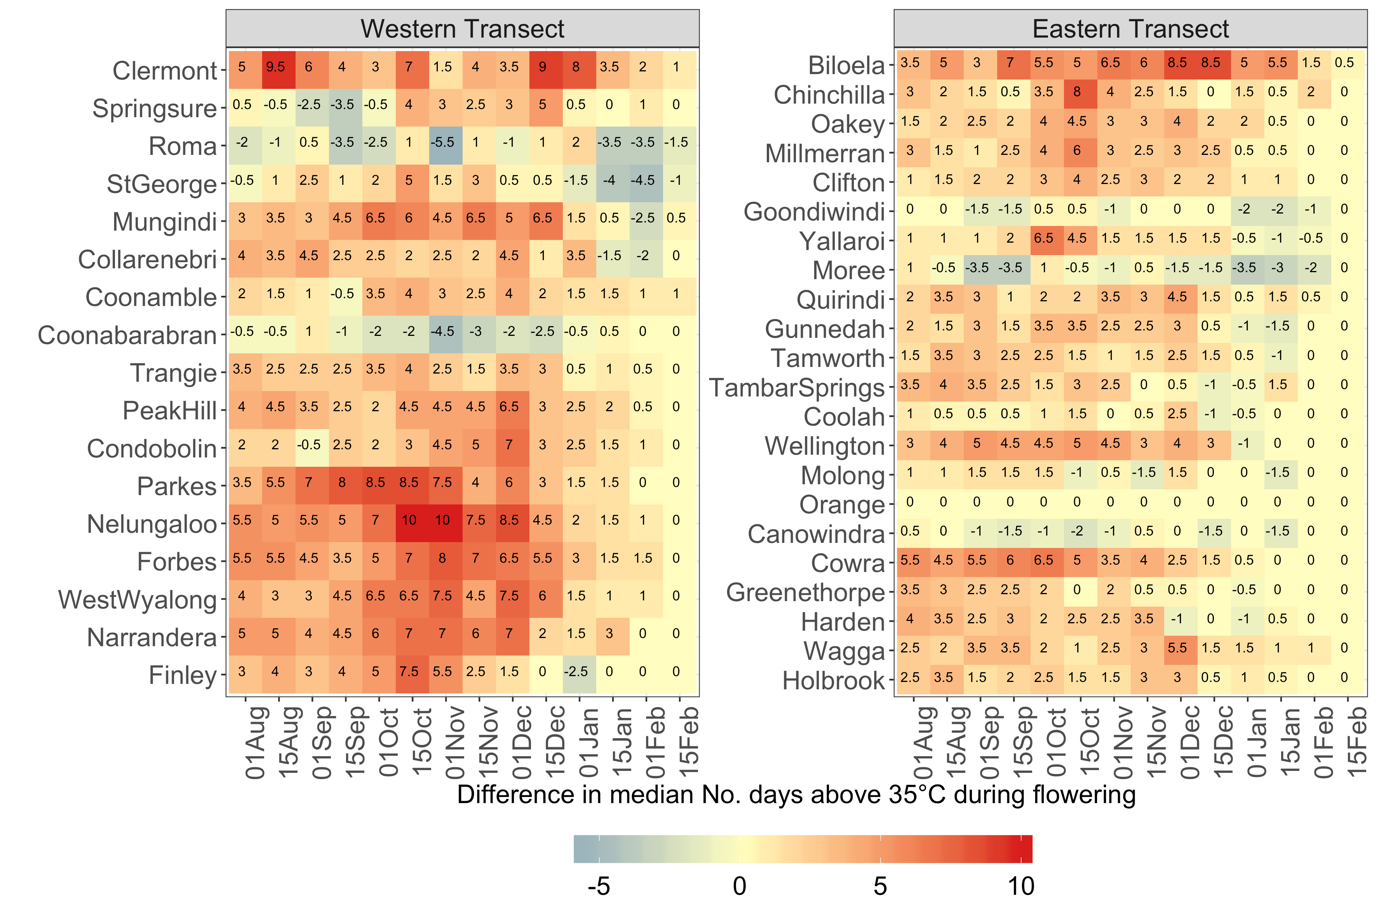 Figure 7. Difference in the median number of days above 35°C during flowering for the 14 different sowing dates between the two time periods of 1958-1987 and 1988-2017, for western and eastern transects within the northern grain zone of eastern Australia. Red indicates an increase in rainfall while blue indicates a decrease, yellow highlights those sowing dates with minimal to no difference. The values within each cell are the difference in median number of days above 35°C during flowering.
So, what does it mean and what can I do?
The climate of Australia’s sorghum production area has changed, with increases in the average daily temperature, an increase in the number of days with extreme temperatures during flowering, and a decrease in in-crop rainfall for many locations. These changes have resulted in an overall reduction in crop yield potential. However, despite this decrease the yield potential has not been reduced to a point where it is no longer economical to grow sorghum. Good agronomy and the use of high soil water triggers at sowing will help maintain profitable returns under changing climates. For sites that had an increase in yield for some sowing dates, this could be traced to increased rainfall and a decrease in extreme temperatures during flowering. However, these increases were relative only to the areas historic production and not an increase above traditionally high yield regions. Thus, despite a decrease in the yield potential over the study period for many areas, this decrease was too small to cause a noticeable shift in sorghum production areas, and so NSW is not the new central Queensland for sorghum production.
References
Arguez, A., Vose, R.S., 2011. The Definition of the Standard WMO Climate Normal: The Key to Deriving Alternative Climate Normals. Bull. Amer. Meteor. Soc. 92, 699–704. doi:10.1175/2010BAMS2955.1
CSIRO and Bureau of Meteorology 2015, Climate Change in Australia Information for Australia’s Natural Resource Management Regions: Technical Report, CSIRO and Bureau of Meteorology, Australia.
Lobell, D.B., Hammer, G.L., Chenu, K., Zheng, B., McLean, G., Chapman, S., 2015. The shifting influence of drought and heat stress for crops in northeast Australia. Glob Change Biol 21, 4115–4127. doi:10.1111/gcb.13022
Singh, V., Nguyen, C.T., McLean, G., Chapman, S., Zheng, B., van Oosterom, E.J., Hammer, G.L., 2017. Quantifying high temperature risks and their potential effects on sorghum production in Australia. Field Crops Research 211, 77–88. doi:10.1016/j.fcr.2017.06.012
Singh, V., Nguyen, C.T., Yang, Z., Chapman, S., van Oosterom, E.J., Hammer, G.L., 2016. Genotypic differences in effects of short episodes of high-temperature stress during reproductive development in sorghum. Crop Sci 56, 1561–1572. doi:10.2135/cropsci2015.09.0545
Whish, J.P.M., Butler, G., Castor, M., Cawthray, S., Broad, I., Carberry, P.S., Hammer, G.L., McLean, G., Routley, R., Yeates, S.J., 2005. Modelling the effects of row configuration on sorghum yield reliability in north-eastern Australia. Aust. J. Agric. Res. 56, 11–23. doi:10.1071/AR04128
Acknowledgements
This work was completed as part of the GRDC summer cropping project (CSP1806), a collaboration between CSIRO and GRDC.
Contact details
Jeremy Whish
CSIRO Agriculture and Food
306 Carmody Rd St Lucia Qld 4067
Ph: 07 4571 3215
Email: Jeremy.Whish@csiro.au
GRDC Project Code: CSP1806-01,
Was this page helpful?
YOUR FEEDBACK
