The interactions of nitrogen management on responses to phosphorus and potassium
Author: Doug Sands (DAF Qld), Prof. Mike Bell (University of Qld), Dr David Lester (DAF Qld) | Date: 27 Nov 2019
Take home messages
- Yield response to nitrogen can be compromised if deficiencies in phosphorus or potassium exist in the top 30cm of the soil profile
- Yield response to deep placement of phosphorus and potassium can also be compromised if nitrogen supply is restricted
- A comprehensive nutrition programme must consider the relative soil levels of nitrogen, phosphorus and potassium together to achieve full water limited yield.
Introduction
Trial work carried out over the last six years into the impact of phosphorus and potassium nutrition in dryland cropping production has revealed some interactions with nitrogen management that can have significant impacts on grain yield.
The supply of N to the plant can have major implications on the response to deep applied P and K fertiliser strategies and the reverse has also been apparent where response to N has been compromised by deficiencies in P and K nutrition. This work has reinforced the concept of Liebig’s law of the minimum and given some practical evidence of this theory at work in the field.
While N nutrition has not been the focus of some of the trials conducted in the last six years, learnings from these data sets highlights some issues with not managing N, P and K together in a dryland farming system.
Experimental outline
This paper will discuss the results of three experiments operating on properties in Central Queensland dating back to 2013. Two of these experiments relate to nitrogen response work done with sorghum in 2012 and 2013 and the other data set relates to sorghum response to long term deep applied P experiment in 2018.
Experiment 1
Two nitrogen response sites were established in 2013; one near Dysart and one near Springsure creek. Both sites were set up with the same trial design using seven main treatments at both sites (Table 1). These rates of N were applied in 50cm bands (10cm deep) with additional background fertiliser applied offset from the main N band. The additional fertiliser included phosphorus (P), potassium (K), sulphur (S) and zinc (Zn) (Table 1) and this was applied to ensure that there were no other nutritionally compromising factors to the trial. In order to measure if these background elements could have an influence on the trial, two of the treatments was repeated (0N and 160N) without the background fertiliser.
Table 1. Treatments in nitrogen response trials at Dysart and Springsure creek in 2013 (kg/ha)
Treatment | N rate | P rate | K rate | S rate | Zn rate | Treatment Label |
|---|---|---|---|---|---|---|
N1 | 0 | 20 | 50 | 20 | 0.5 | 0N+PKS |
N2 | 40 | 20 | 50 | 20 | 0.5 | 40N+PKS |
N3 | 60 | 20 | 50 | 20 | 0.5 | 60N+PKS |
N4 | 80 | 20 | 50 | 20 | 0.5 | 80N+PKS |
N5 | 160 | 20 | 50 | 20 | 0.5 | 160N+PKS |
N6 | 0 | 0 | 0 | 0 | 0.5 | 0N |
N7 | 160 | 0 | 0 | 0 | 0.5 | 160N |
Treatment plots were set up within the grower-controlled traffic tramlines with each plot being 8m wide by 32m long and the total trial site was eight plots long per column (running parallel with the tramlines and old stubble rows) and six rows (8m blocks excluding the area in the tramlines) wide giving a total of 48 plots across six replicates.
Sorghum was planted by the grower with their own machinery with Dysart site being planted on the 16 January 2014 and the Springsure creek site planted on the 7 February 2014. Grain yield measurements were taken with a two-metre-wide plot header on the 10 June 2014 (Dysart) and 2 July 2014 (Springsure creek).
Experiment 2
Two nitrogen and sulphur response sites were established in 2012; one near the area of Fernlees, north of Springsure and the other in the Lilyvale district between Emerald and Capella. Both sites were set up with the same trial design using a completely randomised block design and combining nitrogen and sulphur treatments plots together in the one trial. Treatments were either a base rate of sulfur with varying rates of N or a base rate of N with varying rates of sulfur (Table 2).
Table 2. Treatments in nitrogen and sulphur response trials at Fernlees and Lilyvale in 2012
Treatment Labels | S Rate (kg/ha) | N Rate (kg/ha) |
|---|---|---|
0N 0S | 0 | 0 |
10N 12S | 12 | 10 |
25N 12S | 12 | 25 |
40N 12S | 12 | 40 |
55N 12S | 12 | 55 |
70N 12S | 12 | 70 |
85N 12S | 12 | 85 |
100N 12S | 12 | 100 |
75N 0S | 0 | 75 |
75N 6S | 6 | 75 |
75N 12S | 12 | 75 |
75N 18S | 18 | 75 |
75N 24S | 24 | 75 |
There were 13 treatments used (including control), but there were 16 plots per replicate with three extra control plots used in each replicate. The plots were 6 m wide by 32 m long and the trial was setup with eight plots long by eight plots wide across four replicates giving a total of 64 plots.
The only other nutrition applied to these trial sites was a starter rate of P at planting which was applied as Triple Superphosphate, applied offset to the planting row at a rate of 60kg/ha. The trial was planted by Pacific Seeds staff using their trials planter on the 9 and 11 February 2013. Harvesting was competed with a two-metre plot harvester on the 29 and 30 July 2013.
Experiment 3
A long-term nutrition trial site was established near Dysart in 2013. While this site had multiple nutrition trials established side by side, this data set is only concerned with the deep placement P trial. The trial is a typical example of deep banded P trials that have been set up across multiple trial sites in CQ over the last six years. The trial involves the response to four different P rates (0, 10, 20 and 40 kg P/ha) with background rates of N, K, S and Zn applied to offset any other major nutrient deficiencies (Table 3). The trial also has three other treatments that use the highest and lowest rate of P without any background fertiliser applied (0P-KS, 40P-KS) as well as a farmer reference (FR) treatment that represents the grower co-operator commercial operations and has had no experimental applications of fertiliser applied (Table 3).
The performance of these treatments have been monitored over six years and six crops (planted by the grower on this trial site since 2013). Of interest to this paper is the differences in responses between two sorghum crops grown in the 2016 and 2018 seasons.
Table 3. Treatment list of Dysart trial looking at response to four different P rates (0, 10, 20 and 40 kg P/ha) with background rates of N, K, S and Zn applied to offset any other major nutrient deficiencies. The trial also has three other treatments that use the highest and lowest rate of P without any background fertiliser applied (0P-KS, 40P-KS) as well as a farmer reference (FR)
Treatment | N rate (kg/ha) | P rate (kg/ha) | K rate (kg/ha) | S rate (kg/ha) | Zn rate (kg/ha) | Treatment Label |
|---|---|---|---|---|---|---|
P1 | 80 | 0 | 50 | 20 | 0.5 | 0P+NKS |
P2 | 80 | 10 | 50 | 20 | 0.5 | 10P+NKS |
P3 | 80 | 20 | 50 | 20 | 0.5 | 20P+NKS |
P4 | 80 | 40 | 50 | 20 | 0.5 | 40P+NKS |
P5 | 80 | 0 | 0 | 0 | 0.5 | 0P+N |
P6 | 80 | 40 | 0 | 0 | 0.5 | 40P+N |
P7 | - | - | - | - | - | FR |
Results
Experiment 1
Although the mean grain yields for these N response trials (Figure 1) show no significant difference in rate response to applied N; but it does show a significant difference between those treatments that have no background fertiliser (0N versus 0N-PKS, 160N versus 160N-PKS).
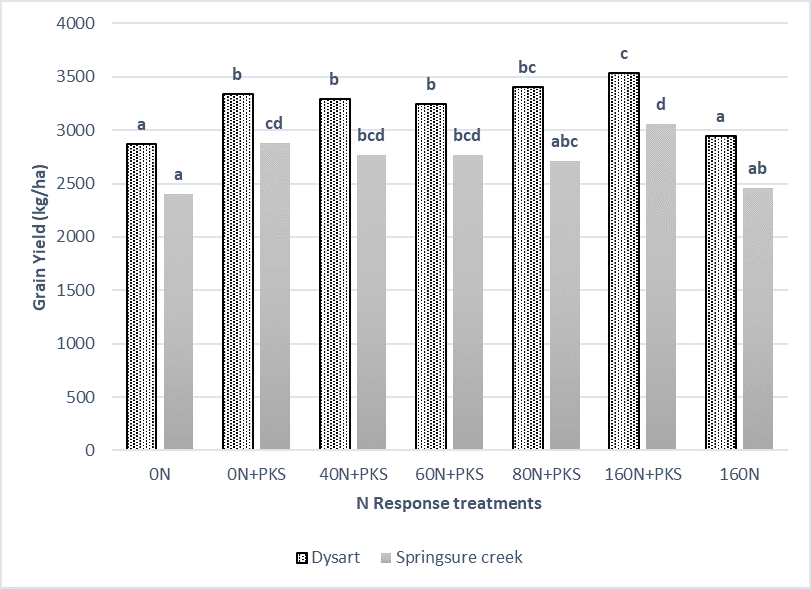 Figure 1. Mean grain yields for N treatments in 2013 sorghum trials at Springsure creek and Dysart. Means with the same letters are not significantly different. Least significant differences (P=5%) are only attributable within each trial, there is no cross-site analysis
(Dysart LSD=175, Springsure creek LSD =342)
The lack of background fertiliser has reduced the yield by ~500 kg/ha (16-24%). Comparing just the treatments that had the background nutrition withheld shows a significant difference in total N uptake for the plant (Figure 2). It is clear that the plants ability to utilise extra N in the soil profile is impacted by one or more of the background nutrients (P, K, S). In relative terms the background nutrients have increased N uptake by ~13% at Dysart and ~20% at Springsure creek.
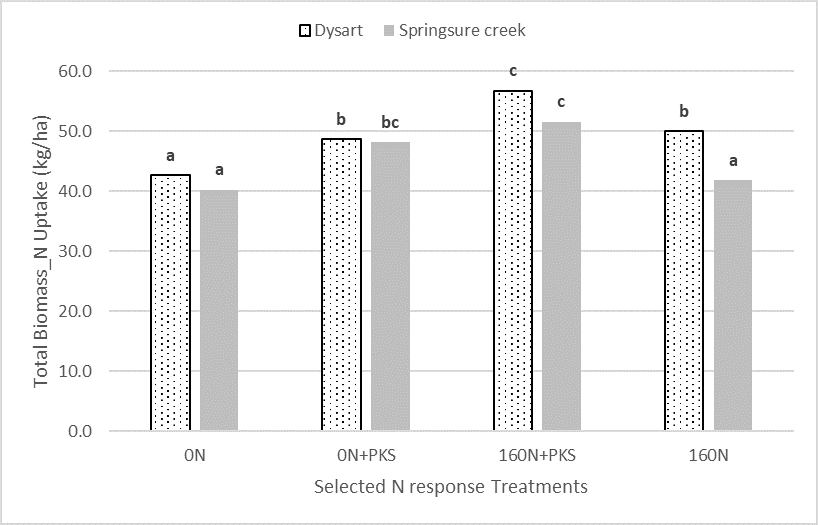 Figure 2. Mean N uptake amounts for total biomass in treatments comparing with and without background fertiliser applied. Means with the same letters are not significantly different. Least significant differences (P=5%) are only attributable within each trial, there is no cross-site analysis (Dysart LSD =4.77, Springsure creek LSD =4.05).
While it is impossible to know which background nutrient has had the most effect from this information, given the responses that have been gained from P on its own in the other trials at this site then it is highly likely that it is P in the background nutrition that is having the largest impact on the uptake of N in these sorghum plants.
Experiment 2
In this experiment we are comparing the performance of N response across two sites even though there is no cross-site analysis recorded with this data. The contrast is quite large and the evidence surrounding these sites does provide a strong indicator of the interaction between N, P and K.
Both sites are cracking vertisols although Fernlees has some alluvial influences in its formation and the Lilyvale soil is shallower and derived from basalt weathering. Both sites had similar starting N and in-crop rainfall (Table 4) but starting moisture was more limited at the Fernlees site (Table 4). Neither trial site had a full profile at planting but good moisture levels in the top 50cm made it possible to plant with some confidence.
Table 4. Summary of the agronomic characteristics of the trial sites
Site | Depth | Nitrates | Colwell P | K | Total profile N | In-crop rainfall | Starting water |
|---|---|---|---|---|---|---|---|
cm | mg/kg | mg/kg | meq/100g | kg/ha | (mm) | (mm) | |
Fernlees | 0-10 | 3 | 6 | 0.22 | 36 | 275 | 87 |
10-30 | 5 | 3 | 0.07 | ||||
Lilyvale | 0-10 | 5 | 18 | 1.25 | 30 | 242 | 100 |
10-30 | 4 | 6 | 0.56 |
In relation to P and K nutrition these two sites had some natural differences. Most obvious is that K levels at the Lilyvale site were unlimiting whereas the Fernlees site was more marginal in the top 10cm and deficient in the 10-30cm zone (Table 4). P levels were also limiting in both sites although the Lilyvale site did have adequate levels of P in the top 10cm and a reasonable rate of starter fertiliser was applied at planting.
Grain yield data (Figure 3) would suggest that the Lilyvale site responded well to the increasing rates of N applied as small plot treatments; whereas the Fernlees site had no response at all, even at the highest N rates. The starting N supply (Table 4) and the amount of in-crop rainfall would suggest that both sites should respond to N. It is interesting to note that both sites recorded similar yields in the control plots which would suggest that agronomically the sites are not too different.
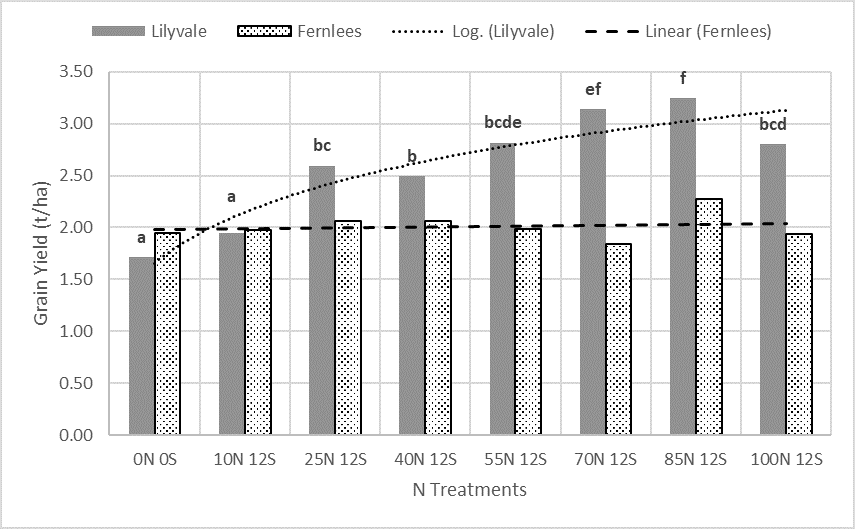 Figure 3. Mean grain yields for N response treatments across both the Lilyvale and Fernlees trial sites. Means with the same letters are not significantly different. Least significant differences (P=5%) are only attributable within each trial, there is no cross site analysis (Lilyvale LSD =0.333, Fernlees LSD =n.s)
Given both sites were planted to the same variety within two days of each other it is difficult to understand such a large discrepancy in responses. Chemistry analysis of the total biomass of the crop (Figure 4A and 4B) does give some clues on what the major influence might be in this situation.
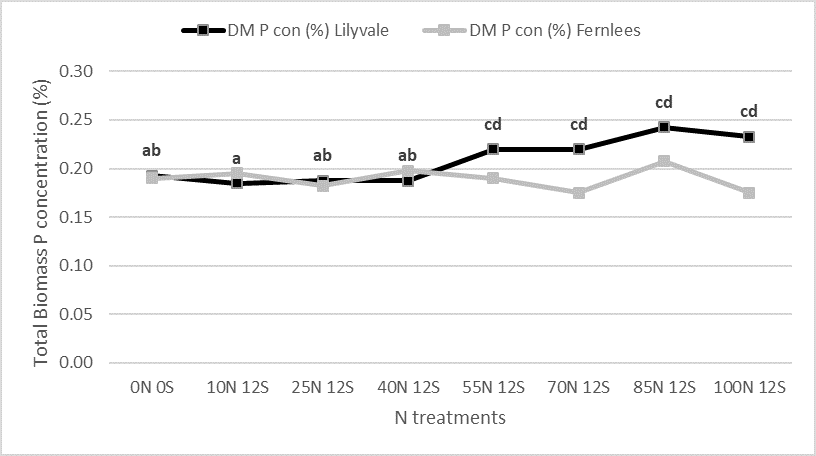 Figure 4A. Mean P concentrations for total biomass across N response treatments in both trial sites. Means with the same letters are not significantly different. Least significant differences (P=5%) are only attributable within each trial, there is no cross site analysis
(Lilyvale LSD =0.032, Fernlees LSD =n.s)
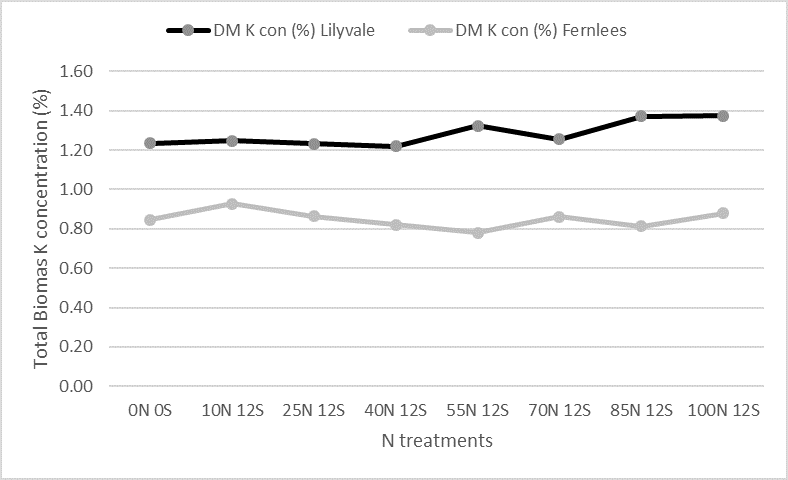 Figure 4B. Mean K concentrations in total biomass across N response treatments in both trial sites. Least significant differences (P=5%) are only attributable within each trial, there is no cross site analysis (Lilyvale LSD =n.s, Fernlees LSD =n.s)
Plant tissue analysis for P (Figure 4A) reveals both sites had access and took up similar levels of this nutrient even though P concentration in the plant increased at higher N rates at the Lilyvale site. Plant tissue analysis has revealed a large discrepancy in K concentration (Figure 4B) in the plant regardless of N treatment. The differences in control plots shows that the natural level of K uptake in the crop were very different (46%) between the two sites especially given the same species of crop and the same variety. Soil tests show (Table 4) there is a clear difference in K nutrition status.
The relative uniformity of K in the plant regardless of N status may suggest that the uniformity in grain yield across all N treatments maybe due to the lack of K nutrition. A secondary piece of evidence is the N concentration in the plant at both sites (Figure 5). The N concentration in tissue analysis at the Fernless site shows higher concentration in the control plots which would suggest the Fernlees site had slightly better access and uptake of N in its natural state, but grain yields were similar (Figure 3). Increasing N rates benefited the Lilyvale site with increasing grain yield and small significant differences in N uptake in biomass. The Fernlees site has also had some small increases in N uptake but this has not been able to convert into grain yield.
The natural conclusion is that the poor supply of K has made a significant impact on the plants ability to convert the extra N into grain yield.
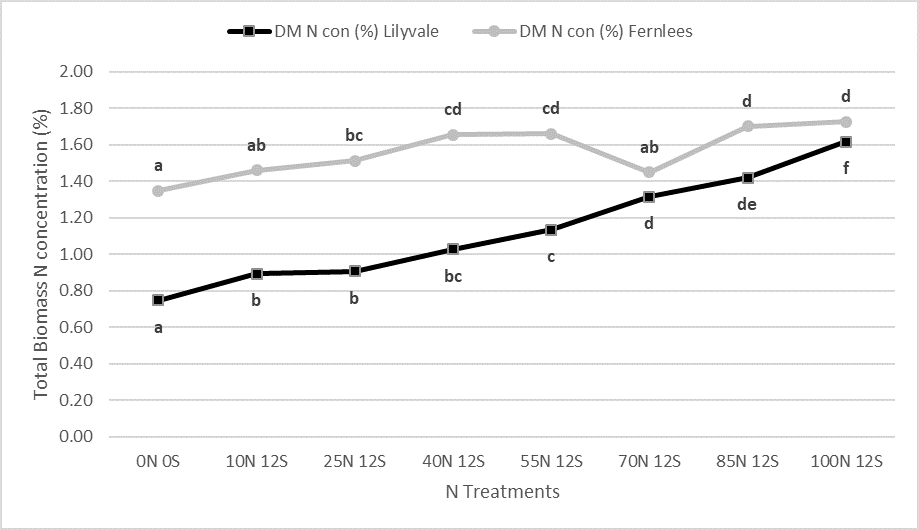 Figure 5. Mean N concentrations in total biomass across all N response treatments in both trial sites. Means with the same letters are not significantly different. Least significant differences (P=5%) are only attributable within each trial, there is no cross-site analysis
(Lilyvale LSD =0.1507, Fernlees LSD =0.1503)
Experiment 3
This data relates to a deep banded P experiment conducted at Dysart involving two sorghum crops grown in 2016 and 2018. The results demonstrate a mark difference in performance of the deep P treatments coinciding with large differences in grain protein.
Table 5. Summary of agronomic characteristics for sorghum crops grown in 2016 and 2018 on deep P trial.
Planting date | Harvest date | Starting water | Starting N | In-crop rainfall (mm) | |
|---|---|---|---|---|---|
2016 Sorghum | 17/02/2016 | 7/07/2016 | 191 | 27 | 202 |
2018 Sorghum | 13/02/2018 | 21/06/2018 | 237 | 196 | 159 |
Both sorghum crops experienced similar conditions in terms of planting and harvesting (Table 5). Starting soil water differences were balanced out by in-crop rainfall for both crops so crop conditions were similar. The one major difference is the starting N figures which shows the 2016 crop had very low N conditions at planting (Table 5).
The 2016 sorghum crop did have 100 kg Urea /ha applied but it was three weeks after planting as a sidedress application. The 2018 sorghum crop had 200 kg Urea/ha applied in the fallow preceding summer rainfall and planting in February.
Grain protein data (Figure 6) shows a consistent difference in grain protein between the two years (mean 8.1%, 2016 to 11.7%, 2018). These protein levels were uniform across deep P treatments even though grain yields were significantly different between treatments.
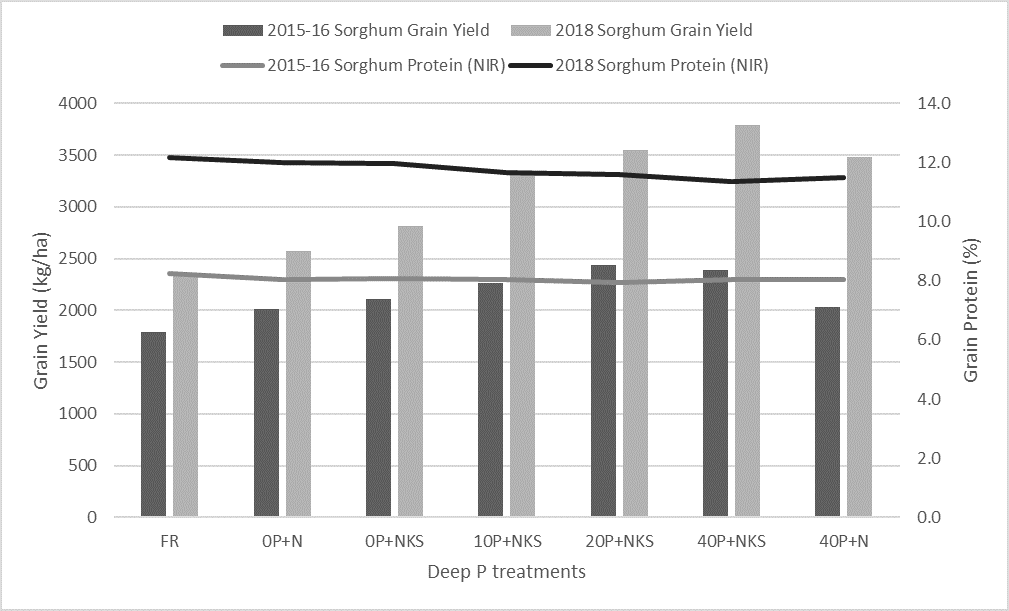 Figure 6. Mean grain yields for 2016 and 2018 sorghum crops across the deep P trial plus associated mean grain protein levels across treatments. Means with same letters are not significantly different. Least significant differences (P=5%) are only attributable within each trial, there is no cross-year analysis (2015-16 Sorghum LSD =253, 2018 Sorghum LSD =396)
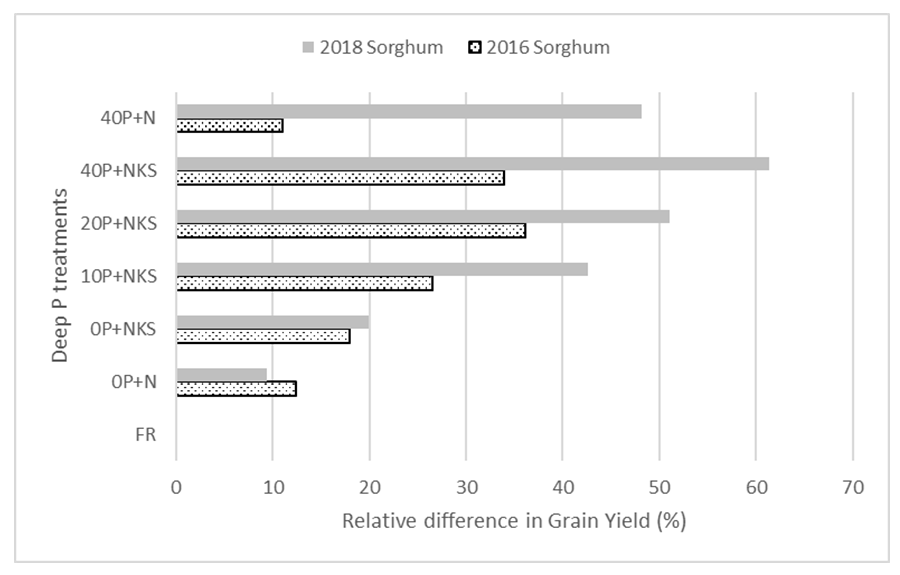
While this data has not been analysed across years the relative differences are large between the two crops from the same plots (Figure 7), with the 2018 crop almost doubling the relative yield difference from 2016. The fact that that the 2018 crop is the fifth crop grown on the trial site would lead to an expectation that the yield response would be declining in relation to the deep treatments however in this case the opposite has occurred and the main difference is the supply of nitrate in the soil profile (Table 5) and the uptake of N in the plant demonstrated by the low protein figures (Figure 6).
This piece of evidence would suggest that the N supply can have a major impact on the plants response to phosphorous on deficient soils.
Summary
The three trials highlighted in this paper have each shown the real impact of not balancing up macro nutrient supply in the soil profile. The data demonstrates that P and K can prevent increases in yields from N application as well as a lack of N supply can reduce the response to P and K in deficient situations. Deficiencies in either N, P, or K have the capacity to limit yield and although this is known intuitively (Liebig’s Law of the Minimum), direct evidence of yield loss shows the real numbers around the impact on grain production. Expenditure on fertiliser can be unprofitable if there has not been enough consideration given to the level of all macro nutrients in the soil profile.
Several trial sites in CQ have shown that multiple deficiencies can exist in soil types that have high water holding capacity. Water limited yield cannot be achieved unless all major nutrient deficiencies are dealt with at the same time.
Soil testing is imperative to make sure that all macro nutrient levels are well identified and ensure that the most appropriate fertiliser strategy is adopted. Unfortunately, management of macro nutrient deficiencies are not all the same. N and S need to be treated differently to P and K but all four are essential to achieve water limited yield.
Acknowledgements
The research undertaken as part of this project is made possible by the significant contributions of growers through both trial cooperation and the support of the GRDC, the author would like to thank them for their continued support.
Contact details
Doug Sands
Department of Agriculture and Fisheries
LMB 6, Emerald QLD 4720
Ph: 07 4991 0811
Email: douglas.sands@daf.qld.gov.au
GRDC Project Code: UOQ1207-001RTX, UQ00066,
Was this page helpful?
YOUR FEEDBACK
