Time of sowing of cereals - matching sowing dates in different environments
Author: Darren Aisthorpe (Queensland Department of Agriculture and Fisheries) | Date: 27 Nov 2019
Take home messages
- Understand your frost risk profile and temperature variance up and down the slope
- Target a flowering window that suits your risk profile
- Select a planting window, based on your flowering window
- Be aware that flowering dates will fluctuate due to a range of factors.
Background
The Department of Agriculture and Fisheries (DAF) in conjunction with the Grains Research and Development Corporation (GRDC) and the Department of Primary Industries, New South Wales (NSW DPI) have been working on multiple wheat phenology and agronomy-based projects in Central Queensland (CQ) over the past 5 years. These trials typically involve sowing a selection of commercial genotypes (varieties), with a broad maturity spread on multiple sowing dates.
A comprehensive set of data has been collected from these trials, in a bid to better understand how a selection of genotypes react in a range of environments at different sowing dates. 2019 was the final year for this research in CQ. Final data has been collected, and analysis has started to draw some interesting observations about the performance of various genotypes, but more importantly, how to optimise key agronomic levers to improve production in CQ.
Response to sowing date
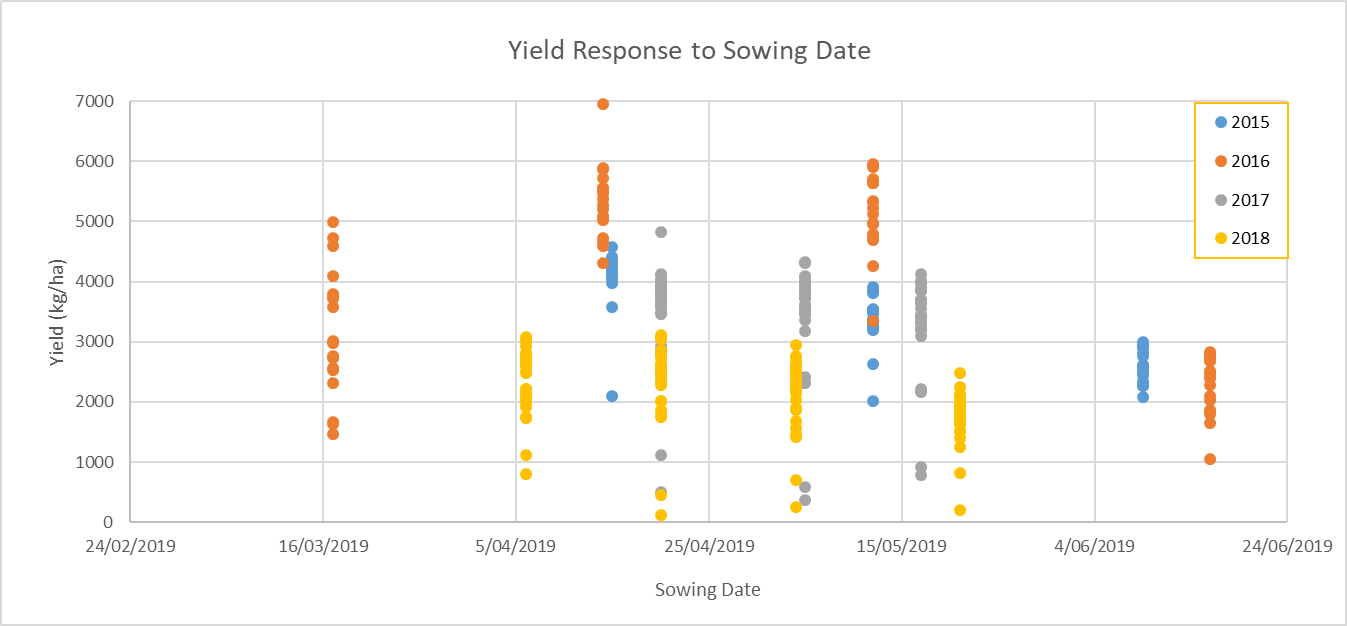
Phenology observations have been collected since 2015 from research projects including three years of the ‘Optimising grain yield potential of winter cereals’ (BLG104), and two years of the ’Variety specific agronomy package’ projects. This has allowed analysis of yield response to planting dates ranging from mid-March right through to mid-June. Different maturities and genotypes will respond differently to varying climates and sowing dates, hence the wide range of yields for each sowing date and year (Figure 1). However, of more interest is the difference (or lack of) in yield potential between sowing dates for the same year. The majority of the planting dates were between early April and late May, and despite the yearly variation between the trials, there is no significant difference in yield potential within a year, based on sowing date, unless planting before April or sowing pushes well into late May/early June.
 Figure 1. Average varietal yield response in Kg/ha to sowing date across sowing dates. (p=0.05) LSD 2015: 519 kg, 2016: 411 kg, 2017: 355kg, 2018:240kg. While there is a wide range of varietal response per sowing date, there is little no difference between sowing dates from early-April through to mid– May.
Yield response to flowering date
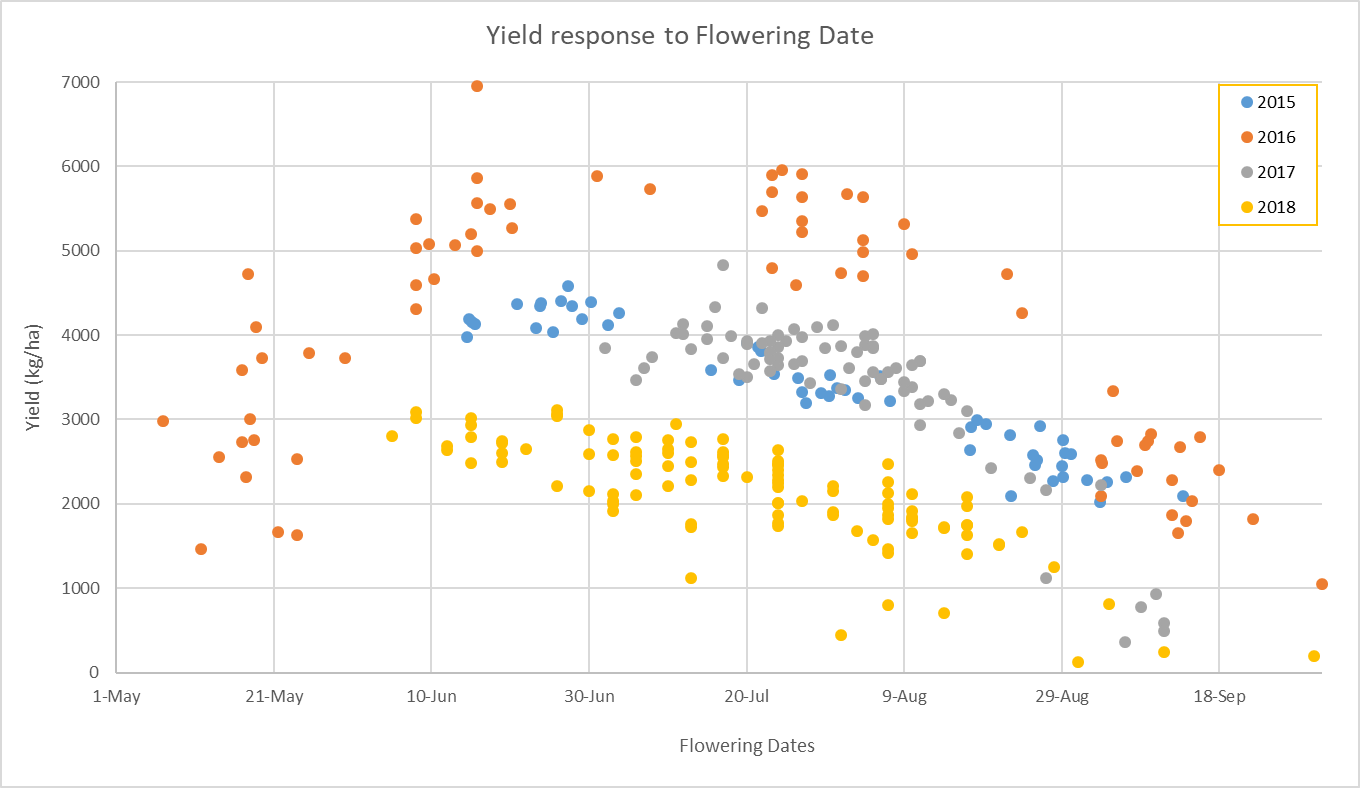
When assessing yield response to flowering date, a more defined window appears. Figure 2 shows the same yield data from (Figure 1) above, this time focusing on GS65 dates (50% flowering) instead of sowing dates. As a trend, when you look at all the data points from the same year, typically, the higher yields from all genotypes occurred when they were able to flower in the June – July period, with yields falling away the later flowering occurred.

Figure 2. Average varietal yield response in Kg/ha to flowering dates for all four sowing dates from 2015 to 2018. (p=0.05) LSD 2015: 519kg, 2016: 411kg, 2017: 355kg and 2018: 240kg. There is consistent trend across all four years that yield potential drops away, the later in the year the crop flowers. June – July appears to be the optimum time for the Central Highlands to have wheat flowering, provided frost is not a risk.
Frost risk
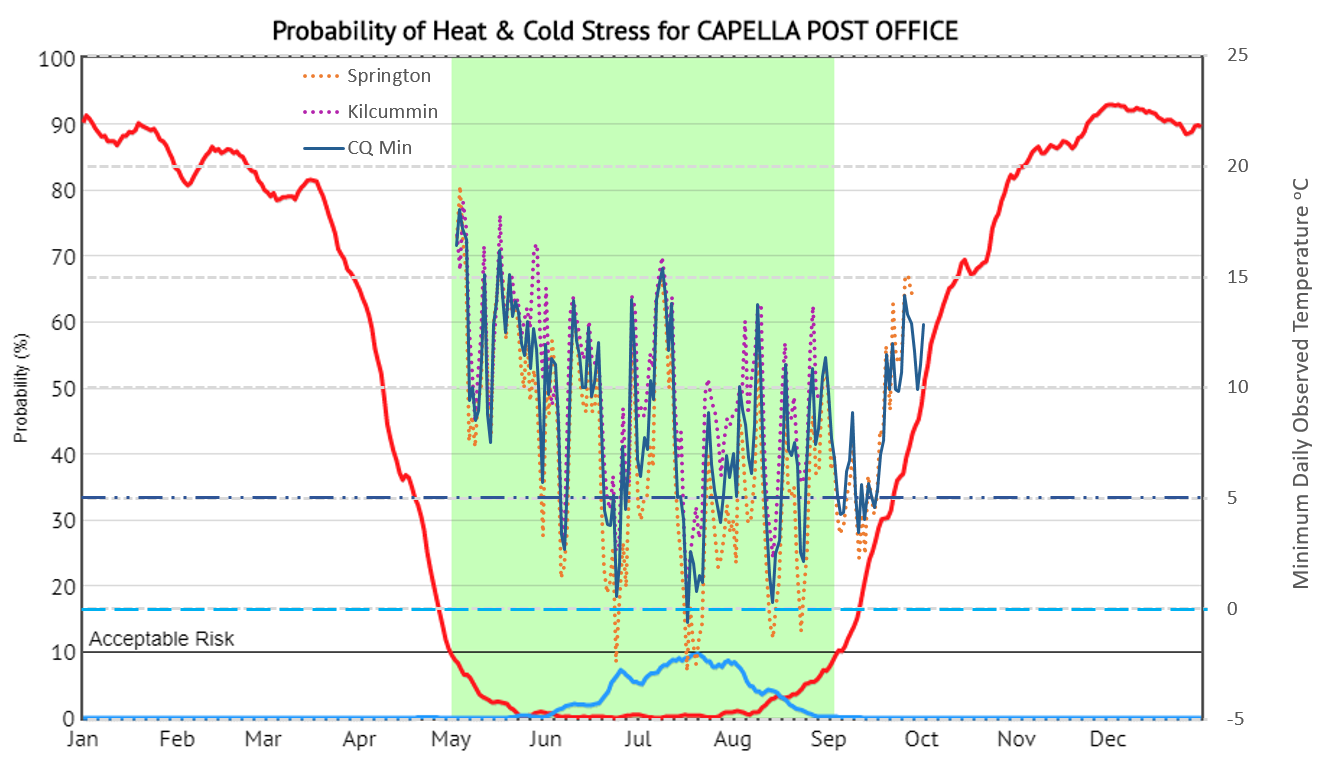
Frost is always a threat in CQ, even as average daily/monthly temperatures continue to climb. This does not mean the chance of a frost event occurring has diminished (Figure 3). Despite the number of low temperature events experienced in 2019, they still generally fall within the standard “risk” period shown, although in the last two years in particular, they have continued further into August than the historical risk graph shows.
Frost risk tends to increase the further south you travel, i.e. the frost risk on lower flood plains southeast of Gindie is higher than that of Kilcummin. That said, the number of actual events really is not any different (Figure 3), only the severity. Where the wheat field is located in the landscape can also have a significant effect on frost risk. Fields lower in the landscape tend to have a higher frost risk, than those on top of a ridge for a given latitude.

Figure 3. 2019 heat and cold risk assessment for Capella compared to actual observations from Gindie, Kilcummin and Emerald Research Facility. The red line indicates the ‘probability’ of receiving temperatures above 30oC; the light blue solid line shows the ‘probability’ of receiving temperatures below 2oC. The area marked in green indicates there is a less than 1 in 10 year chance, based on historical data for the site, of exceeding either of these temperature thresholds for that location.
The annual GRDC NVT trial booklet and variety guide has long been a keystone component of how varieties are selected and when new varieties coming through should be planted. However, while it still is a useful guide, as average monthly temperatures have steadily risen over the past 20 years driving changes in the plants phenology, some of the recommendations may not be as optimised as hoped.
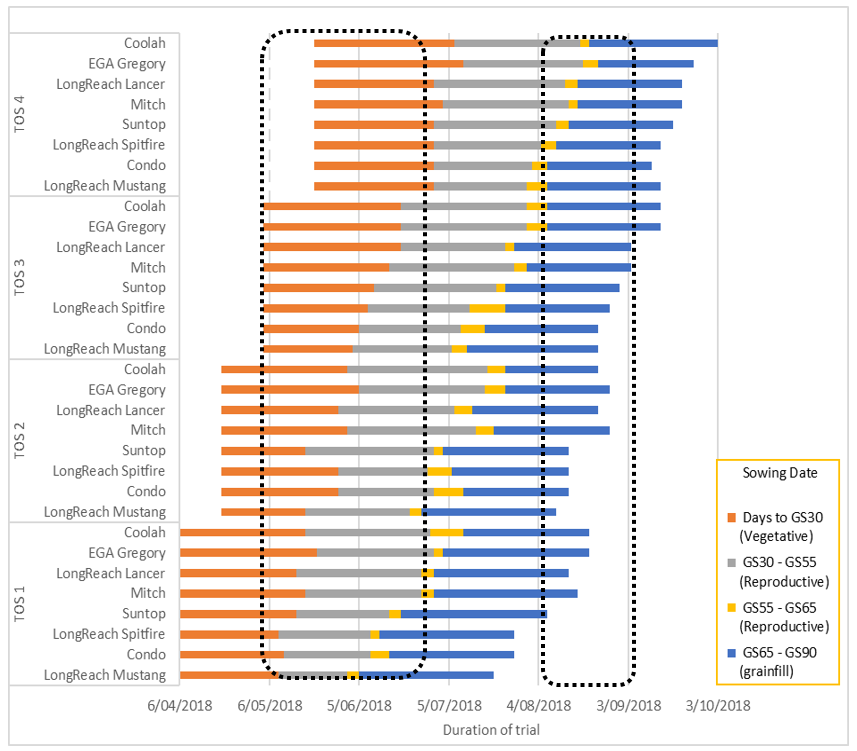
In 2018, the ‘Optimising grain yield potential of winter cereals in the Northern Grains Region’ project collected data for a selection of varieties across a range of maturity types (Figure 4). The stacked bars represent different stages of the crops development for the range of varieties over the growing season. The yellow bars indicate when the crop was transitioning between GS55 (head emergence) and GS65 (50% flowering).
The dotted shapes on the graph indicate windows, based on historical data, when minimum and maximum temperatures are not expected to exceed 30oC or fall below 2oC for Emerald, based on a 1 in 10-year chance of exceeding those parameters. Time of sowing (TOS) 1 planted, early April, and TOS 4, planted late May, generally do achieve these safe zones. Unfortunately, TOS 2 and 3, which are late April and early May sowing dates respectively, all flower in the higher risk period.
Figure 4. Phasic development of selected varieties across four sowing dates at Emerald, 2018. Vegetative phase from sowing to start of stem elongation (GS30-Orange), to head emergence (GS55 - Grey) to 50% flowering (GS65 - yellow) and through to physiological maturity (GS90 - Blue) .
All varieties listed above are protected under the Plant Breeders Rights Act 1994.
When planting wheat in sloping country, are there any strategies, using our understanding of wheat phenology, to reduce risk and maximise yields?
- Understand your frost risk profile.
- When historically do you expect temperatures to begin dropping below 2oC?
- What is the temperature variation between the top of the slope and the bottom?
- Is the higher country less prone to frost?
- Could you have wheat flowering in traditionally higher risk periods in that area?
- Target a flowering date on your risk profile
- Is wheat flowering early-June to mid-July a practical target for your situation?
- Is holding off flowering until August a safer option?
- Is the yield penalty for planting later more significant than the frost risk in June/July?
- Select a planting window, based on your flowering window
- Be aware planting date can affect days to flowering (Figure 5)
- Degree days is not a reliable option for identifying a flowering date, particularly for longer season varieties.
- Quicker maturities will alter days to flowering more than longer maturities based on sowing dates.
- Later planting dates reduce the flowering gap between maturities.
Figure 5. Average accumulated degree days (left) and days to flowering for 8 varieties over 5 years. Blue bars are for an early April plant, orange bars are for a late May planting date.
All varieties listed above are protected under the Plant Breeders Rights Act 1994.
(Data not yet statistically analysed, use as indicative only).
Suggested strategies
Traditional logic with sloping country was to plant higher, “safer” country with quicker varieties, and then lower, more frost prone country with longer season varieties. Idea being that the quicker varieties would flower earlier, with reduced risk from frost damage. The longer season varieties would have a 10 – 15 day gap and hopefully avoid any final major frosts before flowering later in the season. This strategy however, was based on a target flowering date in late-July to Mid-August.
Technology now allows growers to utilise two or more varieties when planting up and down the slope, so do the old rules hold true? …. No. First issue is that if flowering in early to mid-August, you are limiting yield potential (Figure 3). In 2015 the yield difference between a mid-June to mid-August flowering date was over 1.5 t/ha, in 2018 it was 1 t/ha. Secondly, even with the later flowering dates, you are not guaranteed to miss potentially damaging frost events (Figure 4). Temperatures dipped down to zero twice in August 2019, while 2018 saw a severe frost on August 22, which took out a number of chickpea crops across the central highlands.
A suggested strategy would be to target a mid-June flowering date for the lowest of your country, with a quick to very quick maturing variety. As you go higher up the slope you could then use a mid or longer maturity variety as the frost risk diminishes. If a mild frost event then does occur in late June/early July, the quick should be finished and the longer season variety should still handle the frost at the higher altitude.
Other benefits of this strategy would be:
- If the moisture is there, plant by the calendar, not by the rain gauge
- Planting can start earlier (early April), tapping into stored summer rainfall before it gets away
- Deep planting is less risky as the moisture should still be relatively close to the surface so improved establishment and a much higher chance of getting in-crop rainfall in April/May to assist in getting secondary roots down
- Earlier planted crops, particularly mid and longer season varieties have time in cooler conditions to compensate for poorer establishment, particularly when chasing moisture.
Challenges:
- Flowering dates vary depending on sowing date, stress, population, etc.
- Where do you draw the line between the quick varieties and the longer maturity varieties?
- Historical data is only a guide, there are no guarantees when we are or not going to receive a frost.
Acknowledgements
The research undertaken as part of this project is made possible by the significant contributions of growers through both trial cooperation and the support of the GRDC, the author would like to thank them for their continued support.
I would like to acknowledge and thank the DAF QLD Research Agronomy Team of technical staff based in Emerald. In particular Ellie McCosker, who has been the lead technician on the cereal phenology research in CQ for the past three years. Jane Auer also has put a power of work into assisting Ellie with the mountain of data collected, particularly over the past 3 years.
Finally, I would like to acknowledge Felicity Harris, from NSW DPI as project lead for the NSW DPI/GRDC bilateral funded “Optimising grain yield potential of winter cereals” project.
Contact details
Darren Aisthorpe
Department of Agriculture and Fisheries
99 Hospital Rd. Emerald QLD 4720
Mb: 0427 015 600
Email: Darren.aisthorpe@daf.qld.gov.au
GRDC Project Code: BLG104,
Was this page helpful?
YOUR FEEDBACK


