Estimating in-crop nitrogen mineralisation in Victorian cropping systems
Estimating in-crop nitrogen mineralisation in Victorian cropping systems
Author: Katherine Dunsford and Roger Armstrong (Agriculture Victoria) and Caixian Tang and James Hunt (La Trobe University) | Date: 25 Feb 2020
Take home messages
- In-crop mineralisation can potentially supply a major proportion of the demand for nitrogen (N) of wheat crops, across a range of Victorian cropping systems.
- Field-based estimates of net in-crop N mineralisation were highly variable, ranging from net immobilisation or losses, through to net mineralisation of up to 116kg N/ha (median 33kg N/ha).
- The variability in net N mineralisation chiefly reflected rainfall.
- Several promising methods for predicting in-crop N mineralisation prior to sowing were identified, but all require further testing and calibration before they could be used to assist in N budgeting.
Background
Nitrogen (N) supply is the single largest factor contributing to the gap between growers’ wheat yields and water-limited yield potential (Hochman and Horan 2018). Adding N fertiliser is the most common method used to meet the shortfall in crop N supply. However, miscalculation of soil N supply can have adverse effects on yield, either through N deficiency or increased biomass production resulting in terminal drought stress and ‘haying off’ (van Herwaarden et al. 1998).
Improving N management requires greater understanding of how much N is being supplied from the soil to the crop, so fertiliser inputs can be adjusted accordingly. Crop N supply is derived from four main sources; residual N from the previous season, N mineralised during the fallow period, N which mineralises during the season (also known as in-crop mineralisation - ICM), and inputs of N fertiliser to make up for any potential shortfall (Angus 2001). Residual N and available N after the fallow period can be measured by soil testing prior to sowing (Angus et al. 1998; Peoples et al. 2017). Nitrogen mineralised during the growing season is more difficult to predict, since the bulk of this N becomes available only after most N fertiliser decisions are made by growers. To ensure that fertiliser N supply is optimised, grain growers require an accurate and timely estimate of in-crop N mineralisation.
Significant changes have occurred in Australian cropping systems over the past 20 years, including a reduction in area planted to legume pastures, increased use of N fertiliser, increased cropping intensity and adoption of reduced tillage and stubble retention. Despite these changes, there are few recent studies which examine net N mineralisation in current cropping systems, especially in alkaline soils which support large areas of grain production in Victoria (Bell et al. 2016).
A recent survey suggests Australian advisors consider in-crop N mineralisation to be an important source of N, but many advisors were concerned about the accuracy of current methods of predicting in-crop N mineralisation and preferred cheap, simplistic methods when formulating crop N budgets (Bell et al. 2016). Soil samples, collected during pre-sowing soil testing, offer a valuable opportunity to quantify mineral N already present but can also be utilised to predict potential soil N supply during the growing season. Soil incubation, under aerobic or anaerobic conditions, is the standard method for predicting the potential N supply from soil (Ros et al. 2011), but it is time-consuming and not widely utilised. Several alternative soil testing methods, however, have been identified from international studies for different production systems and alternative industries that may offer viable alternatives to incubation techniques.
The aims of this study were to (i) update knowledge of ICM on predominately alkaline soils in Victoria , (ii) assess the relative potential importance of net ICM to crops and (iii) use field estimates of net ICM to assess the predictive ability of a range of tools (both soil tests and a simple predictor).
Methods
Crop and soil data were collected from a range of sites in western Victoria that encompassed different rainfall zones, soil types, preceding crop types and management systems. The study comprised data from 73 grower paddocks (including four irrigated paddocks), two long-term crop rotation/tillage experiments, and several small replicated on-farm experiments throughout the low (<400mm annual rainfall), medium (400-550mm) and high (>550mm) rainfall zones in Victoria- between 2013 and 2016. Plant and soil sampling protocols (number of cores and size of cuts) differed slightly between projects but were generally, profile soil cores (to 1.2m) were collected before sowing and after harvest and divided into 5 depth increments: 0–0.1, 0.1–0.2, 0.2–0.4, 0.4–0.8, and 0.8–1.2 m to form one composite sample for each depth. Soil samples were air–dried (<40°C) and ground (<2mm), before being analysed for nitrate concentration. Results were converted to kg N/ha. Shoot biomass at grain maturity was measured by taking quadrat cuts. The plant samples were oven-dried at 70°C, weighed and threshed to determine grain yield. Subsamples of the grain and straw were analysed for total N and results were used to calculate crop N uptake (kg N/ha).
In this study, net ICM was estimated from the field data using a modified version of the equation outlined in Armstrong et al. (1999):
Net ICM (kg N/ha) = Crop N × 1.1 + SNM - (SNS + Nfert) ……. Eq. 1
Where Crop N is the total amount of N contained in the shoots of the crop at maturity multiplied by 1.1 to estimate the fraction of N allocated to roots of wheat (Angus 2001). SNM and SNs are soil nitrate (0 – 1.2m) at maturity and at sowing, respectively, and Nfert is applied fertiliser N (kg N/ha). The (potential) importance or contribution of net ICM and pre-sowing profile nitrate were determined by dividing the net ICM by the crop N uptake.
Additional soil chemistry data, growing season rainfall and management data were also collected. A comprehensive methodology for the data collection can be found via the link in the ‘Useful Resource Section’ below.
Methods of prediction
Pre-sowing soil samples from 0-10 and 10-20cm depth, were used for the laboratory-based methods of predicting ICM. This study examined four laboratory methods, including anaerobic incubations (seven day incubation of soil and water at 40⁰C in a sealed syringe), hot KCl extractions (heating a solution of soil and KCl for 16 hour extraction at 95⁰C), Solvita Labile Amino Nitrogen (SLAN) test (24-hour incubation of soil treated with NaOH in the presence of an ‘indicator paddle’) and predictions using Mid-infrared (MIR) spectroscopy. These methods were selected based on the criteria that they are simple, rapid and in-expensive. Also included was the simple calculator known as the ‘Ridge method’; 0.15 × Soil organic C (%) × growing-season rainfall (GSR) (mm), which is widely used by agronomists in the Wimmera and Mallee region of Victoria. Results from the methods of prediction and simple calculator were compared to the field estimates of mineralisation using correlation coefficients (Genstat V.18).
Results and discussion
Characteristics of the dataset
Data collected for this study came predominately from the medium-rainfall zone (63% of data), with smaller contributions from the low (14%), high (15%) rainfall zones and irrigated cropping systems (7%). The majority (72%) of data was collected during the 2014 and 2015 seasons. The soils were predominately clay in texture (47%), followed by sandy clay loam (31%) and most of the topsoils neutral to alkaline in pH. Canola was the most common preceding crop, followed by cereal and then pulse crops. Several long fallows were included in the dataset, primarily due to inclusion of the long-term rotational experiments. Inputs of N fertiliser ranged widely; from no fertiliser after a drought, up to a maximum of 137kg N/ha, in the medium-rainfall zone in 2013. Generally, inputs of N fertiliser were below 20kg N/ha, as many of the samples were collected from areas which did not receive top-dressed N. We acknowledge that this is not necessarily representative of N fertiliser management on most farms.
During the study period, GSR ranged from 121mm in the medium-rainfall zone in 2015, up to a maximum of 633mm in the high-rainfall zone in 2016. In 2014 and 2015, GSR was below the long-term average in the low- and medium-rainfall zones. Conversely, in 2016, GSR was above average throughout the study area and caused temporal waterlogging in the high-rainfall zone and at some sites in the medium-rainfall zone.
Soil organic C concentrations ranged from 3mg/g up to 53mg/g with levels decreasing as long-term average rainfall decreased. Soil total N also decreased with reduced annual rainfall with level ranging from 0.2mg/g up to 5.1mg/g. Nitrate levels in the soil profile (0-1.2m) at sowing ranged from 14 to 370kg N/ha. At most sites, soil nitrate levels at harvest were less than half the amount available pre-sowing. Above-ground crop N ranged from 15kg N/ha to 215kg N/ha. Generally, crop N uptake increased with increasing rainfall; varying between the rainfall zones and seasons.
Estimates of in-crop N mineralisation in current cropping systems
Net ICM values were highly variable, differing between sites, seasons and rainfall zones (Figure 1). The median positive net ICM value was 33kg N/ha, while the maximum mineralisation value was 116kg N/ha. These values are within the range of similar recent studies from south-eastern Australia (Xu et al. 1996; Officer et al. 2009; Sadras and Baldock 2003; Dunsford et al. 2015). Net ICM tended to increase with increasing GSR (R = 0.46, P<0.001), soil organic C (SOC) (R = 0.41, P<0.001) and total N (R = 0.32, P<0.001), which can be expected as rainfall and SOC are major factors influencing microbial activity and biological processes involved in nutrient mineralisation in most rain-fed cropping regions of southern Australia (Gupta et al. 2011).
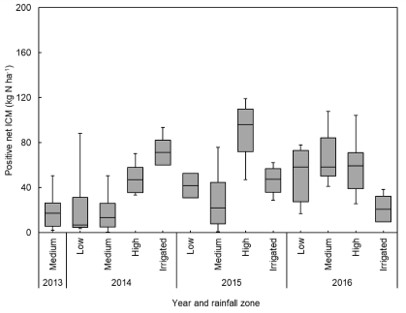
Figure 1. Box and whisker plot for positive net ICM for the low (<400mm), medium (400-550mm), high (>550mm) rainfall and irrigated sites between 2013 and 2016.
Importance of in-crop N and pre-sowing mineralisation
Figure 2 presents the proportion of crop N uptake, which could potentially be supplied by net ICM and pre-sowing N mineralisation (calculated as net ICM or pre-sowing soil N divided by crop N, presented as a percentage). Results showed that net N mineralisation occurring between growing seasons (over the summer fallow) and in-crop had the capacity to provide a significant proportion of crop N demand (Figure 2), but results were highly variable. A recent study by Wallace et al. (2020), using 15N-labelled fertiliser, has confirmed that most crop N uptake is supplied from organic sources in soil, despite the application of N fertiliser. In some cases, the quantity of N present from mineralisation, both during the fallow and in-season (net ICM), exceeded that contained in the crop at harvest, indicating that significant amounts of mineral N remained unused by the crop in the soil at maturity. Where the potential supply of soil mineral N exceeded crop N uptake, it was assumed that poor seasonal rainfall reduced plant growth and therefore limited demand for soil N. However, it is also possible that the crop was not actively accumulating N (e.g. N was mineralised during crop senescence) or this N was positionally unavailable to the plant (i.e. roots were not in close proximity to the N source).
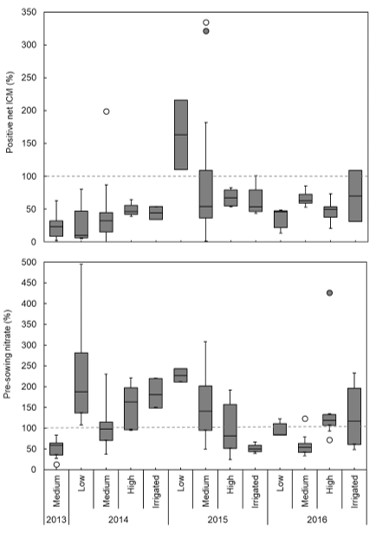
Figure 2. Box and whisker plot showing the proportion (%) of crop nitrogen (N) potentially supplied by net in-crop N mineralisation (net ICM) and pre-sowing profile nitrate, for the low (<400mm), medium (400-550mm), high (>550mm) rainfall and irrigated sites between 2013 and 2016. The proportion was calculated by dividing net ICM or pre-sowing profile nitrate by crop N uptake (above- and below-ground) and multiplying by 100. Only positive net ICM values were used. The horizontal grey dashed line indicates 100% of crop N. Outliers, >1.5 times the interquartile range, are represented by closed circles and values >3 times the interquartile range are shown as open circles.
Benefits and limitations of the methodology
The main advantage of the field-based estimate net ICM (Armstrong et al 1999) used in this study is that it uses samples (i.e. profile soil samples and crop N uptake) which are commonly measured in field studies, so a wide range of sites could be included with minimal additional cost or labour. This methodology does have limitations; there is an assumption that over the course of the season the amount of N mineralised will exceed the amount of immobilised N. For a portion of the dataset (approximately 30%, data not presented), however this assumption was not supported and negative net ICM values were obtained (median -17kg N/ha, max -116kg N/ha). Negative net ICM values may reflect net immobilisation of soil N or N loss from the system, via a range of mechanisms including leaching, horizontal movement, denitrification or volatilisation of fertiliser N. Losses of N via these pathways can be significant and failure to account for loss pathways may limit the usefulness of this method, particularly in environments where N losses via these mechanisms are likely. Further adjustment to the method may be necessary.
Methods of prediction
The soil testing methods (anaerobic incubation, hot KCl and SLAN) all showed significant correlation with net ICM (Table 1). Correlations tended to be stronger when predictions from the 10-20cm layers were included. Correlations between net ICM and the hot-KCl extraction or SLAN method were often stronger than the standard anaerobic incubation method, most likely because anaerobic incubations are sensitive to variation in experimental conditions (Ros et al. 2011). Both the hot-KCL extraction and SLAN method are rapid methods (approximately 24hours) and well suited to batch analysis in a commercial laboratory, but there is a lack of research into their utility under Australian conditions; both methods require further investigation over a wider range of seasons and soils, before they could be used to aid in N budgeting in Australian cropping systems.
The MIR model was developed using data from the anaerobic incubations and was able to accurately predict gross anaerobic NH4 + (R2 = 0.93, data not presented). MIR offers a non-destructive way of predicting a range of soil characteristics and portable MIR units are already being tested under field conditions (Soriano-Disla et al. 2014). The dataset collected for this study however was not large enough to fully test the model; collection of a more extensive dataset is required.
The Ridge method has previously been used because of its simplicity. Results showed significant correlation between the Ridge method and net ICM, however the correlation was no better than using GSR or SOC alone.
Table 1. Correlation coefficients (r) of the relationships between net in-crop nitrogen mineralisation (net ICM) against growing season rainfall (GSR: April to October) and methods of predicting ICM, including soil tests and a simple calculator. The Ridge method is calculated as 0.15 × SOC (%) × GSR. Values are presented as r with significance indicated by *** P<0.001, ** P<0.01, and * P<0.05. SLAN, Solvita Labile Amino N
Method | Soil depth (cm) | Net positive ICM data | ||
|---|---|---|---|---|
n | R | Significance | ||
GSR (mm) | n.a1 | 108 | 0.47 | *** |
Soil organic carbon (SOC) (%) | 0-10 | 108 | 0.41 | *** |
Total N (mg/g) | 0-10 | 108 | 0.32 | *** |
Pre-sowing profile nitrate (kg N/ha) | 0-120 | 108 | 0.28 | ** |
Ridge Method (kg N/ha) | 0-10 | 108 | 0.46 | *** |
R1 Gross NH4+ (kg/ha) | 0-10 | 108 | 0.24 | * |
0-20 | 108 | 0.32 | *** | |
R1 Net NH4+ (kg/ha) | 0-10 | 108 | 0.21 | * |
0-20 | 108 | 0.29 | ** | |
R2 Gross NH4+ (kg/ha) | 0-10 | 78 | 0.37 | *** |
0-20 | 78 | 0.38 | **** | |
R2 Net NH4+ (kg/ha) | 0-10 | 78 | 0.35 | ** |
0-20 | 78 | 0.35 | ** | |
Hot KCl Gross NH4+ (kg/ha) | 0-10 | 78 | 0.40 | *** |
0-20 | 78 | 0.41 | *** | |
Hot KCl Net NH4+ (kg/ha) | 0-10 | 78 | 0.39 | *** |
0-20 | 78 | 0.39 | *** | |
SLAN gross NH3 (kg/ha)2 | 0-10 | 53 | 0.32 | * |
0-20 | 53 | 0.34 | * | |
1n.a, not applicable; 2Stronger correlations (r = 0.8, P <0.001) were observed using only data from 2015
Conclusions
- Net ICM can potentially supply a significant proportion of the N demand of cereal crops in Victoria, but values are highly variable, highlighting the challenge faced by advisors and growers when accounting for N mineralisation (both in-crop and between seasons) in N budgets.
- There was a strong relationship between growing season rainfall and net ICM, more accurate seasonal rainfall forecasting would add significant value in predicting net ICM as well as crop demand.
- The field-based estimate of net ICM used in this study is simple and cheaper than other methods but has limitations and may not be suitable for all environments.
- This study identified several methods (hot KCl, SLAN and MIR) which may offer a timely and effective means of predicting net ICM. Samples for this assessment of potential in-crop N mineralisation can be obtained from the same soil samples used to assess pre-sowing mineral N (viz. deep N testing is widely recommended as best management practice), thus minimising the need to undertake two times of soil sampling. These analysis methods however require further testing before they can be recommended for wider adoption.
- The Ridge model may still offer a valuable means of predicting net ICM, but correlations were not significantly stronger than for GSR or SOC alone.
- Inclusion of soil sampled from 10-20cm improved correlations with net ICM, so it may be necessary to sample soils beyond the top 10cm.
Acknowledgements
The research undertaken as part of this project is made possible by the significant contributions of growers through both trial cooperation and the support of the GRDC, the authors would like to thank them for their continued support.
We gratefully acknowledge funding by the project AOTGR2 - 0073 'Reducing on-farm N2O emissions through improved nitrogen use efficiency in grains'. Additional samples were obtained from the ‘Filling the Yield Gap’ project (CSA00055: Closing the gap); which was co-funded by Agriculture Victoria and GRDC. We thank La Trobe University and Agriculture Victoria for the provision of K Dunsford’s PhD scholarship and operating funds by GRDC.
We acknowledge the contribution of staff from Agriculture Victoria; Roger Perris and Michael Brady, for their management of the Agriculture Victoria long-term experiments, as well as Mel Munn, Lee Warren, Susan Robson, George Croatto and Matt Kitching for their technical assistance and Fiona Robertson for additional soil data.
Useful resources
Full paper by Katherine Dunsford on this topic
References
Angus, J.F. (2001) Nitrogen supply and demand in Australian agriculture. Australian Journal of Experimental Agriculture 41, 277-288.
Angus, J.F., van Herwaarden, A.F., Heenan, D.P., Fischer, R.A. and Howe, G.N. (1998) The source of mineral nitrogen for cereals in south-eastern Australia. Australian Journal of Agricultural Research 49, 511-522.
Armstrong, R.D., McCosker, K., Walsh, K., Millar, G., Kuskopf, B., Probert, M.E., Johnson, S. and Standley, J. (1999) Legume and opportunity cropping systems in central Queensland. 2. Effect of legumes on following crops. Australian Journal of Agricultural Research 50, 925-936.
Bell, M., Collins, M., Barton, L., Hoyle, F., Schalan, C., Armstrong, R., Burke, K., Schwenke, G., Beange, L., Cameron, J., Lester, D., Weir, D. and Grace, P. (2016) Organic matter and nutirent availability in Australian grains soils - a focus on supply and loss of nitrogen and sulphur and implications for industry fertiliser strategies. (GRDC: Canberra).
Dunsford, K., Armstrong, R.D., Tang, C. and Sale, P. (2015) Estimating in-crop nitrogen mineralisation in dryland cropping systems of southern Australia. In ‘Proceedings of the 16th Australian Agronomy Conference’. (Hobart, Tasmania).
Gupta, V.V.S.R., Rovira, A.D. and Roget, D.K. (2011) Principles and management of soil biological factors for sustainable rainfed farming systems. In ‘Rainfed farming systems’. (Eds P. Tow, I. Cooper, I. Partridge, C. Birch) pp. 149-184. (Springer Netherlands, Dordrecht)
Hochman, Z. and Horan, H. (2018) Causes of wheat yield gaps and opportunities to advance the water-limited yield frontier in Australia. Field Crops Research 228, 20-30.
Officer, S.J., Dunbabin, V.M., Armstrong, R.D., Norton, R.M. and Kearney, G.A. (2009) Wheat roots proliferate in response to nitrogen and phosphorus fertilisers in Sodosol and Vertosol soils of south-eastern Australia. Soil Research 47, 91-102.
Peoples, M.B., Swan, A.D., Goward, L., Kirkegaard, J.A., Hunt, J.R., Li, G.D., Schwenke, G.D., Herridge, D.F., Moodie, M., Wilhelm, N., Potter, T., Denton, M.D., Browne, C., Phillips, L.A. and Khan, D.F. (2017) Soil mineral nitrogen benefits derived from legumes and comparisons of the apparent recovery of legume or fertiliser nitrogen by wheat. Soil Research 55, 600-615.
Ros, G.H., Temminghoff, E.J.M. and Hoffland, E. (2011) Nitrogen mineralization: a review and meta-analysis of the predictive value of soil tests. European Journal of Soil Science 62, 162-173.
Sadras, V.O. and Baldock, J.A. (2003) Influence of size of rainfall events on water-driven processes. II. Soil nitrogen mineralisation in a semi-arid environment. Australian Journal of Agricultural Research 54, 353-361.
Soriano-Disla, J.M., Janik, L.J., Viscarra Rossel, R.A., Macdonald, L.M. and McLaughlin, M.J. (2014) The performance of visible, near-, and mid-infrared reflectance spectroscopy for prediction of soil physical, chemical, and biological properties. Applied Spectroscopy Reviews 49, 139-186.
van Herwaarden, A.F., Angus, J.F., Richards, R.A., Farquhar, G.D. and Howe, G.N. (1998) 'Haying-off', the negative grain yield response of dryland wheat to nitrogen fertiliser I. Biomass, grain yield, and water use. Australian Journal of Agricultural Research 49, 1067-1081.
Wallace, A.J., Armstrong, R.D., Grace, P.R., Scheer, C. and Partington, D.L. (2020) Nitrogen use efficiency of 15N urea applied to wheat based on fertiliser timing and use of inhibitors. Nutrient Cycling in Agroecosystems 116, 41-56.
Xu, Z., Ladd, J. and Elliott, D. (1996) Soil nitrogen availability in the cereal zone of South Australia .1. Soil organic carbon, total nitrogen, and nitrogen mineralisation rates. Soil Research 34, 937-948.
Contact details
Katherine Dunsford
110 Natimuk Road, Horsham VIC 3400
03 4344 3122
katherine.dunsford@agriculture.vic.gov.au
GRDC Project Code: DAN00168,