Mapping soil properties and their impact on yield - combining Dual EM, gamma radiometrics, elevation and soil colour to select sampling sites to predict soil properties and investigate their impact on yield across the paddock
Mapping soil properties and their impact on yield - combining Dual EM, gamma radiometrics, elevation and soil colour to select sampling sites to predict soil properties and investigate their impact on yield across the paddock
Author: Edward Jones (The University of Sydney), Pat Hulme (Sustainable Soils Management, Warren), Brendan Malone (The University of Sydney), Patrick Filippi (The University of Sydney) and Alex McBratney (The University of Sydney) | Date: 25 Feb 2020
Take home messages
- Although EM surveys are a cost-effective tool to map variation in topsoil and subsoil properties, they do not show which soil properties are causing the variation
- Digital soil mapping can create maps of soil properties that can be used to investigate spatial patterns of yield limiting factors at a resolution as fine as a few hectares in a few thousand hectares
- Experience has shown that only some yield-limiting soil factors can be changed, we believe there is value in understanding whether yield is limited by underlying soil properties or by management
- At this stage soil samples are required to map soil properties.
Glossary
Covariates in digital soil mapping are the spatial properties that are used to predict the pattern of soil properties between the points where the soil is sampled. Covariates include EM survey, soil colour, digital elevation model.
Kriging is a statistical technique used to create surfaces from point data using the variation in the data set to estimate how much to smooth the fitted surface.
Multivariate linear regression is a linear equation in which multiple factors are used to predict a soil property. A general equation is: prediction= a +b*covariate1 +c*covariate2+…..
Machine learning builds mathematical models without specific instructions.
Proximal sensing is the collection of soil data using instruments that are close to the soil, but do not rely on soil contact, as opposed to remote sensing where the sensors are metres to kilometres from the site.
Regression kriging predicts soil properties using regression and kriging the difference between measured and predicted values. A general equation is: prediction = trend predicted using regression + residual predicted using kriging.
Surface refers to the spatial pattern of a particular variate across an area. E.g. a map of the depth at which the critical value of 10% exchangeable sodium (ESP) was reached.
Introduction
There have been many improvements in the availability of data and in the statistical techniques used to generate digital soil maps over the past 20 years (Minasny and McBratney, 2015). The data improvements have included relatively widespread availability of measures of landscape variation, such as satellite images and digital elevation models, and on farm measures of variation in the form of electromagnetic induction (EM) and yield variation from yield maps. The statistical techniques have progressed from multivariate linear regression through regression kriging (Odeh et al., 1995) and machine learning with kriging of residuals. These models can be used to make 3d predictions of soil properties. To date, digital soil maps have been produced predominantly by researchers and government agencies (Minasny and McBratney, 2015).
The agronomic value of maps of predicted soil properties can be tested by evaluating the correlation between these predictions and crop yield. The project we conducted was essentially an evaluation of the process of combining covariate data with measured soil properties to create digital maps of soil properties and then evaluating the correlation between the predicted soil properties and crop yield.
Methods
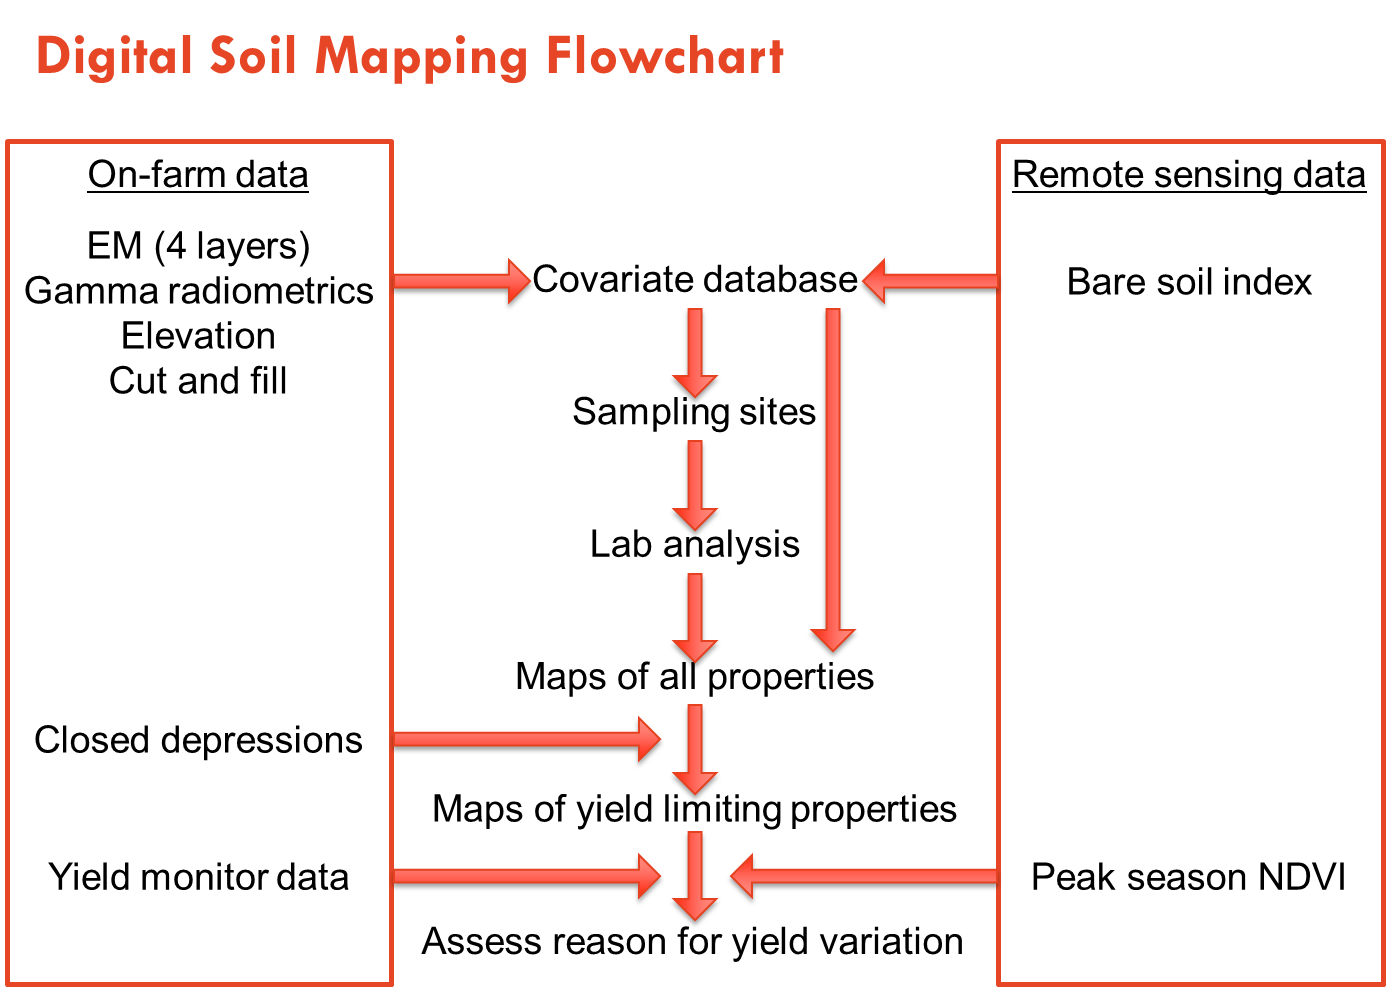
The project was conducted on an approximately 2,000 ha irrigation development on Cubbie Station, a large cotton farm in south western Queensland. The data used were a proximal sensing survey of electromagnetic induction, gamma radiometric and elevation; records of cut and fill, and a bare soil redness index from the Landsat 5 satellite. This data was combined to create a covariate database, and then used to direct the sampling of 70 soil cores at four depths (0-30, 30-60, 60-100, 100-140 cm) which were analysed in the laboratory for pH (1:5 CaCl2), exchangeable cations, EC and texture (sand, silt, clay). Relationships between the laboratory measured properties and the covariate dataset were investigated and used to create continuous surfaces of each property at the four depths across the study area (Figure 1).
 Figure 1. Process used to assess soil reasons for yield variation using digital soil mapping
The potential effect of soil properties on crop growth was assessed by surfaces of the depth to selected critical values. The critical values used were; ESP of 10%; electrical conductivity of saturated extract (ECe) of 10 dS/m; and pHCaCl2 of 8. Correlations between modelled soil properties and cotton lint yield for the 2016- 17 growing season and satellite borne vegetation indices for five years in total were investigated.
Results and discussion
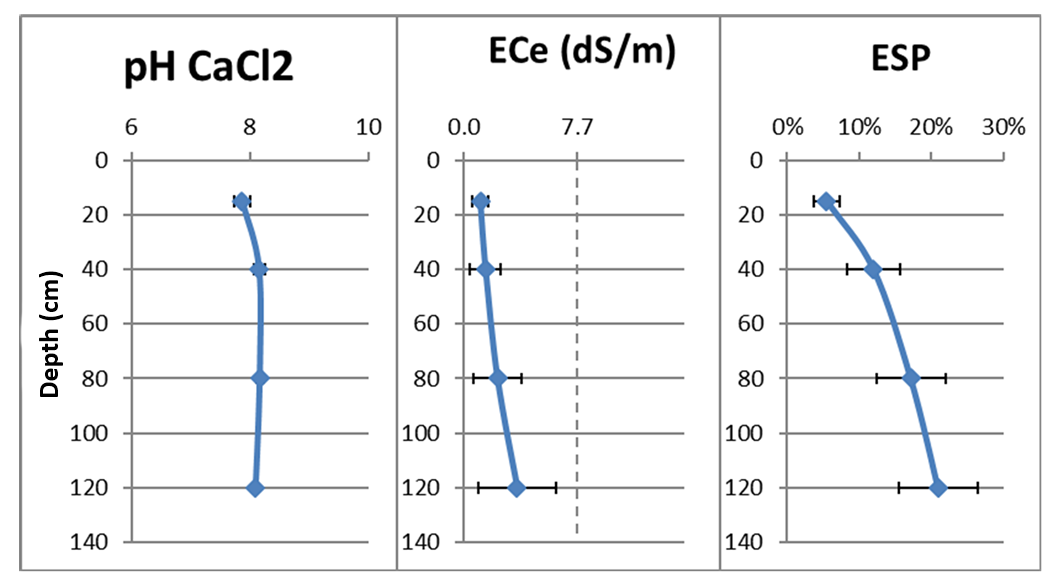
We will describe patterns of 3 of the 9 soil properties that we mapped. These are pH, salinity measured as ECe and sodicity measured as exchangeable sodium percentage (ESP) selected on the basis that there is a body of knowledge indicating a reasonably direct effect of these properties on plant growth. Soil pH was very consistent across the 70 sites assessed (Figure 2). This indicates that soil maps are unlikely to show a spatial effect of pH on crop growth and yield. Salinity measured as ECe was low and uniform in the surface to 30 cm layer and increased and became more variable with depth. This pattern indicates that there may be variation in soil properties that affects plant growth and yield. Average ESP doubled between the 0 to 30 and 30 to 60 cm layer and increased a further 50% to the 60 to 100 cm layer. The coefficient of variation (standard deviation divided by mean) decreased from 33% in the surface to 30 cm layer, to 26% in the 100 to 140 cm layer. The rapid increase in ESP with depth and moderately large variation indicates that there it is a likely contributor to crop yield variability.
 Figure 2. pH (CaCl2), ECe (dS/m) and ESP (%) average and standard deviation of 3 selected properties at 4 depths in 70 sites across more than 2,000 ha of Cubbie Station.
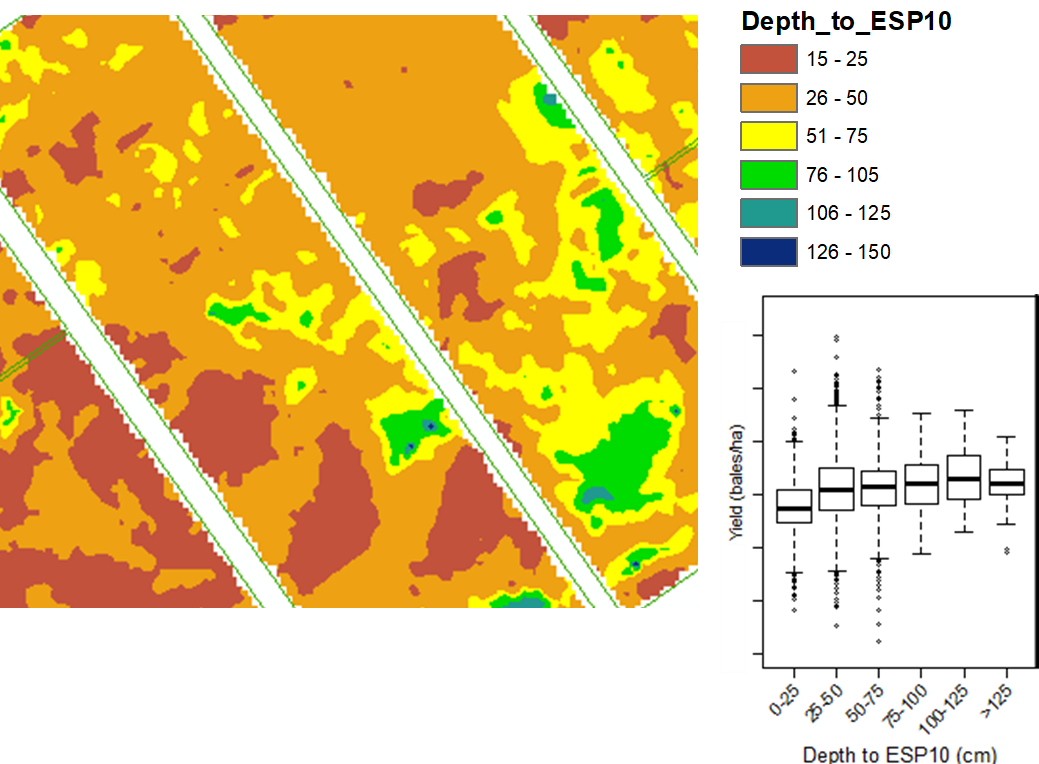
The depth to critical soil chemistry values found that the average depth to ECe of 10 dS/m was greater than 140 cm, while the average depth to ESP of 10% was shallower than 50 cm. There was substantial variation over relatively short distances in the depth to critical ESP (Figure 3). A local correlation was used to quantify the relationship between the variation in depth to ESP and yield. In summary, the boxplot in Figure 3 indicates that there was a substantial yield difference between areas where the depth to 10% ESP was shallower than 25 cm and all other depths. This is encouraging in that it indicates that there is potential to increase yield by lowering ESP of the surface 15 cm rather than the whole profile.
 Figure 3. Surface of depth to 10% ESP and boxplot of the correlation between depth to ESP and cotton yield
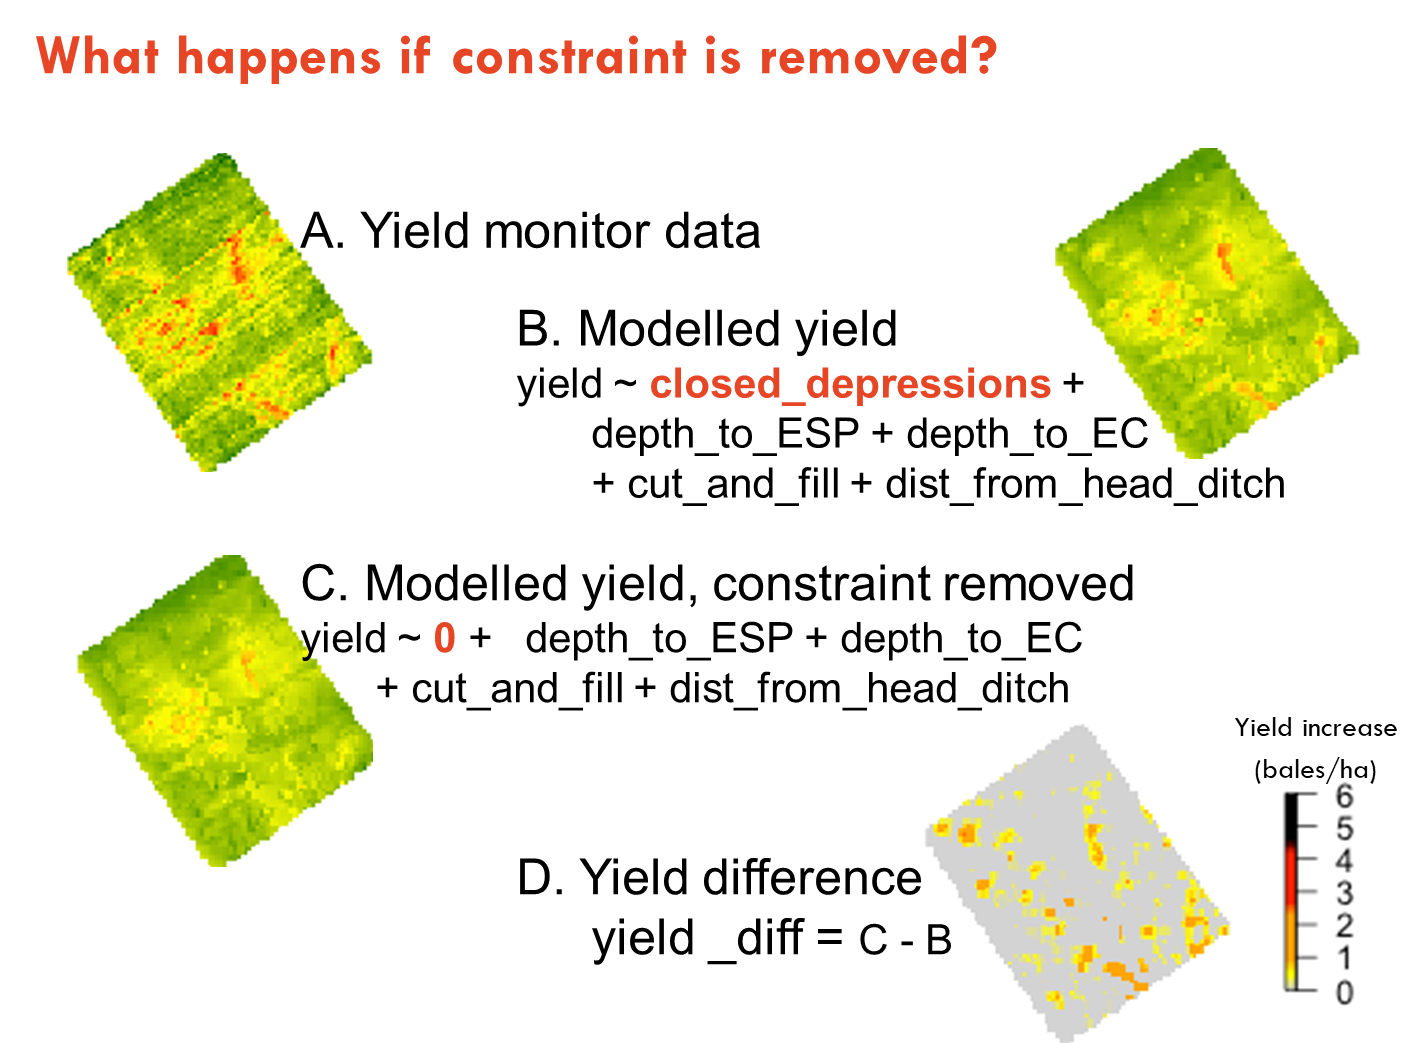
The correlation between mapped soil properties and crop yield was investigated further by using machine learning to predict the yield of each 20 m by 20 m pixel across the area mapped as dependent on the depth to ESP >10%, depth of ECe >10 dS/m, depth of closed depressions, depth of cut and fill and distance from head ditch. By artificially removing one constraint from the regression we obtained an indication of the yield difference attributed to each constraint. This is demonstrated for closed depressions in Figure 4.
 Figure 4. Conceptual model of process to quantify the potential yield benefit of removing yield constraint of closed depressions.
Conclusions
- This project demonstrates that while digital soil maps are not an end in themselves, they can be used in association with yield maps to quantify the yield cost of soil constraints.
- Variation in soil properties can affect yield if there is substantial variation in the property, and substantial areas with values that are both lower and higher than the critical value. This occurred most notably with ESP at this site, while the variation in pH CaCl2 and ECe had a smaller impact on yield variability.
- The relationships between covariates and soil properties appear not to be universal, so soil samples are currently required for each survey project, and the covariates vary between sites in their efficacy at predicting soil properties.
References
Minasny, B. and McBratney, AB (2016). Digital soil mapping: A brief history and some lessons. Geoderma, 264, 301-311.
Odeh, IO, McBratney, AB, and Chittleborough, DJ (1995). Further results on prediction of soil properties from terrain attributes: heterotopic cokriging and regression-kriging. Geoderma, 67(3-4), 215-226.
Acknowledgements
The project was undertaken with financial support, encouragement and assistance from Cubbie Agriculture.
Support was also provided by the Sydney Institute of Agriculture & Precision Agriculture Laboratory at The University of Sydney
The research undertaken as part of this project is made possible by the significant contributions of growers through both trial cooperation and the support of the GRDC, the author would like to thank them for their continued support.
Contact details
Edward Jones
Sydney Institute of Agriculture & Precision Agriculture Laboratory, The University of Sydney
Level 1, 1 Central Ave, Eveleigh, NSW, 2015
Ph: 02 8627 1109
Email: edward.jones@sydney.edu.au
