Potassium and sulphur - emerging deficiencies in the southern region
Potassium and sulphur - emerging deficiencies in the southern region
Author: Rob Norton (Norton Agronomic Pty Ltd and The University of Melbourne). | Date: 11 Feb 2020
Take home messages
- Potassium (K) deficiency is likely on acid sands where hay cutting has occurred.
- Soil test critical values for K are likely higher than the current published crop values, and more likely reflect the pasture critical values.
- Sulphur (S) deficiency is likely on lighter low organic matter (OM) soils after a wet summer.
- Deeper soil tests (30 to 50cm) are appropriate to assess S supply.
Background
In some ways it is unusual to discuss K and S together as they are quite opposites in terms of their soil and plant chemistry. Even so, there are some important aspects to consider about the nature of these two essential plant macronutrients that are removed in quite large amounts in grain and hay (Table 1). Unlike in Western Australia (WA), deficiencies of K and S are not currently common within the southern region, and relatively little research has been conducted in this part of the country. But it is important to have these nutrients on your agronomic checklist as deficiencies can occur in particular situations and these appear to be increasing.
Table 1. Approximate removal rates for nitrogen (N), phosphorus (P), potassium (K) and sulphur (S) (Source: International Plant Nutrition Institute (IPNI)).
Crop | Yield target | Removal in product (kg/ha) | |||
|---|---|---|---|---|---|
N | P | K | S | ||
Wheat | 3.5 | 75 | 12. | 14 | 5 |
Field pea | 2.5 | 93 | 10 | 21 | 5 |
Canola | 2.5 | 100 | 16 | 23 | 12 |
Wheat (hay) | 4.0 | 80 | 8 | 48 | 6 |
Canola (hay) | 4.0 | 120 | 12 | 100 | 32 |
Lucerne (hay) | 5.0 | 173 | 14 | 100 | 16 |
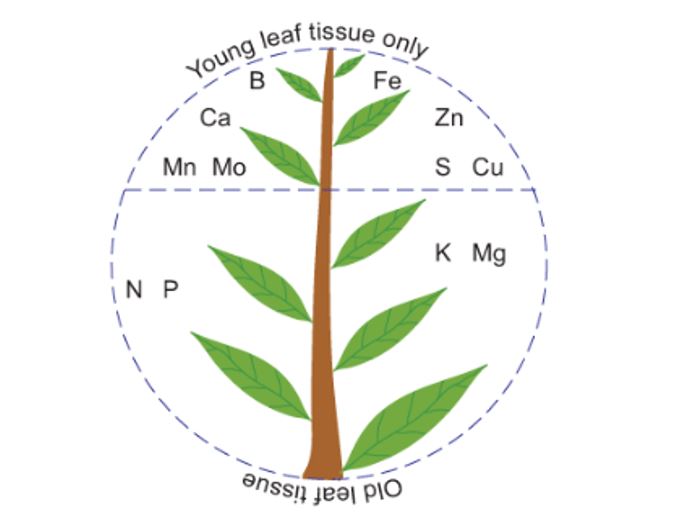
Figure 1. Typical location of mineral deficiency symptoms.
Potassium (K)
K in plants
K is highly mobile in plants and is involved in many essential functions. It serves to regulate water pressure in plant cells, affecting cell extension, gas exchange, and movement of leaves in response to light. K can activate enzymes, assist with protein synthesis, pH regulation, improved carbon dioxide fixation during photosynthesis. It also assists with transport around the plant.
Plants that are supplied with adequate K are also better equipped to withstand stress caused by pests, diseases, and some abiotic stresses compared with plants with a low supply of K.
The amount of K removed from the soil varies greatly among crop species. Table 1 shows the amount of K that it taken up by different crop species and how much is removed from the paddock when the crop is harvested. It shows the difference in K uptake between crops with high demand, such as lucerne, and crops that require less K, such as wheat. It also illustrates that removing crops like lucerne hay or corn silage leaves very little K to be recycled back into the soil, compared to crops where only the grain is removed.
K in soils
Soils are often high in total K, but most of it is unavailable for plant uptake. There are four K pools in any given soil from which the plant can access K. The four pools of K are:
- Structural K is immobile and tightly fixed. Small amounts of K are gradually released as minerals (micas and feldspar) weather over long periods of time.
- Fixed K slowly becomes available (or fixed) over a growing season. K is fixed between layers in clay minerals like illite, vermiculite and smectite, and can be released if the conditions are favourable.
- Exchangeable K is held on the surface of clay minerals and OM by its negative charge and is readily available to the soil solution and plants.
- Solution K is dissolved in the soil solution and available for plant uptake. This is the smallest pool and continually needs to be replenished by the other three pools.
As a cation with positive charge, K is relatively immobile in soil and does not move unless a root comes in direct contact, or it is mobilised into the soil solution. There are three methods by which K comes in contact with the root in order to be absorbed; root interception, mass flow as water moves in the soil and diffusion. Of these, diffusion is the mechanism that moves most of the K in the soil solution. When the root takes up the K in solution in its vicinity, it creates a diffusion gradient that draws other K particles towards the root.
K deficiency
Most agricultural soils in Australia contain sufficient K levels, but deficiencies have been reported in all states and are especially prevalent in areas that receive high rainfall in addition to sandy soils.
Because K is highly mobile within plant tissue deficiency symptoms are generally visible on the older leaves first. Deficiency symptoms include scorching or burning along the leaf margins, and generally poor growth resulting in smaller root systems, small leaves, weak stems (inducing lodging in mature plants) and small and shrivelled grain.
Deficiency may be seen as poor crop growth between windrows or header tracks the previous year. K from the residue of the previous crop is concentrated in rows, resulting in better crop growth in those areas. K is often taken up from deeper in the soil profile as the crop grows, can be leached from the tissue and deposited on the soil surface when the crop is cut and left to dry. This process increases K in the soil surface and the difference between and within windrows is a good ‘diagnostic’ for low soil K.
If a K deficiency is suspected, soil testing is a useful tool to identify the need to apply additional K to the paddock. A soil test that measures 10-30cm as well as the top 10cm may be useful, as a surface test may not reflect K concentrations at depth. The top 10cm may indicate a concentrated supply of K in the soil, but at depth it may be deficient and additional management options may be required to avoid K deficiency. In addition the K concentrated in the surface soil may be less available to the plant as the soil dries.
Soil tests such as Colwell K and ammonium acetate extractions can accurately predict plant available and exchangeable K in low fixing soils. Other tests, such as a nitric acid or sodium tetra-phenyl-borate extraction, are more accurate when it comes to soils with a higher content of multilayer clay minerals. These tests also measure the rate at which K will be released from the fixed pool. Testing for the amount of total or structural K is of little use due to its slow release rate.
The current recommendations on critical soil test (Colwell) K values were largely derived from data generated in WA where deficiency is more common, and are around 40mg/kg for wheat on Tenosols and Chromosols. The most recent work with high yielding crops in southern Victoria suggests that the critical values are more like the pasture critical values of around 120mg/kg.
Fertilising soils with K
Potassium minerals are extracted from geologic sources located throughout the world. Impurities are removed from the ore and the remaining K is transformed into a variety of modern fertilisers.
- Right source - the most commonly used K fertiliser source is potassium chloride (KCl), also referred to as muriate of potash (Table 2). Chloride-free sources of K fertiliser are sometimes preferred for applications to chloride-sensitive horticultural crops, but this is not an issue for broad-acre crops. Compound K fertilisers containing chloride, S and/or magnesium may be warranted when soil supplies of these other nutrients are limiting.
- Right rate - recommended rates of K application are based on both soil testing and crop removal. ‘Maintenance rates’ are those equal to the quantities of K removed and are used to maintain soil fertility. Cereal crops require less K than pastures or hay crops.
- Right time - in cropping systems, K fertiliser is usually applied at or before seeding. On soils that are sandy and/or have a low capacity to retain K and in high rainfall situations, two or three applications of K fertiliser may be beneficial.
- Right place - K sources vary widely in their effect on the soil solution (salt index) and toxicity may occur if Muriate of Potash is drilled with the seed. K fertiliser sources with a lower salt index may be necessary at higher rates when placed near or in direct contact with seed. Subsurface bands of K can provide benefits over broadcast applications when subsoil fertility is low and where topsoils dry out during the growing season. Topdressing K is also effective on sandy soils in medium to high rainfall environments.
Crop responses to K
The greatest crop responses to K application in Australia have been seen in sandy soils. Maize is the most responsive crop followed by canola, pulses, wheat and then lupins are least responsive. Figure 2 gives some results for wheat responses to K rate, timing and placement in South Australia.
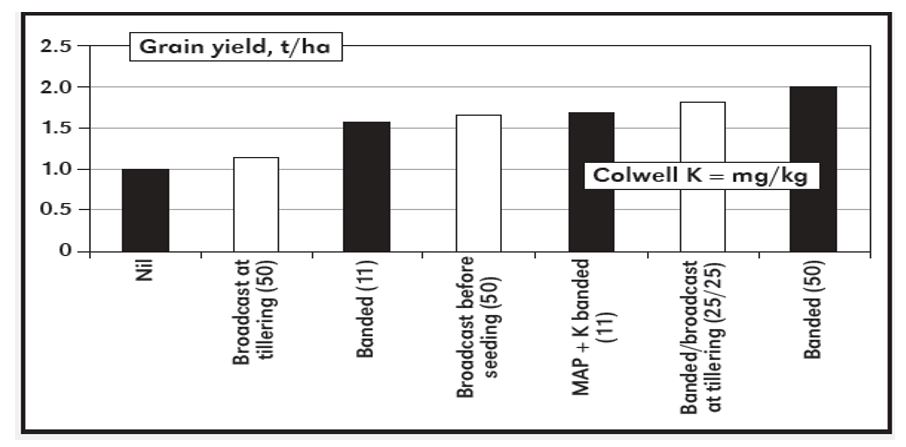
Figure 2. Response of wheat to K applied at different rates (in brackets, K kg/ha), timing and placement (Wilhelm and White, 2004).
Sulphur (S)
S in plants
Soluble sulphate (SO42-) is the primary source of S taken up by plants from the soil. S can sometimes be absorbed through the leaves from the air as sulphur dioxide (SO2), but this source does not play a significant role in Australian agriculture. Within the plant, S performs many functions, the most important being energy and protein production. S is a constituent of three of the 21 essential amino acids that form proteins. This function is particularly important for cereals as low grain protein correlates to low grain quality. S is also essential for nitrogen (N) fixation by legumes.
Since both S and N are needed for protein formation, these two nutrients are closely linked. Crops have varied requirements for S compared with N and have a wide N:S ratio in the harvested product (Table 1). For example, wheat and chickpea have relatively low S removal, with an N:S ratio in grain of 17:1 and 12:1 respectively. Canola however, has a much higher S removal, with a N:S ratio of 8:1 in the seed. While removal ratios do not necessarily determine the nutrient demand, canola and high-yielding forages generally have a higher demand for S than cereal crops.
S in soils
Like N, the majority of S in soil is found in OM and crop residues, and is not immediately available for plant uptake. Before S can be absorbed it needs to be converted to sulphate, which occurs as OM mineralises. Elemental sulphur (S0, either native or fertiliser) is oxidised to sulphate by common soil bacteria (e.g. Thiobaccilus species) and this process can take from weeks to months, or longer. The rate of oxidation depends on environmental conditions including soil moisture, temperature, aeration, pH, and the size of the S0 particles being broken down. Sulphate derived from OM mineralisation or S0 oxidation is soluble and readily moves with soil water to roots — or can be subject to leaching below the root zone in areas with high rainfall or with excessive irrigation.
S deficiency
Sulphur deficiency symptoms include pale green leaves and the chlorosis of young tissue. Tissue samples for youngest expanded blade/leaf provide the best diagnostic guide because S is relatively immobile in the plant. Once S has been taken up by the plant and assimilated into organic compounds, it does not move again. In canola, plants may also suffer from thin stems and leaves may develop a reddish colour, first apparent on the underside of the leaves. In canola, the flowers may also be visibly affected, and can appear pale in colour and in severe cases, almost grey.
Fertilising soils with S
There are numerous sources of S fertiliser available for use, and some containing soluble sulphate that provides immediate plant-available S. Others contain insoluble elemental S, that requires oxidation to sulphate, before the plant can access the additional nutrients. A blend of both elemental and sulphate-S can provide a balance of S supply over time, especially where leaching can be a problem. Many growers also use gypsum (calcium sulphate dehydrate) as a soil amendment, which also provides large amounts of sulphate-S for crop nutrition.
In Australia, soil tests such as the KCl-40 or MCP extraction provide guidance. However, because S is mobile, samples to 30cm depth are often a better indicator of the response to S fertiliser than 0-10cm samples. However, soil testing should not be considered alone. Decisions should be made in conjunction with visual crop assessments and plant tissue tests, and take into consideration other factors such as soil organic matter, soil texture, rainfall, and rooting pattern of the crop.
Crop response to S
Crops frequently respond rapidly to fertilisation with topdressed sulphate, especially under conditions of low S availability and low OM. Responses are generally greater in sandy soils, especially in crops with a high requirement for S, such as canola. The study reported in Table 2 shows significant increases in seed oil content in response to added S. Attention to S fertilisation is becoming more important, given reduced S emissions from industry, increased conservation tillage and higher-yielding crops taking up and removing more S from the soil, as harvested products.
Table 2. Effect of timing and rate of sulphate-S application on the yield of canola in central NSW (Hocking et al. 1996). Yield with nil S application = 1.03t/ha, and N at 80kg/ha supplied. The LSD = 0.43 (p = 0.05).
S applied t/ha | Yield t/ha | |||
|---|---|---|---|---|
Sowing | 5-6 Leaf | Buds visible | Stem elongation | |
10 | 1.73 | 1.62 | 1.56 | 1.41 |
40 | 2.15 | 2.26 | 2.11 | 2.19 |
Summary
K in soils is derived largely from the mineral fraction and is present as the cation K+ , mainly adsorbed onto the exchange complex. It does not readily leach unless the exchange sites are dominated by H+ (i.e. in acid conditions), and is often stratified in the topsoil. In the plant it does not form organic molecules and exists entirely in the ionic form. It rapidly leaches out of crop residues into the topsoil.
S in soils is most often tied up in OM and when mineralised is released as the sulphate anion (SO42-) which is mobile, and liable to leaching deeper into the soil. In the plant S is taken up as sulphate and is incorporated into a range of organic molecules such as proteins. S is largely immobile in plants, so deficiency symptoms appear in the younger leaves.
Acknowledgement
These notes were taken from the Australian and New Zealand versions of IPNI Nutrient Source Specifics, number 3 (K) and number 4 (S) written by the author. Copies of this and other IPNI materials can be obtained at: International Plant Nutrition Institute Resources - Fertilizer Australia
References and further reading
Anderson, G.C., Peverill, K.I. and Brennan, R.F. (2013) Sulfur soil test calibrations. In ‘Soil sulfur—crop response calibration relationships and criteria for field crops grown in Australia’. Crop & Pasture Science 64, 523-530.
Barber, S.A. (1985). In, ‘Potassium in agriculture’, ASA-CSSA-SSSA, Madison. IPNI. 2016. Potassium- IPNI Canada
Brennan, R.F. and Bell, M.J. (2013) Soil Potassium calibration. Crop & Pasture Science 64, 514-522.
Eds FIFA. (2006) ‘Australian Soil Fertility Manual’. (CSIRO Publishing: Melbourne).
Gourley, C.J. et al. (2019) Pasture nutrient response curves. Crop & Pasture Science 70, 1065-1079.
Hocking, P.J. et al. (1996) Australian Journal of Experimental Agriculture 36, 79-85.
Mikkelsen, R. and Norton, R. (2013) Better Crops, 97(2), 7-9.
Norton, R. Mikkelsen, R., and Jensen, T. (2013) Better Crops, 97(2), 10-12.
Pabhu, A.S. et al. (1997) In, Mineral nutrition and plant disease. American Phytopathological Society (St. Paul).
Reuter, D.J. and Robinson, J.B. (1997) ‘Plant analysis: an interpretation manual.’ (CSIRO Publishing: Melbourne).
Till, R. (2010) ‘Sulphur and Sustainable Agriculture’. Pp. 70. (International Fertiliser Industry Association: Paris)
Wilhelm, N. and White, J. (2004) Better Crops 88, 1.
Contact details
Dr Robert Norton
Norton Agronomic Pty Ltd and The University of Melbourne
0428 877 119
rnorton@unimelb.edu.au