Stubble and nutrient management to build soil carbon – challenges and opportunities
Stubble and nutrient management to build soil carbon – challenges and opportunities
Take home messages
- Preserving or enhancing soil organic matter stocks is critical to sustainable agriculture, due to its key role in soil health, plant productivity and building resilience. Stubble return with strategic nutrient inputs (‘integrated stubble-nutrient management’) has been proposed as a measure to build soil organic matter in cropped soils.
- The supply of extra nutrients along with wheat stubble enhances stocks of stable soil carbon if wheat stubble input is high (12t/ha), which is unlikely under rainfed conditions in normal seasons. At more common rates (less than or equal to 4t/ha), there may be no benefit on improving stable soil organic matter through the integrated stubble-nutrient management.
- Where stubble input is high, the addition of extra nutrients considerably enhances microbial biomass, potentially leading to build-up of stable organic matter, especially in clay soils.
Background
There is growing recognition of the benefits of soil organic matter (SOM) for maintaining productivity and carbon sequestration. Managing crop residue, such as straw residues together with input of nutrients, commonly known as ‘integrated stubble–nutrient management’, is a topic of interest to growers aiming to improve SOM, soil structure, microbial growth, and available nutrients to support crop production (Kirkby et al. 2016). SOM originates from the decay of plant materials (such as crop stubble, dead roots), animal wastes, and microbes. SOM is composed of several fractions; living microbial biomass (BIOM), readily degradable (labile) particulate organic matter (POM), and slowly degradable, humified organic matter (HOM), (Figure 1).
Cereal stubble has low concentrations of nutrients including nitrogen (N), phosphorus (P), and sulphur (S), although some nutrients may be released from existing SOM during the decay of stubble after its incorporation in the soil (Sarker et al. 2019). The addition of extra nutrients from fertilisers, along with the return of nutrient poor stubble in soil, may stimulate microbial activity and decrease nutrient mining by microorganisms while preserving existing SOM. Hence, integrated stubble–nutrient management may enhance the decay of stubble and increase microbial biomass and carbon-use efficiency (Fang et al., 2018a), with potential to convert a greater quantity of stubble-derived carbon (C) into stable SOM fractions (Kirkby et al. 2013; Kirkby et al. 2016).
Currently, there is limited understanding of the impact of combined inputs of wheat stubble and nutrients (N, P, S) and the effects of ‘normal’ and higher rates of nutrients on stubble-derived C in SOM fractions, and the consequential implications for long-term C storage in different soil types. To better predict responses of C cycling and storage following the return of crop residues to the soil, greater understanding of the role of stubble and nutrient management in SOM formation and stabilisation is needed. In agricultural soils, adoption of integrated stubble-nutrient management may enhance the conversion of labile organic matter inputs into more stabilised SOM. This process known as ‘humification’, keeps more C stored in soil with implications for economic benefits via the ‘carbon economy’ (e.g. soil carbon credits).
There is some evidence that balancing nutrient inputs to match the C-to-nutrient ratio of SOM can improve the stabilisation of stubble-C in a fine fraction pool (<0.4mm) (Kirkby et al. 2013; Kirkby et al. 2016). However, less is known about the effect of supplementary nutrients (N, P, S) on the conversion of stubble/straw into different SOM fractions with varied stabilities. As detailed in Figure 1, a C-isotope technique was applied in an eight-month laboratory study to directly quantify the partitioning of residue-C (δ13C-enriched) in physically-defined and modelling-relevant SOM fractions. To harness the benefits of returning stubble together with extra nutrients in farming systems, we need to identify;
- The nutrient supply value of wheat stubble, plus the release of additional nutrients from existing SOM after the input of stubble, which may save some fertiliser costs.
- The effectiveness of adding extra nutrients together with wheat stubble (the amounts may be low or high, depending on grain yield in different rainfall conditions) to enhance the transformation of wheat-stubble-C into stabilised humified SOM fractions.
- The effect of soil type on the incorporation of stubble-derived C into stable SOM fractions.
- The role of ‘integrated stubble-nutrient management’ in enhancing residue-C mineralisation and microbial biomass with implications for C sequestration in stable SOM fractions.
Methodology
In this study, two different soils were collected from two separate long-term, grain-based, farming system trials at Condobolin (New South Wales), and Hermitage (Queensland). A red soil (Red Chromosol) was collected at Condobolin and a cracking clay soil (Vertosol) at Hermitage (Table 1).
Table 1. Site descriptions for Condobolin (NSW) and Hermitage (QLD) for the long-term trials.
Location | Condobolin Ag research station (NSW) | Hermitage research station (QLD) |
|---|---|---|
Treatment sampled | Conventional tillage — long fallow wheat, short fallow wheat under-sown with pasture and subsequent three-year grazed pasture (annual medics and lucerne). | Conventional tillage — mainly wheat cropping phases with stubble retained and 90kg urea-N per hectare. |
Trial established | 1998 | 1968 |
Climate | Hot, semi-arid climate; non-seasonal precipitation | Subtropical; summer-dominant precipitation |
Soil | Sandy clay loam (Chromosol) | Clay (Vertosol) |
Tables 2 and 3 report relevant soil properties of the two field sites, as well as total C and nutrient contents of the wheat stubble used in this study.
Table 2. Properties of the soils at the trial sites. Values in brackets are standard errors (n=3).
pH1:5 water | Sand (%) | Clay (%) | Organic carbon (t/ha) | 13C (‰) | TotalN (t/ha) | Total P (t/ha) | Total S (t/ha) | |
|---|---|---|---|---|---|---|---|---|
Red Chromosol | 5.8 (0.2) | 61.7 (2.0) | 26.9 (0.8) | 7.1 (0.5) | –24.7 (0.1) | 0.5 (0.1) | 0.25 (0.03) | 0.11 (0.01) |
Vertosol | 7.3 (0.1) | 15.2 (1.2) | 62.6 (0.3) | 12.4 (0.2) | –19.2 (0.2) | 0.8 (0.1) | 0.63 (0.02) | 0.13 (0.02) |
Table 3. Properties of wheat stubble used in this study. Values in brackets are standard errors (n=3).
Organic carbon (kg/t) | 13C (‰) | Total N (kg/t) | Total P (kg/t) | Total S (kg/t) | |
|---|---|---|---|---|---|
Wheat residue | 435.2 (4.7) | 494.0 (2.1) | 4.0 (0.1) | 1.9 (0.1) | 0.24 (0.02) |
Soil sampling, laboratory incubation and analyses
Soil samples were collected in May 2015 from the long-term conventional tillage treatments, during the crop pre-sowing stage at both field sites. The soils were gently sieved to less than six millimetres then incubated for eight months, with or without incorporation of chopped wheat stubble residues (less than 2mm), under controlled soil moisture and temperature conditions.
Wheat stubble residues were applied at 0, 6.7 and 20.0g/kgsoil, corresponding to respective no, low (4t/ha) and high stubble loading rates (12t/ha). These stubble loading rates are typical for low and high rainfall seasons. Applications were made to a shallow depth of 5cm with a bulk density of 1.2g/cm3 (Fang et al., 2018a). A laboratory incubation experiment containing seven treatments for each soil was set up at 22°C (Table 4).
Quantities of N, P, and S additions were calculated on the assumed nutrient requirements of an additional 10 or 30% of wheat residue to become stable SOM, which was based on the commonly-observed C-to-nutrient ratio of SOM; C: N of 12:1, C: P of 50:1, and C: S of 70:1 (Kirkby et al. 2013).
Table 4.Description of the residue and nutrient (N, P and S) input treatments, and the expected additional stabilization of residue-Cin SOM. The nutrients were added by ammonium nitrate (N), monopotassium phosphate (P), and ammonium sulphate (S).
No | Treatments * | Wheat stubble | N | P | S | Fertiliser cost | Expected C stabilization 1 |
|---|---|---|---|---|---|---|---|
t/ha | kg/ha | $/ha | % | ||||
1 | Res0_0nut | 0 | 0 | 0 | 0 | 0 | 0 |
2 | Res4_0nut | 4 | 0 | 0 | 0 | 0 | 0 |
3 | Res4_Lnut | 4 | 15 | 3.6 | 2.6 | 28 | 10 |
4 | Res4_Hnut | 4 | 45 | 10.8 | 7.7 | 85 | 30 |
5 | Res12_0nut | 12 | 0 | 0 | 0 | 0 | 0 |
6 | Res12_Lnut | 12 | 45 | 10.8 | 7.7 | 85 | 10 |
7 | Res12_Hnut | 12 | 135 | 32.4 | 23.1 | 255 | 30 |
1 The low and high nutrient inputs (C, N, P and S) were based on the expectation of additional 10% or 30% of residue-C that would be converted to stable SOM (C: N of 12:1, C: P of 50:1, and C: S of 70:1).
*Abbreviations; Res0 = control soil with no residue and no nutrient inputs, Res4 = residue rate at 4t/ha, Res12 = residue rate at 12t/ha, 0nut = no nutrient input, Lnut = low nutrient input level, Hnut = high nutrient input level. Wheat stubble (4t/ha = 18,00kg C/ha; 12t/ha = 5,400kg C/ha.
The soils amended with stubble and nutrients were incubated for eight months under a controlled environment. Soil samples or soil-residue mixtures were adjusted to 60% of maximum water holding capacity and packed in containers to 1.2g/cm3 bulk density and placed in 1.2L enclosed buckets. Subsamples of soil-residue mixture and the control soils were removed at 126 and 245 days, air-dried and sieved for analyses.
To quantify the distribution of wheat residue-C (δ13C 494‰, C-content 43.5%), two-pool 13C-isotope modelling was employed (Fang et al. 2018a,b). This is expressed as a percentage of added residue-C, into total CO2, microbial biomass carbon (MBC), and various modelling-relevant SOM fractions (pools).
Soil density and particle size fractionation
A combined density and particle size fractionation of soil samples was conducted, separating SOM into labile and stable C fractions (Golchin et al. 1994; Herath et al. 2014). Figure 1 illustrates the physical fractionation to separate SOM into different C fractions, which were analysed for C% and d13C (Fang et al. 2019).
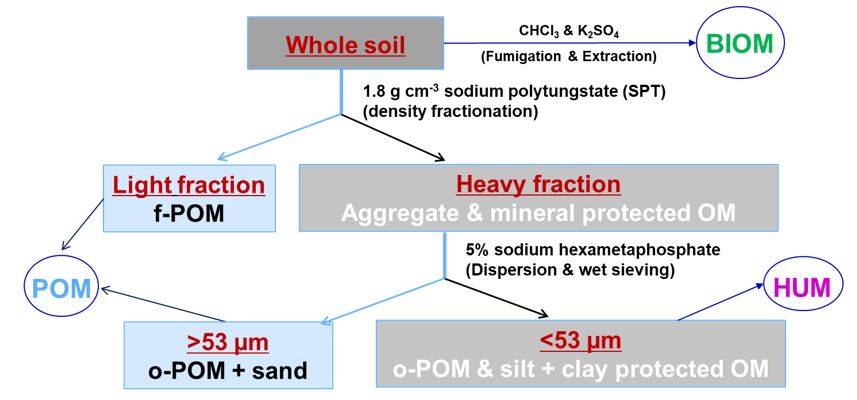
Figure 1. The density-size fractionation process used to separate five soil carbon pools; light fraction (free particulate organic matter, f-POM), heavy fraction (aggregate and mineral protected OM), >53μm fraction (occluded particulate organic matter, o-POM), and <53μm fraction (silt-clay mineral associated OM). POM = particulate organic matter, HUM = humified organic matter and BIOM = microbial biomass.
Results and discussion
Impact of stubble-nutrient management on residue and microbial carbon
Over 245 days, the total stubble residue-C mineralisation ranged from 480 to 610kg CO2-C per tonne of residue-C. This is equivalent to 48–61% of residue-C mineralised across all the stubble and nutrient treatments (Figure 2).
- At high stubble loads (12t/ha), residue-C mineralisation was different for the two soil types studied. In the Chromosol, the residue-C mineralisation was the same for both the nil and high nutrient input treatments, and greater for the low nutrient input. The Vertosol showed no difference in residue-C mineralisation between different nutrient supply levels.
- At low stubble loads (4t/ha), nutrient addition had no impact on residue-C mineralisation, and MBC in either of the two soils (Figures 2 and 3).
Nutrient inputs at the high stubble load increased MBC in both soils, except at the end of the monitoring period (day 245). Microbial biomass was significantly higher in the Vertosol than the Chromosol and decreased over time across all treatments (Figure 3). The proportions of total MBC derived from residue were higher (45–76%) in the high stubble-residue than the low-stubble residue treatments (24–54%) (data not shown; Fang et al. 2018a).
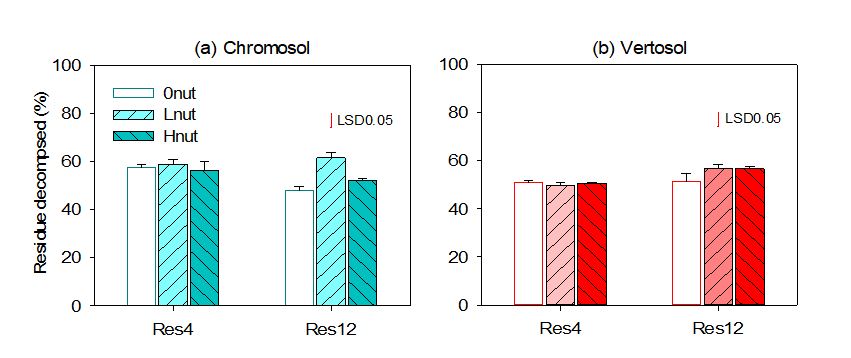
Figure 2. Residue carbon decomposed in the Chromosol (a) and Vertosol (b) over the 245-day incubation period. Error bars represent standard errors of the mean (n=4). Res4 = residue rate at 4t/ha, Res12 = residue rate at 12t/ha, 0nut = no nutrient input, Lnut = low nutrient input level, Hnut = high nutrient input level. Red lines on top of bars represent least significant differences at 5%.
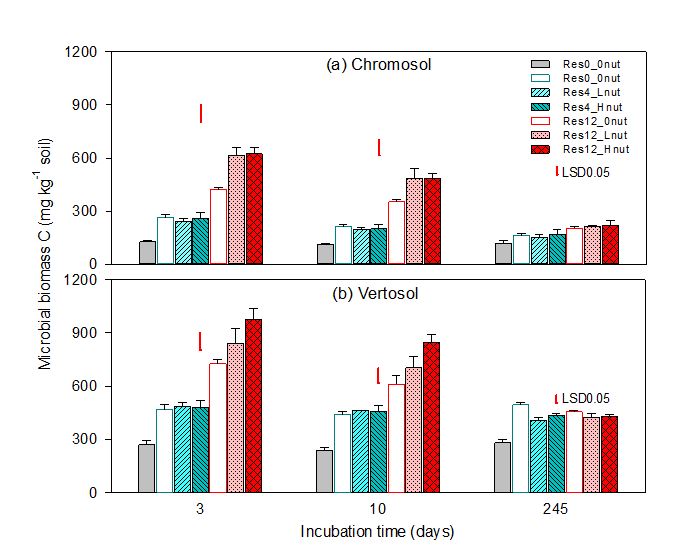
Figure 3. Microbial biomass carbon in the Chromosol (a) and Vertosol (b) after three, 10 and 245 days of incubation period. Error bars represent standard errors of the mean (n=4). Abbreviations; Res0 = control soil with no residue and no nutrient inputs, Res4 = residue rate at 4t/ha, Res12 = residue rate at 12t/ha, 0nut = no nutrient input, Lnut = low nutrient input level, Hnut = high nutrient input level. Red lines on top of bars represent LSD (least significant differences at 5% level) for the combinations of soil, residue and nutrient inputs at each time point.
The lack of effects of nutrients on residue-C mineralisation at the low stubble load rate (4t/ha) was likely due to two reasons. Firstly, considerable nutrients may be released from the stubble and SOM, (10-12t N/ha, 12-36t P/ha and 10-14t S/ha as described in Table 5), following the stimulation of microbial activity and mineralisation of residues and existing SOM after the input of stubble in the soils (Singh et al. 2017; Sarker et al. 2019). Secondly, simpler organic molecules may have expedited the release of mineral-bound SOM and dissolution of protective mineral surfaces, mobilising nutrients (P, S) beyond the input of nutrients from stubble residues (Guppy et al. 2005; Keiluweit et al. 2015; Singh et al. 2017; and Sarker et al. 2019). That is, simpler organic molecules of low-molecular-weight are produced during the decay of stubble residues in the soil. Hence, nutrients released from the residue and soil reserves were sufficient at the low stubble rate to support microbial growth and activity.
Where stubble load is high however, nutrient availability became a limiting factor for the biological degradation of the C-rich and nutrient-poor wheat residue (C: N: P: S ratio of 1850:17:8:1 as described in Table 3). The results of lower MBC without nutrient supply at the high stubble rate suggest that the potential release of nutrients from the stubble residue, SOM decomposition, and soil mineral reserves (via dissolution-desorption processes) may not be sufficient to satisfy fast microbial growth (Figure 3). However, the extra nutrient supply at the high stubble loads increased MBC (Figure 3) and enzyme activities (Fang et al. 2018b), thus enhancing stubble decay and production of microbial residues while lowering nutrient mining from existing SOM (Fang et al. 2018a,b).
Table 5. Nutrient release following wheat residue incorporation (at different rates per hectare).
kg/ha | Red soil (Chromosol) (Condobolin, New South Wales) | Cracking clay soil (Vertosol) (Hermitage, Queensland) | ||
|---|---|---|---|---|
Residue 10t/ha | Residue 4t/ha vs. 12t/ha | Residue 10t/ha | Residue 4t/ha vs. 12t/ha | |
Nitrogen | 30 | 12 vs. 36 | 25 | 10 vs. 30 |
Phosphorus | 30 | 12 vs. 36 | 90 | 36 vs. 108 |
Sulphur | 25 | 10 vs. 30 | 35 | 14 vs. 42 |
Note: for simplicity, results are averaged across different farming systems. See the detailed results in Singh et al. 2017
Enhancing availability of nutrients from soil organic matter and crop residues_ GRDC
Impact of stubble-nutrient management on distribution of stubble carbon
Results show that after 245 days, 43–54% of the stubble-C remained in SOM fractions, in both soils (Table 6). Of this, 22–41% of stubble-C was in the light fraction (f-POM) and 14–20% in the heavy fraction (o-POM plus silt-clay SOM). Further sequential separation of the heavy fraction revealed 8–15% of residue-C was distributed to silt-clay OM and 4–6% to o-POM, after 245 days. This study found that the supply of extra nutrients at only the high stubble rate (12t/ha), increased the incorporation of residue-C into the silt-clay SOM in both soils. That is, at the high stubble rate the net humification efficiency increased from 8% to 11% in the Chromosol, and from 11% to 14% in the Vertosol across both nutrient input treatments. At the low stubble rate, different nutrient inputs (compared to no nutrient treatment) had no impact on the humification efficiency of SOM, such as in the heavy fraction and silt-clay SOM.
Following the input of nutrients at both low and high rates, the enhanced incorporation of high stubble residue-C to the stable SOM fraction (silt-clay) was possibly related to the high MBC in the soils (Fang et al. 2018a) (Table 6 and Figure 2). The high MBC may have stimulated turnover and formation of microbial residues/products, with potential for their incorporation into the stable SOC fractions (Hagerty et al. 2014). Moreover, when compared with no-nutrient, the decrease of stubble-C content in the labile pool (f-POM) via the supply of extra nutrients, could be due to the accelerated breakdown of crop residues by microorganisms. This would likely lead to the higher incorporation of microbial residues in the silt-clay fraction (Fang et al. 2018a). Under the low stubble rate (4t/ha) however, there was no significant impact of adding extra nutrients in any SOM fractions (Table 6; Figure 1). There was also no evidence that SOM increased with stubble retention and additional nutrients at eight trial sites, after three and five years across south-eastern Australia, under a continuous cropping system in the low to medium rainfall zone (van Rees et al. 2017).
Table 6. The proportional distribution of added residue-carbon in soil fractions in two different soils, including light fraction (LF; f-POM), heavy fraction (HF; aggregate and mineral protected OM), occluded particulate organic matter (o-POM), silt-clay protected organic matter (silt-clay OM).
Soil type | Treatments* | f-POM (%) | HF (%) | o-POM (%) | Silt-clay SOM (%) |
|---|---|---|---|---|---|
Chromosol | Res4_0nut | 24.5 (2.5) | 17.1 (0.5) | 6.0 (0.7) | 11.4 (0.3) |
Res4_Lnut | 29.7 (1.4) | 16.1 (0.2) | 5.9 (0.7) | 12.1 (0.9) | |
Res4_Hnut | 28.6 (3.2) | 17.4 (0.6) | 5.9 (0.3) | 11.2 (0.8) | |
Res12_0nut | 40.8 (1.4) | 13.9 (0.3) | 6.1 (0.9) | 8.3 (0.3) | |
Res12_Lnut | 22.1 (2.0) | 17.1 (0.5) | 5.1 (0.8) | 11.5 (0.1) | |
Res12_Hnut | 31.2 (1.4) | 15.9 (0.8) | 5.5 (0.6) | 10.9 (0.6) | |
Vertosol | Res4_0nut | 27.0 (1.0) | 19.2 (2.1) | 4.5 (0.2) | 14.3 (1.3) |
Res4_Lnut | 31.4 (0.4) | 19.2 (1.8) | 4.7 (0.3) | 15.2 (1.7) | |
Res4_Hnut | 27.3 (0.9) | 19.0 (1.2) | 4.2 (0.6) | 15.4 (0.1) | |
Res12_0nut | 29.7 (2.8) | 16.3 (1.3) | 5.8 (0.9) | 11.1 (1.0) | |
Res12_Lnut | 25.4 (1.5) | 18.1 (1.2) | 4.6 (0.9) | 12.9 (0.3) | |
Res12_Hnut | 24.0 (1.1) | 19.5 (1.0) | 4.5 (0.4) | 13.9 (0.7) | |
LSD0.05 | 5.1 | 3.0 | 1.8 | 2.5 |
*Abbreviations: Res4 = residue rate at 4t/ha; Res12 = residue rate at 12t/ha; 0nut = no nutrient input; Lnut = low nutrient input level; Hnut = high nutrient input level. The values in the brackets are standard errors of the mean (n=3). LSD0.05 = least significant differences at 5%.
In the current study, soil type also affected the incorporation of residue-C in the heavy or silt-clay fractions. For example, 20% higher residue-C was incorporated in the silt-clay SOM in the Vertosol than Chromosol. This higher incorporation of residue-C is in agreement with previous findings that more residue-C would have been retained in reactive clay-rich soils (Jenkinson, 1977). This could be mainly attributed to greater stabilisation of microbial residues in the Vertosol than the Chromosol, because of higher residue-derived MBC (Fang et al. 2018a,b) and higher clay content (Table 1), or clay type (e.g. smectite- versus kaolinite-dominated) (Kopittke et al. 2018).
Overall, the results suggest that stubble residue-C was rapidly mineralised and utilised by microorganisms only in the high stubble treatment with high extra nutrients which aimed to actively achieve the C-to-nutrient ratio of stable SOM. The process of rapid microbial biomass growth and turnover may have facilitated the incorporation of microbial residues in the stable SOM fractions (Figure 4).
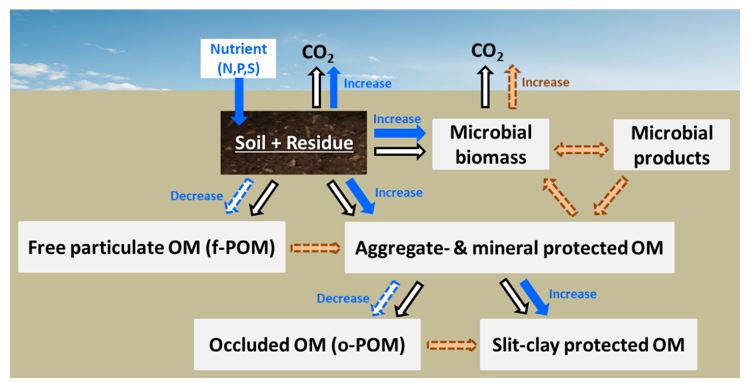
Figure 4. A conceptual model showing the allocation of wheat stubble carbon in physically-defined soil organic matter fractions in two contrasting soils, (Red Chromosol, and cracking clay Vertosol), at high stubble rate (12t/ha), influenced by nutrient input. See Fig. 1 for soil C fractions. Black and blue arrows represent the flux without or with nutrient input, respectively.
Both soils exhibited the same trend of residue-C distribution in the fractions. Extra nutrients increased residue-derived CO2 respiration and microbial biomass, that is, the flow of cycling, turnover and stabilization of microbial biomass and products (as represented in Figure 4 by orange arrows) (Fang et al. 2018b). The partitioning of residue-C in soil C fractions at low-residue rate (4t/ha) was not impacted by the extra nutrients; hence, a conceptual figure for that treatment is not presented.
Conclusion
- This incubation study demonstrated the interaction of varying inputs of wheat stubble and nutrients influenced residue-C mineralisation, microbial biomass, and incorporation of residue-C in SOM fractions.
- The majority (48−61%) of added stubble-C was mineralised in eight months in the red Chromosol, and cracking clay Vertosol.
- Only at the high stubble input (12t/ha), adding both low or high amount of nutrients increased residue-C mineralisation and microbial biomass, leading to stabilisation of residue-C in the heavy fraction, including silt-clay (humified) fraction in both soils (Vertosol > Chromosol).
- At the low stubble residue input (4t/ha), there is no effect of extra nutrients on residue-C mineralisation, microbial biomass, and labile or stable C fractions in both soils.
- Gentle mixing of crop stubble in the soil (such as shallow tillage) has the potential to mobilise nutrients from SOM and soil surfaces, particularly P and S, beyond their actual contents in the residues (Singh et al. 2017; Sarker et al. 2019).
- Applying extra nutrients with low or normal stubble quantities is not effective for building stable soil C stocks, in cereal-based farming systems. However, extra nutrients appear beneficial for enhancing soil carbon where large amounts of stubble are produced.
- This study was performed under an ideal soil moisture condition in the laboratory, and it is recommended that the carbon sequestration potential in stable SOM fractions be validated under field situations (particularly under high rainfall zones, with high stubble yields).
- This study shows the importance of considering the impacts of stubble management and nutrient availability on microbial activity, as this will determine the extent of stubble decomposition, formation of stable SOM, and mobilisation of soil nutrients for plant growth.
Acknowledgements
The research undertaken as part of this project is made possible by the significant contributions of growers through both trial cooperation and the support of the GRDC, the author would like to thank them for their continued support.
Thanks to Harm van Rees and Abigail Jenkins for reviewing an early draft of the paper, and Central West Farming Systems for providing access to their long-term trial.
Resources
GRDC update paper regarding the nutrient value from crop residue and soil organic matter; Enhancing availability of nutrients from soil organic matter and crop residues_ GRDC
References
Fang, Y., Singh, B.P., Collins, D., Li, B., Zhu, J. and Tavakkoli, E. (2018a) Nutrient supply enhanced wheat residue-carbon mineralization, microbial growth, and microbial carbon-use efficiency when residues were supplied at high rate in contrasting soils. Soil Biology and Biochemistry 126, 168–178.
Fang, Y., Nazaries, L., Singh, B.K. and Singh, B.P. (2018b) Microbial mechanisms of carbon priming effects revealed during the interaction of crop residue and nutrient inputs in contrasting soils. Global Change Biology 24, 2775–2790.
Fang, Y., Singh, B.P., Cowie, A., Wang, W., Arachchi, M.H., Wang, H. and Tavakkoli, E. (2019) Balancing nutrient stoichiometry facilitates the fate of wheat residue-carbon in physically defined soil organic matter fractions. Geoderma - Science Direct
Golchin, A., Oades, J.M., Skjemstad, J.O. and Clarke, P. (1994) Study of free and occluded particulate organic matter in soils by solid state 13C CP/MAS NMR spectroscopy and scanning electron microscopy. Australian Journal of Soil Research 32, 285–309.
Guppy, C.N., Menzies, N.W., Moody, P.W. and Blamey, F.P.C. (2005) Competitive sorption reactions between phosphorus and organic matter in soil: a review. Australian Journal of Soil Research 43, 189–202.
Hagerty, S.B., van Groenigen, K.J., Allison, S.D., Hungate, B.A., Schwartz, E., Koch, G.W., Kolka, R.K. and Dijkstra, P. (2014) Accelerated microbial turnover but constant growth efficiency with warming in soil. Nature Climate Change 4 (10), 903–906.
Herath, H.M.S.K., Camps-Arbestain, M., Hedley, M., Van Hale, R. and Kaal, J. (2014) Fate of biochar in chemically- and physically-defined soil organic carbon pools. Organic Geochemistry 73, 35–46.
Jenkinson, D.S. (1977) Studies on the decomposition of plant material in soil. V. the effects of plant cover and soil type on the loss of carbon from 14C labelled ryegrass decomposing under field conditions. Journal of Soil Science 28 (3), 424–434.
Keiluweit, M., Bougoure, J.J., Nico, P.S., Pett-Ridge, J., Weber, P.K. and Kleber, M. (2015) Mineral protection of soil carbon counteracted by root exudates. Nature Climate Change 5, 588–595.
Kirkby, C.A., Richardson, A.E., Wade, L.J., Battenb, G.D., Blanchard, C. and Kirkegaard, J.A. (2013) Carbon-nutrient stoichiometry to increase soil carbon sequestration. Soil Biology and Biochemistry 60, 77–86.
Kirkby, C.A., Richardson, A.E., Wade, L.J., Conyers, M. and Kirkegaard, J.A. (2016) Inorganic nutrients increase humification efficiency and C-sequestration in an annually cropped soil. PLoS One 11 (5).
Kopittke, P.M., Hernandez-Soriano, M.C., Dalal, R.C., Finn, D., Menzies, N.W., Hoeschen, C. and Mueller, C.W. (2018) Nitrogen-rich microbial products provide new organo-mineral associations for the stabilization of soil organic matter. Global Change Biology 24 (4), 1762–1770.
Sarker, J.R., Singh, B.P., Fang, Y., Cowie, A.L., Dougherty, W.J., Collins, D., Dalal, R.C. and Singh, B.K. (2019). Tillage history and crop residue input enhanced native carbon mineralisation and nutrient supply in contrasting soils under long-term farming systems. Soil & Tillage Research 193, 71–84.
Singh, B.P., Sarker, J.R., Fang, Y., Cowie, A.L., Dougherty, W.D., Bawa, S.S., Badgery, W.B., Singh, B.K. and Dalal, R. (2017) Enhancing availability of nutrients from soil organic matter and crop residues.
van Rees, H., Moodie, M. and Baldock, J. (2017) Can soil organic matter be increased in a continuous cropping system in the low to medium rainfall zone? Can Soil Organic Matter be increased in a continuous cropping system_ Harm van Rees__Full.pdf
Contact details
Bhupinder Pal Singh
NSW Department of Primary Industries, Elizabeth Macarthur Agricultural Institute
Woodbridge Rd, Menangle NSW 2568
02 4640 6406; 0410 130 711
bp.singh@dpi.nsw.gov.au
GRDC Project Code: DAN00169,