The amelioration of subsurface acidity stratification by contrasting liming methods
The amelioration of subsurface acidity stratification by contrasting liming methods
Take home messages
- Direct placement of prilled lime below the seed row can be used to effectively ameliorate subsurface soil acidity, however the amelioration is limited to the sowing row.
- Soil sampling at 0-10cm is insufficient at identifying soil pH stratification, finer sampling increments of 5cm should be used.
Background
Soil acidity is a major constraint on crop production in Australia (Li et al., 2019), costing Australian producers approximately $1.6 billion in lost production (Hajkowicz et al., 2005). A variation of soil acidity is subsurface acidity stratification. Subsurface pH stratification is the formation of an acidic layer (soil pH CaCl2<5.2) in the subsurface soil profile (5-20cm deep). The combination of common farming practices including no-till farming and soil sampling in 10cm increments, means that subsurface pH stratification can develop unchecked and has gone un-diagnosed until recently (Burns et al, 2017).
Subsurface pH stratification can be difficult to ameliorate as it is hard to get an ameliorant deep into the soil profile. Current recommendations are to apply high amounts of lime to the soil surface and wait for it to slowly leach down the soil profile, or, to incorporate surface applied lime to the depth of the acid layer; for a faster response (Scott et al., 1997). In current no-till farming systems the use of tillage equipment to incorporate lime is often not a favourable option for growers and therefore other alternatives need to be investigated.
The introduction of commercially available prilled (pelleted) lime now makes it possible for sowing equipment to be used to place a concentrated band of lime beneath, or within, the sowing row. This may be a potential alternative to deliver lime deeper into the soil profile, without whole field incorporation. Compared to the current practice of surface broadcasting lime and incorporating with tillage, the use of prilled lime in the sowing row allows precise amelioration of subsurface pH stratification while maintaining a no-till/minimum-till farming system. Prilled lime application would also require less amendment due to ameliorating acidity in the seed row, rather than the entire soil.
This study aims to compare the plant and soil response to amelioration of subsurface acidity by incorporation of surface applied lime, and the banding of prilled lime relative to unamended soil in the field.
Method
Site description
A field experiment was conducted at the NSW Department of Primary Industries (DPI) Wagga Wagga agricultural institute farm, located at 35°02’00.49”S and 147°20’00.38”E. The site has an average annual rainfall of 570mm (Bureau of Meteorology, BOM). Rainfall during the experiment was 127mm, which was well below the average of 241mm for the same time period. The Red Kandosol soil exhibited pH stratification ranging from pH 6.3 at the surface (0-2.5cm) to 4.2 in the 10-12.5cm layer. A summary of the soil chemical characteristics of trial site is shown in Table 1.
Table 1. Initial soil chemical properties of the trial site (values are averages from each plot, sampled May 2019).
Depth (cm) | pH | Exchangeable cations (cmol(+)/kg) | ECEC (cmol+/kg) | Al% | Ca:Mg | ESP% | |||||
|---|---|---|---|---|---|---|---|---|---|---|---|
Al | Ca | K | Mg | Mn | Na | ||||||
0-2.5 | 6.38 | 0.02 | 7.59 | 1.51 | 0.99 | 0.04 | 0.04 | 10.17 | 0 | 8.7 | 0.4 |
2.5-5 | 5.86 | 0.03 | 7.23 | 1.09 | 0.82 | 0.08 | 0.04 | 9.29 | 0 | 8.9 | 0.4 |
5-7.5 | 4.88 | 0.18 | 5.22 | 0.80 | 0.66 | 0.17 | 0.03 | 7.05 | 3 | 7.8 | 0.4 |
7.5-10 | 4.21 | 0.52 | 3.35 | 0.68 | 0.53 | 0.20 | 0.02 | 5.30 | 10 | 6.3 | 0.4 |
10-12.5 | 4.10 | 0.62 | 3.14 | 0.63 | 0.58 | 0.18 | 0.02 | 5.17 | 12 | 5.4 | 0.4 |
12.5-15 | 4.23 | 0.39 | 3.60 | 0.60 | 0.77 | 0.13 | 0.02 | 5.51 | 7 | 4.7 | 0.4 |
15-17.5 | 4.47 | 0.17 | 3.93 | 0.59 | 0.95 | 0.08 | 0.02 | 5.75 | 3 | 4.2 | 0.4 |
17.5-20 | 4.79 | 0.07 | 4.25 | 0.59 | 1.12 | 0.05 | 0.03 | 6.11 | 1 | 3.8 | 0.5 |
20-25 | 5.06 | 0.03 | 4.35 | 0.55 | 1.36 | 0.03 | 0.04 | 6.35 | 0 | 3.2 | 0.6 |
Experimental design and treatments
The experiment was conducted in a complete randomised block with four replicates and five treatments; lime incorporated (lime mix), incorporated control (control mix), prilled lime ripped (prill rip), ripped control (control rip), and a nil control (control).
Prior to treatment application, the trial area was mown to remove the previous season’s wheat stubble. Treatments were applied on 9 May 2019, with the nil control having no tillage or amendment applied.
The lime mix treatment had lime surface applied at 2t/ha. For the first year of application, this rate was calculated to raise the pH to 5.5 based on pH buffering capacity of 0.9cmol+/kg/pH unit as measured for the same soil in a nearby paddock (Condon, 1995) and a lime efficiency of 60% (% of lime that dissolves in the first year) (Upjohn et al., 2005). The lime was incorporated to a depth of 13cm using an off-set disc.
The control mix treatment had the same tillage applied without the lime addition. The prill rip treatment had prilled lime applied at a rate of 0.3t/ha, which was calculated to increase pH to 5.5 using an estimated pH buffering capacity of 0.7cmol/kg/pH. The application rate for prilled lime was different to that in lime mix due to varying pH buffering capacity (pHBC) at depth of placement, and an estimated smaller soil volume influenced by the amendment. A horizontal amendment spread was estimated to be 5cm and at a depth of 7cm in the soil profile using a direct drilling seeder. That is, prilled lime would fall into a 5cm wide furrow behind the tine when placed in a band and the top of the band was 7cm down the soil profile. The control rip had the same machine pass over it without any amendment applied.
Plot size was 6m long and 1.5m wide, leaving 0.25m buffer room around each plot (0.25m from each side of plot, 0.5m in total between plots). A buffer was sown around the outside of the experiment and a single sowing pass between each replicate.
Plots were sown with faba beans (Vicia faba) at a targeted plant density of 25plants/m2. Seeds were inoculated the day before sowing with group F inoculum via a peat slurry. Plots were sown with 100kg/ha of GRANULOCK® Z. SOYGRAN (N:5.5%, P:15.3%, S:7.5%, Ca:9.5%, Zn:0.5%). A tined plot seeder was used to sow on the same day as treatments, 9 May 2019, at 25cm row spacings.
Weeds were controlled by a pre-emergent application of Terbuthylazine (Terbyne® Xtreme applied at 900g/ha), Tri-Allate (Avadex® Xtra applied at 1.6L/ha) and Pendimethalin (Stomp® applied at 1.6L/ha). In addition, any observed weeds during the trial period were either pulled out or cut off below the soil surface with a hoe. Disease was managed with the use of a post emergent fungicide application. A single application of Mancozeb at a rate of 2kg/ha was applied 16 August 19 to control chocolate spot and ascochyta blight.
Soil measurements
Soil sampling
Soil samples were taken at the start of trial on 1 May 2019, before any treatment application and at the end of the trial, 10 September 2019, 19 weeks after amendment application. Soil samples were taken in 2.5cm depth increments from 0-20cm, and in 5cm increments from 20-25cm. Across each plot, four soil cores, 25mm in diameter, were taken randomly for the initial sample (no established rows). In the final sampling, two separate samples for on, and off, the row were taken relative to the placement of the prilled lime directly under the sowing row. Soil of individual depth increments from each layer of duplicate cores was bulked together to form a composite sample from each plot. The soil was dried in a dehydrator at 40°C for at least 48 hours. Once dry, the samples were crushed to pass through a 2mm sieve using a heavy roller. Results are presented on an air-dried basis.
Soil chemical analysis
Soil pH
Soil pH was measured using method 4B1 (Rayment et al., 2011). For analysis, 5g of soil was weighed into 50ml centrifuge tubes and 25ml of 0.01M CaCl2 solution was added. The soil suspension was shaken end over end for one hour at 30RPM and then allowed to settle for 30minutes. The pH electrode (Oakton all-in-one pH/temp probe) was submerged in the soil extract solution, and pH was recorded when the meter read a constant value for 30seconds. The electrode was calibrated using pH 7 and 4 buffers and the electrode was rinsed with de-ionised water between each sample. A standard soil was analysed for quality assurance purposes.
Exchangeable cations (Al3+, Ca2+, Na+, Mn2+, Mg2+, K+)
The method used to determine exchangeable cations was based on method 15E1 (Rayment et al., 2011) using an Inductively coupled plasma optical emission spectrometer (ICP-OES – Varian 710-ES).
Soil extraction was achieved using an unbuffered 0.1M BaCl2 and 0.1M NH4Cl solution. 20ml of extracting solution was added to a 2g soil sample. The mixture was shaken end over end for two hours at 30RPM and then centrifuged at 4 000RPM for 10minutes. The supernatant was subsampled by pipette and refrigerated before being analysed with the ICP-OES. The ICP-OES was set at the following wavelengths; Al 369.152nm, Ca 315.887nm, Na 588.995nm, Mn 257.610nm, Mg 279.078nm, K 769.897nm, to provide the concentration of each ion in solution. Results were then converted to concentrations of ions in the soil and presented as cmol+/kg of soil.
Exchangeable cations were measured for the initial soil sampling- and the relationship between pH and exchangeable aluminium (Al) was used to estimate exchangeable aluminium percentage (Alex%) for the final sampling. This estimate was instead of Inductively Coupled Plasma (ICP) analysis, which was not possible due to resourcing issues. Hochman et al. (1992) demonstrated the close relationship between soil pH and exchangeable Al and demonstrated initial values can be effectively used to estimate concentrations post lime application. A regression analysis of the initial soil pH and Alex% was used to create estimations of the final soil samples.
Plant measurements
Dry matter (DM) production
In the 2019 trial, DM production was assessed by making above ground biomass cuts on 17 July , 8 August, 29 August, and 24 September (11, 14, 17 and 21 weeks after sowing, respectively). Each cut was 0.5m long and 1m wide (four rows), recording the number of plants cut. Plant biomass cuts were dried in a dehydrator at 60°C for one week, prior to weighing.
Root assessments
J-root scoring was completed at the first dry matter sample (17 July 2019). Following above ground dry matter cuts, the roots were carefully excavated and evaluated for the occurrence of J-rooting of the tap root. J-rooting was defined as an abrupt angle change in the tap root as seen in Figure 1. This was presented as the calculated percentage of plants sampled per plot that exhibit J-rooting.
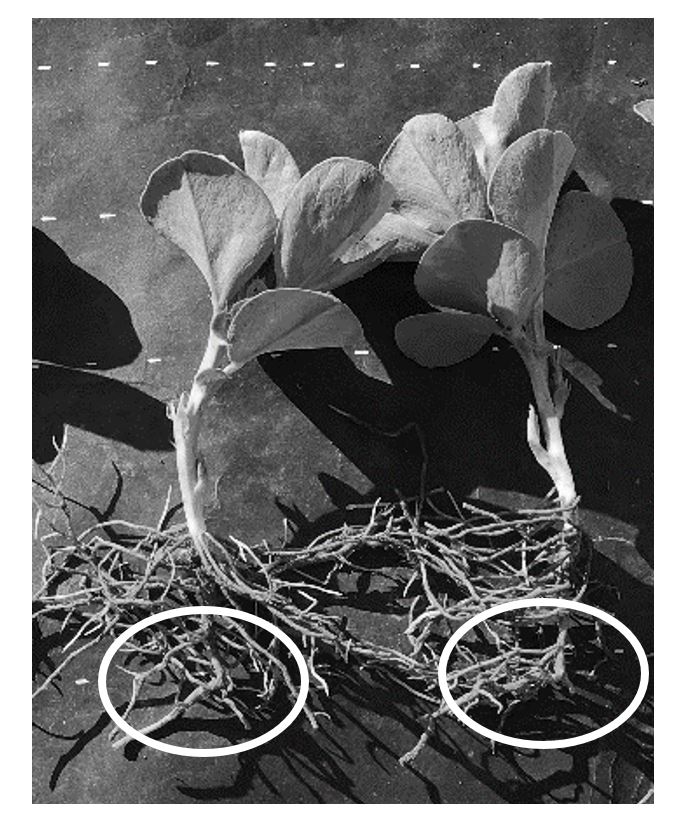
Figure 1. J-rooting found in the field trial (17 July 2019). Circles are identifying the J-rooted tap root.
Further root assessments were conducted in September 2019. Root weights above and below the acid layer were measured using a large core, 10cm in diameter and 20cm deep, inserted into the sowing row. Two cores were taken per plot and cores were taken with the base of a single plant in the centre of each core. Each core was split at the start of the acid layer (7.5cm based on initial soil sample results in Table 1) to provide root mass above the acid layer and root mass that had grown through the acid layer. All the soil was washed away from the roots and then the roots were dried at 60°C for one week and weighed.
Nodulation scoring was also conducted on the root systems that were dug up using the large cores. The scoring system was a 0-5 schedule based on the method described by Corbin et al. (1977), and is explained in Table 2. Plants were score based on the number and distribution of active nodules.
Table 2. Nodule scoring system adapted from Corbin et al. (1977).
Distribution and number of effective* nodules | ||
|---|---|---|
Nodule score | Above acid layer | Below acid layer |
0 | 0 | 0 |
0.5 | 0 | 1-4 |
1 | 0 | 5-9 |
1.5 | 0 | Many (>10) |
2 | Few (<10) | 0 |
2.5 | Few (<10) | Few (<10) |
2.75 | Few (<10) | Many (>10) |
3 | Many (>10) | 0 |
4 | Many (>10) | Few (<10) |
5 | Many (>10) | Many (>10) |
* active/effective nodules are pink in colour | ||
Grain yield
Grain yield was collected using a Kingaroy plot harvester on 15 November 2019. Plots were harvested and then grain yield was calculated as t/ha.
Statistical analysis
Statistical analysis of data collected was completed using the data analysis add-in in Microsoft Excel. Single-factor analysis of variance (ANOVA) and Fishers Least Significant Difference (LSD) with a P-value of 0.05 were used to determine significant differences between treatments for all data collected. Soil measurements were analysed at individual depths, and root growth was analysed as separate layers and as a whole.
Results and discussion
Soil chemistry
Treatment application caused significant differences (P<0.05) in soil pH within the first five soil layers (0-12.5cm) as illustrated in Figure 2. The addition of mixed lime into the soil profile significantly increases soil pH compared to the mixed control by 0.5, 0.7, and 0.7 pH units in the 0-2.5cm, 2.5-5cm, and 5-7.5cm layers respectively. However, in the 0-2.5cm layer, the pH was not significantly different to the un-mixed control. The act of mixing or ripping resulted in a significantly lower surface pH (0-2.5cm) relative to the control. These results demonstrate the application of tillage results in the mixing of stratified soil pH forming an altered soil pH profile. The use of off-set discs has previously been used as the method of incorporation in lime trials and is shown to be the most effective method of incorporation (Conyers et al., 2003, Conyers et al., 1996, and Scott et al., 2006). However, the results from this study provided evidence that off-set disc machines do not mix the soil thoroughly.
The addition of prilled lime significantly increased the soil pH in the 5-7.5cm, 7.5-10cm and 10-12.5cm layers by 0.95, 0.85 and 0.65 pH units, compared to the control rip and un-mixed controls. The amelioration of soil above the site of application is likely due to the inaccuracy of machinery used in applying treatment and post application mixing during sowing.
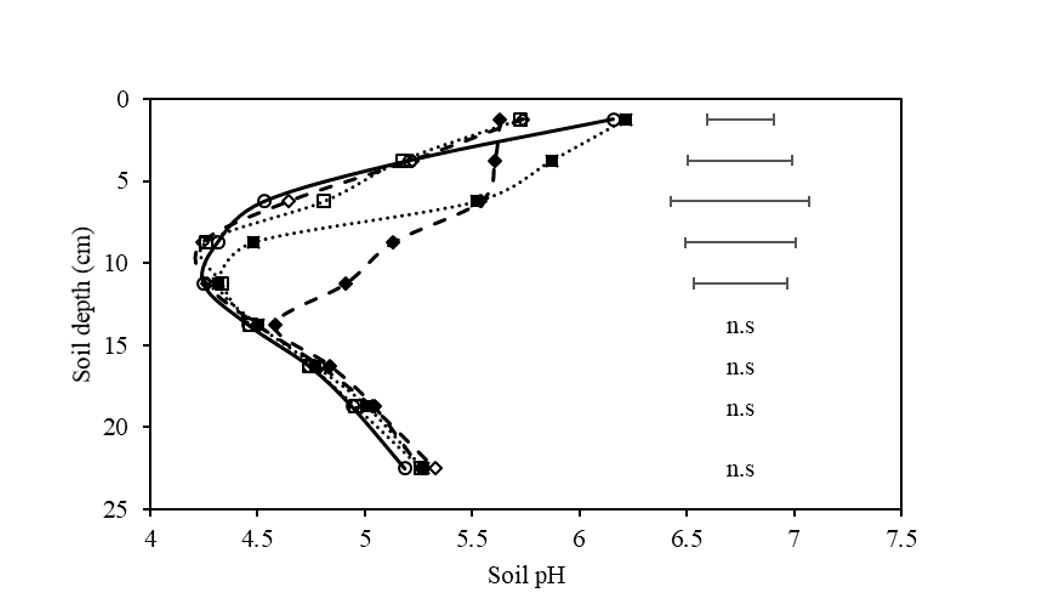
Figure 2. Soil pH(CaCl2) of soil layers on the rip line, 140 days post treatment application in the field. Treatments include control (○), prilled lime ripped at 300kg/ha (♦), control ripped (◊), lime mixed at 2t/ha and incorporated with off-set disc (■), and control mix by off-set discs (□). Bars represent least significant difference (LSD) at P=0.05, n.s signifies no significant difference.
There was a significant decrease in exchangeable aluminium (Alex)% in three soil layers; 5-7.5cm, 7.5-10cm, and 10-12.5cm (Figure 3) due to treatments effects. In the 5-7.5cm soil layer, the addition of amendment, either lime or prilled lime, eliminated Alex in the layer. The addition of lime, however, did not reduce Alex% compared to the control mix. In both the 7.5-10cm and 10-12.5cm layers, prilled lime had the lowest Alex% with 1.6% and 2.4% respectively. The prilled lime treatment was the only treatment to maintain an Alex% below the critical level of 5% for the entire soil profile sampled.
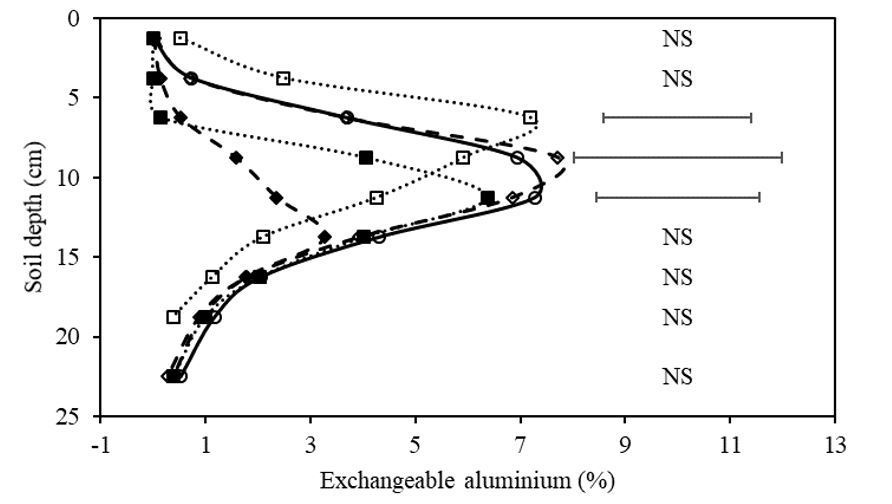
Figure 3. Exchangeable aluminium percentage (% Cation Exchange Capacity (CEC)) of soil layers on the rip line, 140 days post treatment application in the field. Treatments include control (○), prilled lime ripped at 300kg/ha (♦), control ripped (◊), lime mixed at 2t/ha and incorporated with off-set disc (■), and control mix by off-set discs (□). Bars represent least significant difference (LSD) at P=0.05, n.s signifies no significant difference.
Comparing the effect of treatment on the difference in soil pH between the sowing row and soil in the inter-row (Figure 4) indicates that no significant treatment differences exist between on-row and inter-row in the 0-15cm layers except for the prilled lime treatment. The pH of the prilled lime treatment on the row was significantly greater than the inter-row in the 5 -12.5cm layers. This result is explained by the localised influence of the prilled lime in the seeding row and the lack of lateral movement of alkali from the row. Similar results have been reported by Lollato et al. (2013), where there was no movement laterally or downward from the band of pelleted lime applied at either 225 or 450kg/ha. No difference between on- and inter-row pH was expected for treatments that had the same amendment rate (zero or otherwise) applied evenly over the surface; these being the control, lime mix, control mix and control rip.
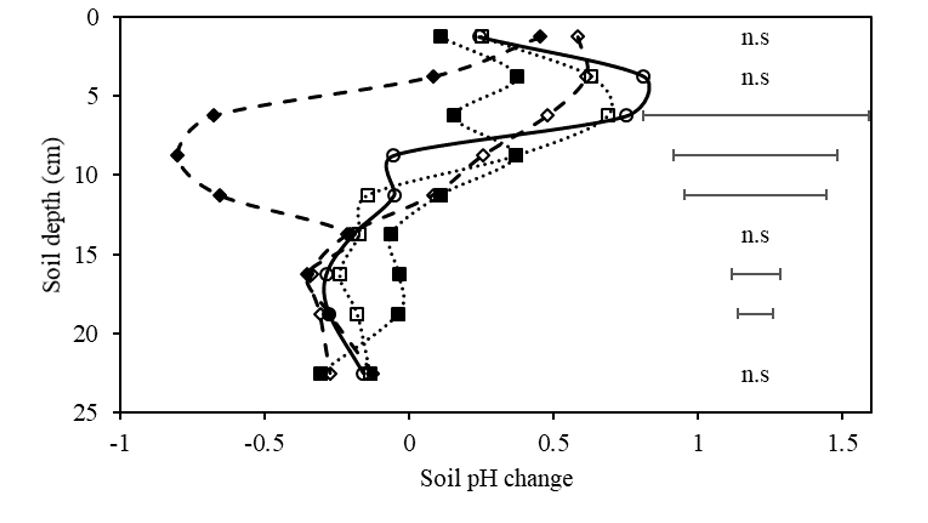
Figure 4. The change in soil pH (CaCl2) between the rip line and inter-row. Negative values show higher pH in the rip line and positive values show higher pH in the inter-row. Treatments include control (○), prilled lime ripped at 300kg/ha (♦), control ripped (◊), lime mixed at 2t/ha and incorporated with off-set disc (■), and control mix nil lime incorporated by off-set discs (□). Bars represent least significant difference (LSD) at P=0.05.
Agronomic effects
There was no significant difference in treatment DM production between treatments in the first, second and final cuts. DM production varied from 48.2 +/- 5.5g/m2, 122.4 +/- 15.5g/m2 and 289.1 +/- 34.1g/m2 respectively. Statistical analysis of each DM cut revealed a significant difference (P value = 0.1) at the third cut only (Figure 5).
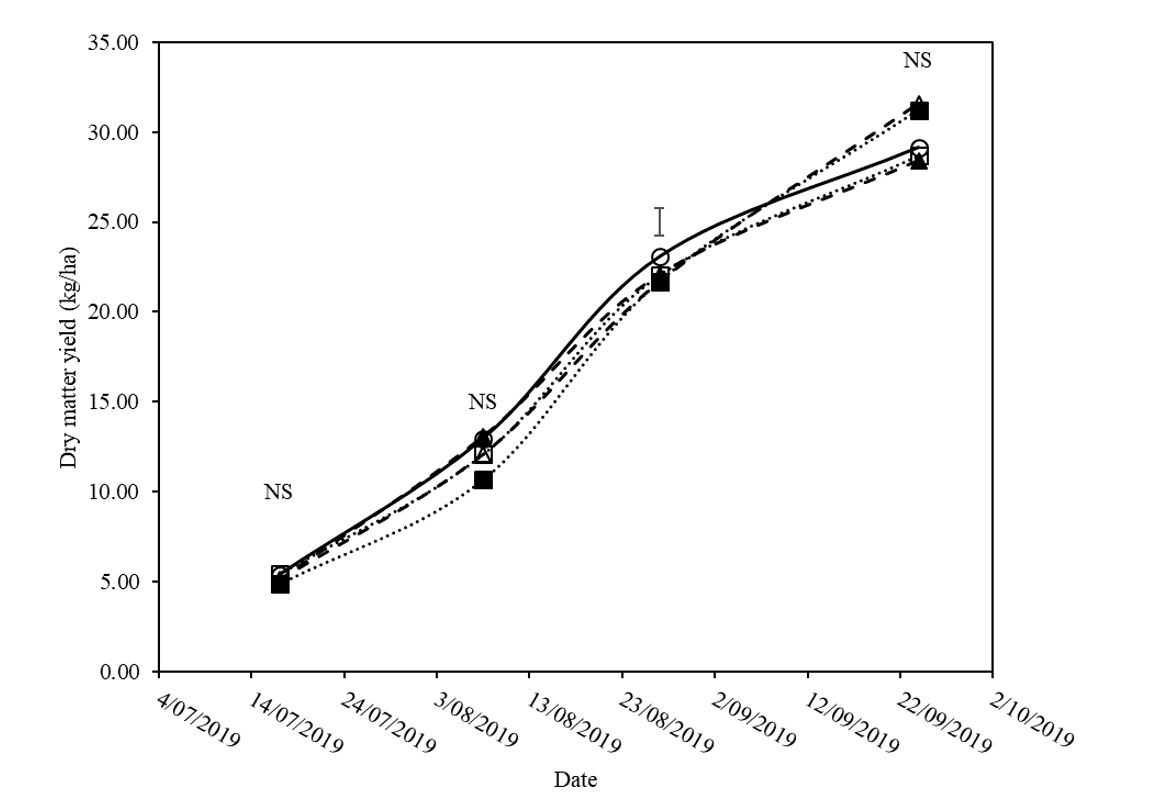
Figure 5. Dry matter (DM) production in g/m2 of faba beans for the duration of the trial period with various treatments applied to soil. Treatments include control (○), prilled lime ripped at 300kg/ha (♦), control ripped (◊), lime mixed at 2t/ha and incorporated with off-set disc (■), and control mix nil lime incorporated by off-set discs (□). Bars represent least significant difference (LSD) at P=0.1, n.s signifies no significant difference.
In the third DM cut the control, lime mix, and prill rip treatments produced the highest amount of DM, with the control mix yielding second and the control rip yielding the lowest amount of DM.
There was no difference in grain yield harvested. Grain yield varied from 500kg/ha to 615kg/ha. The lack of treatment effects for DM production and yield are most likely due to the lack of rainfall experienced during the 2019 growing season. 127mm of rain fell during the growing period which is less than 50% of the long-term average rainfall. In low rainfall years/areas, the yield cost of subsurface acidity is less pronounced than in high rainfall years/areas (Tang et al., 2003) and therefore the benefits of ameliorating subsurface acidity may be also negligible.
Lower rainfall would also result in less dissolution of liming agent. It would be expected that the ameliorants applied would continue to dissolve in future years. Another possible explanation for why there was no significant response to any treatments is given by Norton et al. (2018), which determined the critical pH threshold for faba beans to be between pH 5.2 and 5.4. This research also showed that in pH below 4.8 root weight and shoot weight, plateaued. This would suggest that to increase above and below ground DM yields, a pH greater than 4.8 should be achieved. Despite amelioration being successful, there was still detrimental soil acidity in the stratified layer (7.5-15cm) across all treatments which may have also contributed to the lack of significant DM or yield increases recorded.
Table 3. The occurrence of J-rooting found in the field at the time of the first dry matter (DM) cut on 17 July 2019, as effected by treatments. Means with the same different numbers are statistically different (LSD=14% at P=0.05).
Treatment | Plants counted | Plants with J-root | Plants without J-root | % with J-root |
|---|---|---|---|---|
Prill rip | 11.75 | 2.75 | 9 | 23%a |
Control | 10.5 | 7.5 | 3 | 71%d |
Control mix | 11.25 | 6 | 5.25 | 54%bcd |
Control rip | 10 | 6.5 | 3.5 | 65%cd |
Lime mix | 10.5 | 4.75 | 5.75 | 44%b |
The field trial presented no significant difference in root DM between treatments. While not significant, prill rip had the highest root mass below the acid layer and lime mix had the highest root mass above the acid layer and also the highest total root mass (although not significant). This was consistent with observation made in the field when a trench was dug across rows of the plots to observe root growth.
While there was no difference in root mass, there was a difference in root architecture, as J-rooting was more apparent where acidity occurred (Table 3). It was shown that the addition of amendment reduced the occurrence of J-rooting, and furthermore the addition of prilled lime decreased the occurrence more than lime. This is likely due to the higher Alex concentration in the control which restricted root growth beyond the acidic layer. In comparison, prilled lime particularly reduced the Alex, allowing root growth into the subsurface layers.
The use of off-set discs to mix the soil profile also reduced J-rooting in the field trial compared to the control (Table 3). This indicates that physical constraints may have also limited root growth but to a lesser extent than the effects of subsurface acidity. As indicated by the prill rip demonstrating significantly less J-rooting than any other treatment.
There was a significant difference in the nodulation scores of treatments in the field site. The addition of a pH amendment, either prilled lime or lime, resulted in a higher nodulation score compared to their respective controls; control rip and control mix (Table 4). However, the addition of lime did not increase the nodulation score relative to the control (with the difference between being the same as the LSD). These results are reflective of the soil pH and Alex% found in the field trial (Figure 2 and Figure 3) where the limed treatment had the highest pH above the acid layer (0-7cm) and prilled lime had the highest pH below the acid layer (greater than 7cm deep).
It is clear from this study that nodulation of faba beans was inhibited when soil pH was less than 5. Several studies have been completed to show that nodulation is highly sensitive to acid soils (Charman et al., 2008, Denton et al., 2017, Jessop et al., 1982 and Richardson et al., 1988).
Table 4. Average nodulation scores given to each treatment on 12 September 2019 on a scale from 1-5 based on location and number of active nodules. Means with a different letter are statistically different (least significant difference (LSD)=0.7 at P=0.05).
Treatment | Nodulation score (1-5) |
|---|---|
Prill rip | 3.7a |
Control | 2.7bc |
Control mix | 2.3c |
Control rip | 2.5c |
Lime mix | 3.4ab |
Effect of sampling depth
To demonstrate the implications of using varying sampling increments to identify pH stratification, pH data, collected in the field trial in 2.5cm increments, was averaged to create the proposed sampling increments of 5cm and 10cm. Assuming that sampling using 2.5cm increments best represents the actual pH of the profile, the profile had a minimum and maximum pH of 4.2 and 6.2 respectively, depicting a pH variation of two units (Figure 6). If the 2.5cm increment data is used to mathematically create 5cm increments, a minimum and maximum pH of 4.3 and 5.7 is exhibited respectively (variation of 1.4 pH units in the profile). If 10cm increments are calculated using the means of smaller increments, a minimum and maximum pH of 4.6 and 5.2 is apparent respectively (variation of 0.6 units in the soil profile).
The difference between the calculated minimum pH found by the different sampling increments compared to 2.5cm increments was 0.1 and 0.4 pH units for 5cm and 10cm increments, respectively. In terms of identifying the pH stratification the 2.5cm and 5cm incremental sampling clearly identifies the large pH gradient present in the soil, while the 10cm incremental sampling did not identify the correct magnitude or location of the subsurface acidity present.
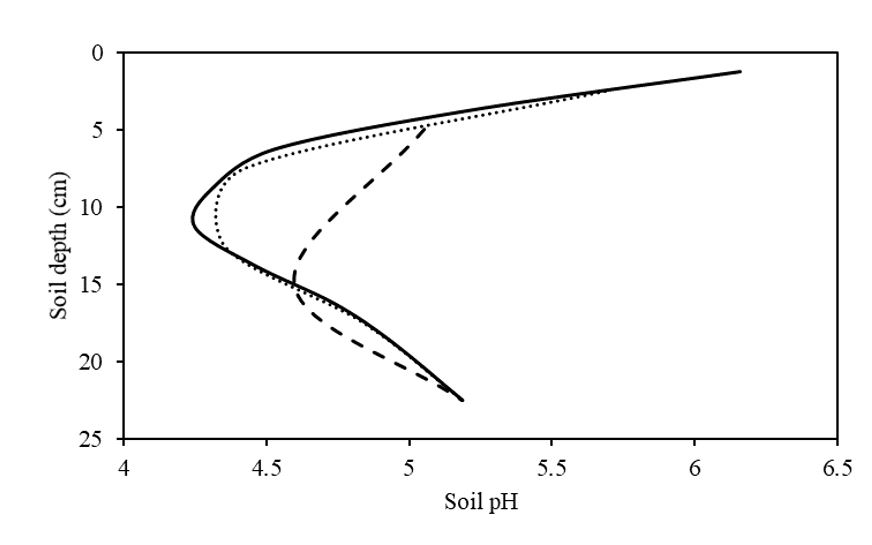
Figure 6. Final soil pH of the control treatment in the field trial displayed as varying sampling increments, solid line = 2.5cm increments (actual), dotted line= 5cm increments (calculated), and dashed line= 10cm increments (calculated).
The use of 2.5cm sampling increments in this study was crucial to demonstrating the severity of the pH stratification in the field trial, as well as in demonstrating the effectiveness of amelioration of pH stratification. Based on the data of this study, there appears to be no advantage to using 2.5cm increments compared to 5cm increments as they both clearly identified both the severity of the pH stratification and the location of the acid throttle in the profile. Additionally, if only a surface 0-10cm sample was taken, the presence of the subsurface acidity would have remained undetected. These results support the recommendation of Burns et al. (2017), that suggested 5cm soil sampling be used to detect pH stratification and monitor soil acidity management strategies due to the extra detail provided by using the finer increments.
Conclusion
Both lime and prilled lime ameliorated soil pH and exchangeable aluminium concentrations. Prilled lime was more effective than incorporated lime at ameliorating the subsurface pH to depth. This is due to the vertical mixing that occurred when prilled lime was applied by ripping in the sowing row. However, whilst incorporation of lime ameliorated soil on, and off, the sowing row, prilled lime only ameliorated soil in the sowing row.
Whilst there were no increases in faba bean growth or grain yield as a result of any treatment application in this study, the results were impacted by drought conditions. Despite this, the application of lime and prilled lime did increase nodulation and decrease J-rooting of faba beans in the field.
The subsurface acidity that existed in the field was identified by sampling in 2.5cm intervals. Accurate diagnosis of this pH stratification was not shown to be possible by soil sampling in 10cm intervals. Sampling increments of 5cm appear to provide a practical, optimum definition of the pH stratification that existed in the field. Therefore, it is recommended that 5cm intervals be used in no-till farming systems where stratification of soil layers is more likely to occur.
Acknowledgements
The authors wish to thank the Graham Centre for funding the project and support of NSW DPI for use of the field site. We are grateful for the assistance of Mark Richard and the pulse team, as well as Andrew Price from the NSW Department of Primary Industries assistance in conducting the field trial.
References
Bureau of Meterology (BOM). Climate statistics for Australian locations (www.bom.gov.au).
Burns, H., Norton, M., Scott, B. J., and Tyndall, P. (2017) Stratified ph in soil surface signals need to revisit acidic soil management. (Paper presented at the 30th Conference of the Grassland Society of NSW, Cowra, NSW).
Charman, N., Ballard, R. A., Humphries, A. W., and Auricht, G. C. (2008) Improving lucerne nodulation at low pH: contribution of rhizobial and plant genotype to the nodulation of lucerne seedlings growing in solution culture at pH 5. Australian Journal of Experimental Agriculture 48(4), 512-517. doi:10.1071/EA07138
Condon, J. R. (1995) The amelioration of surface and subsurface soil acidity using calcium bicarbonate. (LaTrobe University, Bundoora).
Conyers, M. K., Heenan, D. P., McGhie, W. J. and Poile, G. P. (2003) Amelioration of acidity with time by limestone under contrasting tillage. Soil and Tillage Research 72(1), 85-94. doi:10.1016/S0167-1987(03)00064-3
Conyers, M. K., Hennan, D. P., Poile, G. J., Cullis, B. R. and Helyar, K. R. (1996) Influence of dryland agricultural management practices on the acidification of a soil profile. Soil & Tillage Research 37, 127-141.
Corbin, E. J., Brockwell, J. and Gault, R. R. (1977) Nodulation studies on chickpea (cicer arietinum). Australian Journal of Experimental Agriculture and Animal Husbandry 17, 126-134.
Denton, M. D., Phillips, L. A., Peoples, M. B., Pearce, D. J., Swan, A. D., Mele, P. M. and Brockwell, J. (2017) Legume inoculant application methods: Effects on nodulation patterns, nitrogen fixation, crop growth and yield in narrow-leaf lupin and faba bean. Plant and Soil 419(1), 25-39. doi:10.1007/s11104-017-3317-7
Hajkowicz, S. and Young, M. (2005) Costing yield loss from acidity, sodicity and dryland salinity to australian agriculture. Land Degradation & Development 16(5), 417-433. doi:10.1002/ldr.670
Hochman, Z., Edmeades, D. and White, E. (1992) Changes in effective cation exchange capacity and exchangeable aluminum with soil ph in lime-amended field soils. Soil Research 30(2), 177-187. doi:10.1071/SR9920177
Jessop, R. and Mahoney, J. (1982) Effects of lime on the growth and nodulation of four grain legumes. Soil Research 20(3), 265-268. doi:10.1071/SR9820265
Li, G. D., Conyers, M. K., Helyar, K. R., Lisle, C. J., Poile, G. J. and Cullis, B. R. (2019) Long-term surface application of lime ameliorates subsurface soil acidity in the mixed farming zone of south-eastern australia. Geoderma 338, 236-246. doi:10.1016/j.geoderma.2018.12.003
Lollato, R. P., Edwards, J. T. and Zhang, H. (2013) Effect of alternative soil acidity amelioration strategies on soil ph distribution and wheat agronomic response. Soil Science Society of America Journal 77(5), 1831-1841. doi:10.2136/sssaj2013.04.0129
Norton, M. R., Tyndall, P., Price, A. and Lowrie, R. (2018) Screening faba bean for tollerance to low ph. (NSW Department of Primary Industries).
Rayment, G. E. and Lyons, D. J. (2011) Soil chemical methods : Australasia. (CSIRO Publishing, Victoria)
Richardson, A. E., Henderson, A. P., James, G. S. and Simpson, R. J. (1988) Consequences of soil acidity and the effect of lime on the nodulation of trifolium subterraneum l. Growing in an acid soil. Soil Biology and Biochemistry 20(4), 439-445. doi:10.1016/0038-0717(88)90055-7
Scott, B. J., Conyers, M. K., Poile, G. J. and Cullis, B. R. (1997) Subsurface acidity and liming affect yield of cereals. Australian Journal of Agricultural Research 48(6), 843-854. doi:10.1071/A96140
Scott, B. J. and Coombes, N. E. (2006) Poor incorporation of lime limits grain yield response in wheat. Australian Journal of Experimental Agriculture 46(11), 1481-1487. doi:10.1071/EA04169
Tang, C., Asseng, S., Diatloff, E. and Rengel, Z. (2003) Modelling yield losses of aluminium-resistant and aluminium-sensitive wheat due to subsurface soil acidity: Effects of rainfall, liming and nitrogen application. Plant and Soil 254(2), 349-360. doi:10.1023/a:1025597905001
Upjohn, B., Fenton, G. and Conyers, M. (2005) Soil acidity and liming (3rd ed.) (NSW Department of Primary Industries)
Contact details
Thomas Price
School of Agriculture and Wine Sciences, Charles Sturt University
Wagga Wagga
0467 309 526
thprice@csu.edu.au