The yield gap calculator and implications of the national paddock survey for Western Australia
The yield gap calculator and implications of the national paddock survey for Western Australia
Author: Roger Lawes, Harm Van Rees, Jeremy Whish, Gupta Vadakattu, David Gobbett, Jackie Ouzman, Chao Chen, Noboru Ota, CSIRO, Cropfacts P/L. | Date: 12 Feb 2020
Key messages
- Yield gaps in wheat were infrequent, with one in three paddocks having a yield gap of 0.8t/ha or more. The yield gap in wheat averaged 20% of yield potential.
- The most important driver of the yield gap was the nitrogen (N) unlimited yield potential, with the higher the yield potential, the greater the likely yield gap. Growers are less likely to achieve yield potential in favourable seasons.
- Nitrogen was the next most important variable, and crops with higher yield potentials were most likely to be under-fertilised and therefore N limited.
- Crop rotation was also an important driver of the yield gap, but only in some situations. Rotations partly contributed to some disease problems including Fusarium.
- Thirteen groups or “types” of yield gap were identified nationally. For Western Australia, four of these groups dominated and in addition to variables described above, Rhizoctonia, Pythium, Pratylenchus and yellow leaf spot also contributed to the yield gap.
- The yield gap calculator is presented as a decision tree and is designed to help inform when a yield gap could occur.
Aims
The GRDC national paddock survey project (BWD00025) of 250 paddocks for four years was designed to understand the basis behind the yield gap and generate the data necessary to construct a yield gap calculator.
The yield gap calculator identifies the key agronomic factors that contribute to yield gaps, where yield gaps are the difference between yield potential and the yield generated on farm.
Introduction
The yield gap is the difference between the actual crop yield achieved by the grower and the water-limited yield potential. The water-limited yield potential (Yw) is defined as the maximum possible yield possible given the rainfall (amount and pattern) on a specific soil type and the optimal sowing date, current cultivars and nutrients, pests, disease and weeds not limiting yield.
Historically, yield gaps have been calculated after the final crop is harvested. That is, the actual yield is observed and the potential yield is calculated. The difference, defined as the yield gap, is therefore assumed to be due to abiotic and biotic stresses and is a by-product of management and environment. ‘Yw’ is usually calculated using a crop growth model. Previous studies have shown that well managed commercial wheat crops can reach their potential (van Rees et al 2014), indicating that it is not an unattainable or unrealistic yield. However, a previous study using shire-level data showed that wheat yield gaps average around 55% across Australia, meaning that the yields growers are currently achieving are about half those potentially possible (Hochman et al 2016). A small yield gap indicates that management is near optimum. A large yield gap implies that crop productivity is constrained by abiotic and/or biotic factors, such as nutrient deficiencies, weeds, diseases, insects. Other factors such as sowing time and a frost or heat shock can also contribute to a yield gap.
Here we briefly describe the method of data collection, the construction of the calculator and how we used it to generate key yield potential messages for Western Australia.
Method
The national paddock survey was designed to build a diverse database of crop production parameters, that could inform a yield gap calculator. Two hundred and fifty individual paddocks were monitored from 2015 to 2018, inclusive. The survey included extensive assessments of crop diseases, using visual assessments of roots (at growth stage 30) and PreDicta B DNA assessments (pre-sowing) of the soils and stubble residue. Weeds were monitored at growth stage 30 and growth stage 65 (or the approximate equivalent in indeterminate crops). Inputs such as fertiliser and herbicide types/rates, cultivars used, sowing date, cultivation were recorded. Crop yields in the paddock were determined from yield maps, collected from farmers or contractors grain harvesters.
Yield potential was estimated with the APSIM simulation model. Soils for the simulation were parameterised by an expert panel, using information about soil moisture captured in the paddock. Yield potential was simulated where nitrogen was unlimited (Yw – water limited, N unlimited yield). Simulated yield that mimicked the N management of the farmer was also calculated (Ysim – N limited yield). The estimate of yield potential was used in the calculator to understand the drivers behind the yield gap. In this version of the calculator, the time of sowing for each paddock was simulated. No other component of time-of-sowing was used in the estimate of the yield gap, and was therefore not considered part of the yield gap process.
Climate information was captured from the SILO dataset (https://www.longpaddock.qld.gov.au/silo/) and data from the Bureau of Meteorology (http://www.bom.gov.au/climate/data/). While information about extreme weather events (e.g. frost, heat) was captured in some fields, it was not universally collected from all fields. Therefore, the relative importance of extreme events was not included in the assessment of the yield gaps.
The project provided a rich resource of data, where information on 17 different crops (mainly wheat, barley and canola) and pastures were collected from 250 paddocks across Australia over four years. In total, 978 paddock/years of data were monitored. A broad range of weather, soil and crop information was collected across all grain growing regions from 2015 to 2018.
Eighty-eight separate variables were used to describe the yield gap. These variables captured a range of diseases, weeds, locations, water and rotational and nutrient components. Often multiple descriptors of the same disease were included to ensure any variable that potentially described a critical process, and was present in the database, was used for the creation of the calculator. The yield gap was defined as the difference between the Yw and Ya, the observed yield from the growers’ paddocks.
Constructing the yield gap calculator
A decision tree was used to build the calculator, using the rpart package in the R statistical programme (Therneau and Atkinson 2019). Biotic stressors, previous crop, rainfall, nitrogen and variables relating to yield potential were fit to the yield gap. Separate calculators were built for wheat, barley and canola. The regression and classification tree identify the most expeditious way through the data, using all the variables available. This does not necessarily provide an agronomic interpretation, but it does provide a prediction of the yield gap, which was the objective of the project. Data about the four groups relevant to WA are presented below. These refer to groups 5, 8, 11 and 13 of the 13 groups identified from the regression tree analysis. The key agronomic variables for the yield gap “types” that exist in WA are described in the results section. The remaining nine groups and attributes are described in detail in the GRDC final report for project BWD00025.
Results
Yield gaps in wheat were generally rare. From the 783 wheat paddocks analysed from the GRDC regions over four years, 61% had a yield gap of less than 0.8t/ha. Therefore, only one in three, or 305 wheat paddocks had a substantial yield gap. This equated to a yield gap of 20%, with growers achieving, on average, 80% of yield potential. Crops with a yield gap were not evenly distributed between the Northern, Southern and Western regions. In the Southern and Western regions, 42% of wheat crops had yield gaps greater than 0.8t/ha. In contrast, only 27% of wheat crops grown in the Northern Region had yield gaps greater than 0.8t/ha. Of the 13 different “types” of yield gap identified, four were evident in the Western Region.
Yield gaps in wheat were influenced by 17 of the 88 variables available. The most important variable was N-unlimited yield potential (Yw). It was responsible for the first split in the decision tree, which occurred at a yield potential of 4.8t/ha. The inference is that the higher the yield potential, the higher the likely yield gap, with producers less likely to capitalise on favourable seasons.
The second most important variable was the nitrogen component of the yield gap. The inclusion of this variable confirms that producers are not achieving yield potential due to a N-deficiency and are under applying N when situations could warrant it. This generally occurs when yield potentials are 4.8t/ha or greater.
In-crop rainfall contributed to the yield gap, where more rainfall contributed to a larger yield gap. This may have reflected the inclusion of water available at harvest, which may be related to in-crop rainfall. More water at harvest points to late rainfall, which could lead to either an unused water resource, the onset of severe pathogens that are not always managed or lead to flooding. The year of analysis influenced the yield gap, which implies that a temporal process, beyond rainfall, influences the yield gap.
In some situations, previous crop was the next most important driver, which points to the importance of crop rotation. Other variables that were correlated with the yield gaps in localised situations included free-living nematodes from the families Aphelenchoididae (Achoid), the region, the amount of nitrogen at harvest, free-living nematodes in the families Panagrolaimidae (Pana), Aphelenchidae (Achus) and Cephalobidae (Ceph), yellow leaf spot, nitrogen at sowing, the root disease score of the seminal roots and crown rot (Fusarium) soil DNA concentrations.
At a national scale, Fusarium and yellow leaf spot caused the most damage, with Rhizoctonia, Pythium and Pratylenchus species also contributing. The attributes of the four critical groups (groups 5, 8, 9 and 13 from the 13 identified) that contributed to the yield gap in wheat in WA were:
Group 5 of 13 features
| % of crops in Group | 12% of all wheat crops |
| Yield Potential | 3.6t/ha |
| Yield Gap | 1.3t/ha (37% yield gap) |
| Region | 45% of crops in this group were in the Western region. |
| Rotation | 30% of crops in this group were wheat on wheat; others following canola or a pulse crop |
| N nutrition | Insufficient nitrogen accounted for 0.9t/ha of the yield gap (67% of the yield gap is explained by insufficient nitrogen to achieve water-limited yield). |
| Disease | PredictaB: low levels of Fusarium, yellow leaf spot and Pratylenchus; Rhizoctonia and Pythium were more prevalent. |
| Crown and seminal root health score | 2.0 (relatively low disease and healthy) |
| Weeds | Weed counts were relatively low, ryegrass was the major weed together with low populations of radish and capeweed. |
| Comments | In-crop rainfall averaged 210mm (low to moderate levels). Main feature was an inadequate N supply, which was compounded by the presence of several biotic stresses at low levels. Paddocks in this group were present in equal portions from 2015 to 2018. |
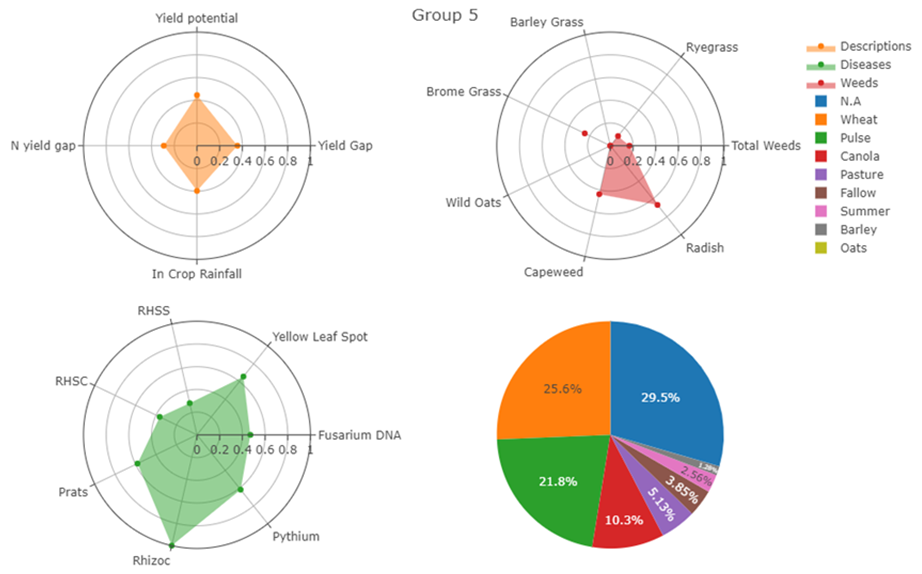
Figure 1. Descriptive, weed, disease and crop rotation attributes for Group 5.
Group 8 of 13 features
| % of crops in Group | 5% of all wheat crops (15% of all wheat crops in the Western Region) |
| Yield Potential | 5.5t/ha |
| Yield Gap | 2.3t/ha |
| Region | Western region only |
| Rotation | Wheat grown after canola (35%) or a cereal (only four crops were grown after a pulse crop) |
| N nutrition | Nitrogen deficiency contributed 30% to the yield gap |
| Disease | PredictaB: high levels of Fusarium, Pythium and yellow leaf spot. Pratylenchus and Rhizoctonia were present but at below-average levels. |
| Crown and seminal root health score | Moderate (2.1 out of 5) |
| Weeds | Weed levels were below average. Ryegrass, wild oats and brome grass were present |
| Comments | This group represents a major problem for the Western Region and warrants detailed study as a cohort, as there were group members from every year of the survey. Given that 35% of these crops were grown after canola, crop rotation alone will not address this yield gap. |
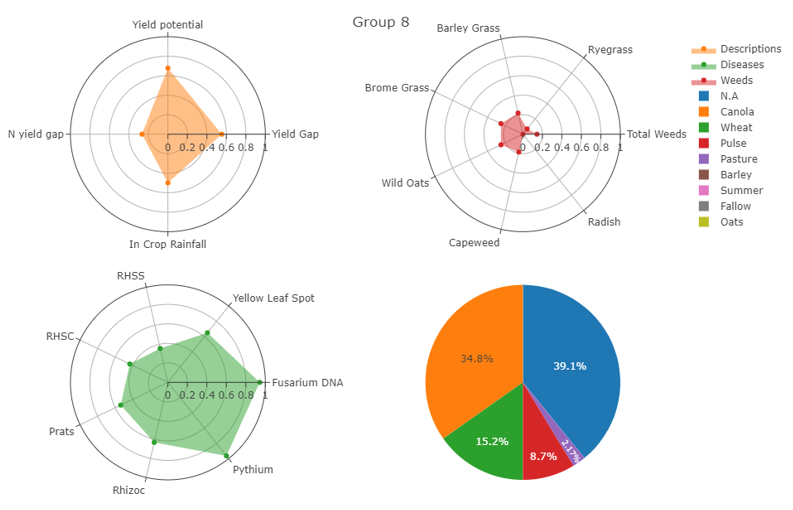
Figure 2. Descriptive, weed, disease and crop rotation attributes for Group 8.
Group 11 of 13 features
| % of crops in Group | 4% of all wheat crops. |
| Yield Potential | 6.2t/ha |
| Yield Gap | 3.0t/ha |
| Region | Western and Southern regions. |
| Rotation | Most of the crops in this group were grown after a cereal. |
| N nutrition | 80% of the yield gap can be attributed to insufficient N. |
| Disease | PredictaB: relatively high level of Fusarium, yellow leaf spot, Rhizoctonia and Pythium. |
| Crown and seminal root health score | Moderate level of disease |
| Weeds | Ryegrass was present at relatively high levels; brome grass and wild oats were also present. |
| Comments | Average in-crop rainfall was 256mm. |
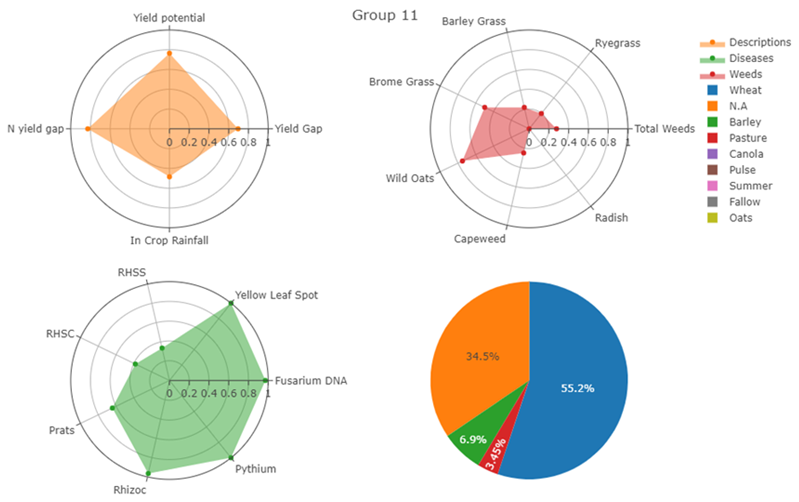
Figure 3. Descriptive, weed, disease and crop rotation attributes for Group 11.
Group 13 of 13 features
| % of crops in Group | 4% of all wheat crops. |
| Yield Potential | 8.2t/ha |
| Yield Gap | 4.5t/ha |
| Region | All three regions. |
| Rotation | Most of the crops in this group were grown after a cereal (28 out of 36 paddock records). |
| N nutrition | 67% of the yield gap can be attributed to insufficient N and under-fertilisation. |
| Disease | PredictaB: Moderate levels of Fusarium, Pratylenchus and Pythium. |
| Crown and seminal root health score | Moderate level of disease. |
| Weeds | Ryegrass and wild oats at moderate levels. |
| Comments | High in-crop rainfall (473mm). |
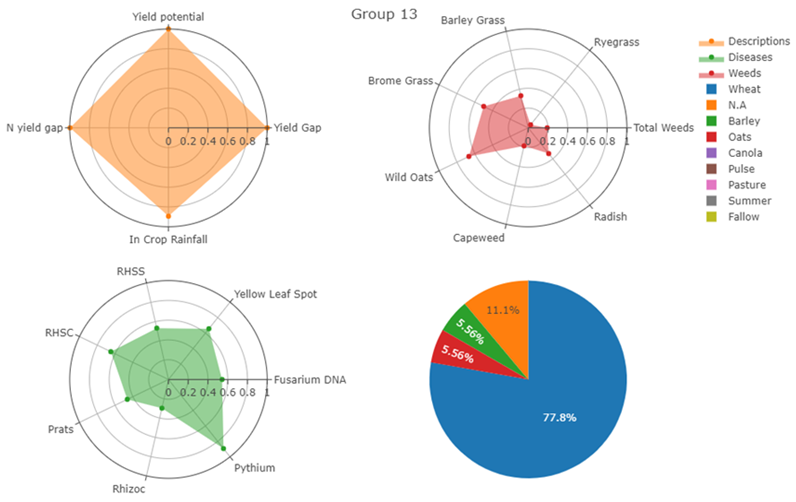
Figure 4. Descriptive, weed, disease and crop rotation attributes for Group 13.
Conclusion
The National Paddock Survey and yield gap analysis have demonstrated that yield gaps occur in one in three paddocks, when yield potentials are high and inadequate N is supplied. These problems can be compounded by cereal-dominant crop rotations and diseases such as Fusarium, Pythium, Praylenchus species, yellow leaf spot and Rhizoctonia. Importantly, sound crop rotation does not necessarily remove or reduce the disease risk in high-yielding situations.
Acknowledgments
We thank the consultants and growers who engaged with the National Paddock Survey. The research undertaken as part of this project is made possible by the significant contributions of growers through both trial cooperation and the support of the GRDC, the authors would like to thank them for their continued support.
References
Hochman Z, Gobbett D, Horan H, Garcia JN (2016). Data rich yield gap analysis of wheat in Australia. Field Crops Research 197, 97-106.
Terry Therneau and Beth Atkinson (2019). rpart: Recursive Partitioning and Regression Trees. R package version 4.1-15. https://CRAN.R-project.org/package=rpart
Van Rees H, McClelland, Hochman, Z, Carberry, P, Hunt J, Huth N, Holzworth D (2014). Leading farmers in South East Australia have closed the exploitable wheat yield gap: Prospects for further improvement. Field Crops Research 164, 1-11.
Contact details
Roger Lawes
CSIRO
147 Underwood Avenue, Floreat, WA 6014
08 9333 6455
roger.lawes@csiro.au
GRDC Project Code: BWD00025,