Budgeting phosphorus in medium and lower rainfall zones of southern NSW
Budgeting phosphorus in medium and lower rainfall zones of southern NSW
Take home messages
- Soil Colwell phosphorus critical values of wheat and canola to achieve 90 to 95% of maximum yield in southern NSW are 35 to 42 and 22 to 27 mg P/kg respectively
- Starter P applied at sowing consistently increases crop yield
- Soil pH and soil phosphorus buffering index (PBI) can impact on plant available phosphorus and consideration needs to be given to these factors
- Phosphorus stratification in soil can limit yield where most of the measured 0 to 10 cm phosphorus is actually located in the 0 to 5 cm layer, which is the most prone to drying. Colwell P values below 10 cm are less than 10 mg P/kg soil
- Phosphorus export from paddocks in grain is estimated at 2.7 to 3.6 kg P/t of wheat grain production and 4.0 to 6.5 kg P/t of canola seed production
- Phosphorus fertiliser savings after drought or a failed crop are possible where there has been an extensive P fertiliser history, and soil Colwell P values are above crop critical requirements.
- As a guide, in a one off exercise, one third of average crop P replacement can be applied down to a base level of not less than 5 kg P/ha in low yielding environments. This is possible because the bulk of the P supplied to crops is provided via the soil reserve and fertiliser P is primarily used to maintain the soil reserve.
Background
Phosphorus (P) is a significant annual fertiliser input for crop production in southern NSW. The extensive history of P application and mostly adequate to high soil Colwell P values in this region allow many farmers some flexibility in managing P inputs, particularly where cash flow may be limited. The flexibility in P management is also made possible as crop uptake of P is primarily from the soil reserve with a smaller but important component coming from starter P applied at sowing. In this paper we discuss both P considerations after drought and P cycling and uptake.
Phosphorus cycling
Soils of Australia in their native state are deficient in phosphorus (P) with some exceptions through northern NSW and Queensland (e.g. cracking clay soils) which have been depleted in more recent times through cropping. In many of the remaining soils of the cropping zone advisors aim to ensure P fertiliser has been added in amounts that approximately equal P exported in grain plus other losses such as unrecovered P in stubble and soil. P fertiliser that is added to the soil in cropping systems primarily goes into the ‘soil reserve’ where the P binds to soil minerals, a process referred to as P sorption or fixation. Fixation occurs when P reacts with other minerals to form insoluble compounds and becomes unavailable to crops. An important factor controlling P fixation is soil pH as shown in Figure 1. There are three peaks of P fixation. The two highest peaks occur in the acid range of pH 4 and 5.5, where P precipitates with iron and aluminium. It is very difficult to supply sufficient P for crop needs when P solubility is being controlled by iron and aluminium. The third peak occurs in alkaline soils around pH 8.0 when P is precipitated primarily by calcium. This fixation with calcium is relatively weak and it is generally more economical to apply more P fertiliser than adding amendments to acidify the soil (Figure 1).
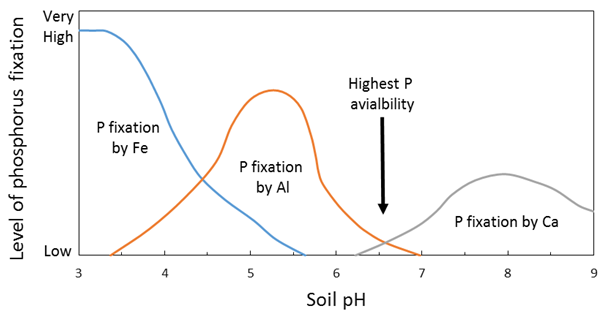 Figure 1. The effect of soil pH on phosphorus availability.
Various estimates indicate approximately 70–80% of P fertiliser added in the crop year becomes part of the soil reserve (Price 2006). The soil P reserve can be described further however for the purposes of this paper we will not provide extensive detail but simply acknowledge that within the soil P reserve there is different bonding of P that influences the short and long term plant available P (Figure 2). For example the soil reserve is made up of (1) sorbed P (P held on the surface of fine clay particles), (2) secondary P minerals (freshly bounded Fe, Al and Mn phosphates [acid soils] and Ca and Mg phosphates [alkaline soils]) and (3) primary P minerals (aged and crystallised Fe, Al, Mn, Ca and Mg phosphates). The soil P reserve (Figure 2) in P adequate soils (Table 2) provides the largest percentage of crop requirements in any one year which is estimated at ~30–80% (Price 2006, Mcbeath et al 2012). Phosphorus fertiliser can directly provide ~20–30% of crop requirements (Price 2006) with available P from stubble making up ~9–44% (Noack et al 2012) and roots ~21–26% (Foyjunnessa et al 2016).
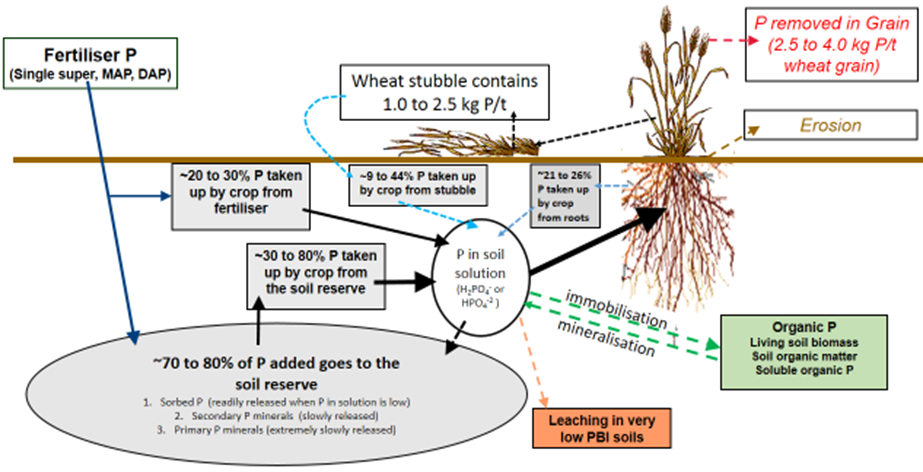 Figure 2. Soil phosphorus cycling in winter cropping systems.
Phosphorus Buffering Index (PBI)
The Phosphorus Buffering Index (PBI) test measures the P sorption of the soil. This is the process by which soluble P becomes adsorbed to clay minerals and/or precipitated in soil and it determines the partitioning of P between the solid (bound) and solution (readily plant available) phases of the soil. A high PBI therefore results in a greater tendency for P sorption compared with a soil with a low PBI. Consequently P sorption capacity of soil influences the availability of P to plants and can be useful for determining Colwell P critical values. Figure 3 shows the relationship between PBI and Colwell P critical values for wheat. Usually large changes in PBI values are required to change crop critical values. Examples of this are provided in Table 1 calculated from Moody (2007). In addition estimates are also provided from Bell et al (2016) which are quantified from a large data set in the Better Fertiliser Decisions Cropping database (BFDC).
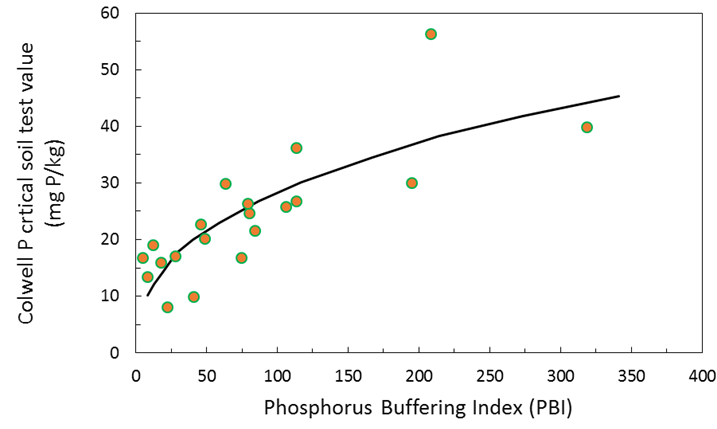 Figure 3. Effect of PBI on critical Colwell-P (0–0.10 m) required for 90% maximum grain yield of wheat. Critical Colwell P = 4.6 x PBI0.393 (Moody 2007).
Table 1. Estimated critical Colwell P soil values (mg P/kg soil) for 90% of maximum wheat grain yield when grown in soils with differing PBI (Moody 2007 and Bell et al 2013).
P Buffering | PBI | Estimated 90% critical P |
|---|---|---|
Extremely low | 10 | 11.4 |
Very very low | 20 | 14.9 |
Very low | 40 | 19.6 |
Low | 80 | 25.7 |
Moderate | 180 | 35.4 |
High | 350 | 46.0 |
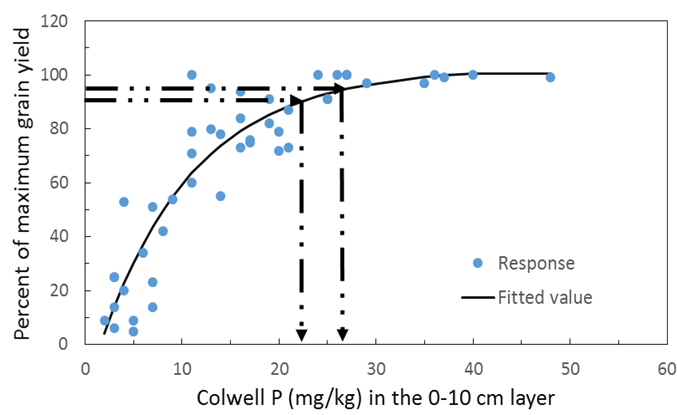 Figure 4. Grain yield response of canola across a range of soil types and States. The y axis is percent of maximum grain yield achieved and the x axis is the soil Colwell P test value. Data taken from the BFDC.
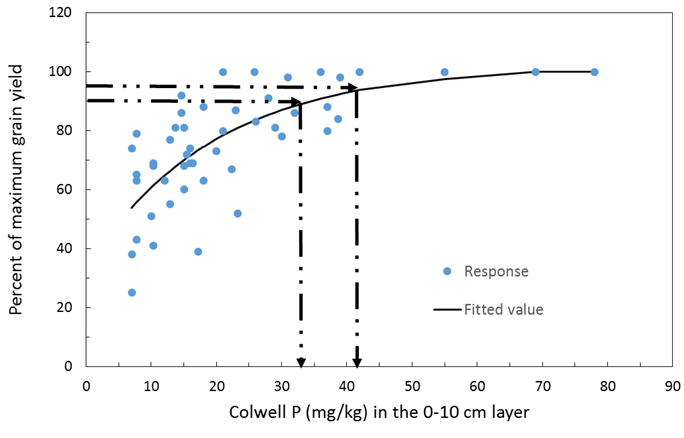 Figure 5. Grain yield response of wheat on red chromosol soils of NSW. The y axis is percent of maximum grain yield achieved and the x axis is the soil Colwell P test value. Data taken from the BFDC.
Critical Colwell P soil test values
The critical soil test range is the soil P status often measured as Colwell P that will ensure 90-95% of maximum crop production is achieved. This range may differ for different crop species and soil types that have a different PBI value. However, as the figures suggest not all points fit exactly on the line. This can be in part due to variation in seasonal conditions and stratification of P in the surface (0-5cm) when the whole top 10 cm soil section is sampled. Additional factors may include the type of equations used as small changes in slope near the asymptote (e.g. maximum yield) can make large changes to soil critical values on the x axis.
An analysis of data from the BFDC database using Mitscherlich equations indicates the 90 and 95% critical values for canola across soil types are estimated at 22 and 27mg P/kg soil using Colwell P at 0-10cm soil depth (Figure 4). The same comparisons for wheat on red chromosol soils indicates Colwell P critical values of 35 and 42 (Figure 5) and for vertosol soils 25 and 35 (Figure 6). Using the Mitscherlich equation provides a slightly higher estimate of critical value than those estimated directly from the BFDC database (Table 2) that use quadratic equations to estimate critical P, however there is still sound general agreement between the values provided above when comparing figures 4, 5 and 6 with Table 2. Consequently growers can have confidence in either using values from Table 2 or figures 4, 5 and 6.
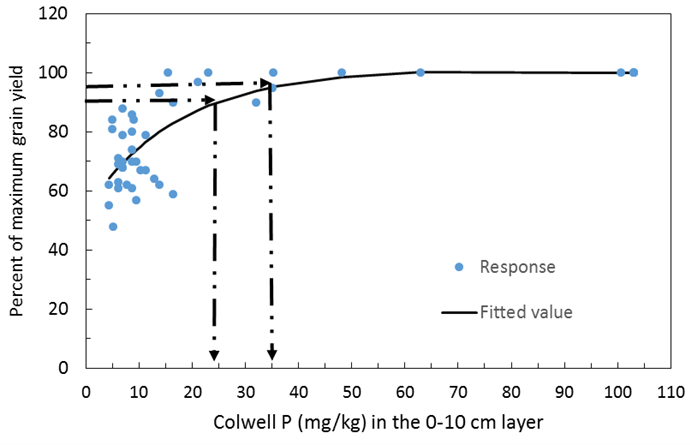 Figure 6. Grain yield response of wheat on Vertosol soils of NSW. The y axis is percent of maximum grain yield achieved and the x axis is the soil Colwell P test value. Data taken from the BFDC.
Table 2. Colwell P (mg /kg soil) values for 90 and 95% of maximum grain yield for various crop and soil type combinations extracted from the BFDC database. Estimated Colwell P critical values for chickpea, faba bean, lentil and broadleaf lupins are not available from the BFDC database due to no or insufficient data. Similarly, not enough data exists for feed barley, field pea, canola and narrow leaf lupin to provide specific soil type estimates of Colwell P critical values. Where States are nominated under ‘location’ this refers to the State where most of the experiments (not necessarily all) were conducted.
Species | Soil | 90% | 95% | Location |
|---|---|---|---|---|
Feed barley | All soils | 20 | 25 | National |
Field pea | All soils | 27 | 34 | National |
Narrow leaf lupin | All soils | 22 | 26 | National |
Canola | All soils | 20 | 25 | National |
Wheat | All soils | 24 | 32 | National |
Wheat | Chromosol red | 30 | 38 | NSW, Qld, Vic |
Wheat | Chromosol brown | 17 | 19 | WA, SA |
Wheat | Chromosol grey | 18 | 21 | WA |
Wheat | Calcarosol calcic | 24 | 29 | SA, Vic, WA |
Wheat | Dermosol | 27 | 35 | NSW |
Wheat | Kandosol red | 24 | 30 | NSW |
Wheat | Tenosol | 16 | 20 | WA, SA, Tas |
Wheat | Sodosol brown | 27 | 32 | NSW, Vic, SA |
Wheat | Vertosol black | 25 | 33 | NSW, Qld |
Wheat | Vertosol brown | 24 | 32 | NSW, SA |
Wheat | Vertosol grey | 18 | 21 | Vic, NSW, Qld |
The sampling depth of P has a significant effect on its critical value. For example, data from the BFDC on the national wheat data set showed that across soil types for sampling at 0-5cm, 0–10cm and 0–15cm Colwell P critical values varies from 31 and 36, 24 and 32 and 15 and 20mg/kg for 90% and 95% of maximum grain yield respectively. The differences in critical Colwell P at different sampling depths may be due to (i) differing soil P status at deeper un-sampled depths, (ii) dilution effects with greater soil sampling depth and P stratification and (iii) the ability of different crop types to recover of P from different depths of soil. Industry standard practice is to sample 0–10cm however knowing P concentrations in the 10–30cm layer can be very informative in P budgeting, potentially allowing for a lower wheat critical value in the surface layers.
P budgeting after drought and P off-take in grain
Phosphorus is exported in grain and recycled in stubble and roots provided the stubble component is retained. Phosphorus in wheat grain ranges from 2.7–3.9kg P/t while in canola seed the range is 3.9–7.8kg P/t (Table 3). Phosphorus in stubble for wheat and canola ranges from 1.0-3.0kg P/t and 2.0–4.0kg P/ha respectively. Root P concentrations in wheat and canola ranges from 1.5–3.0 and 2.0–2.5kg P/t respectively.
Table 3. Concentrations of phosphorus (kg/t) for wheat and canola grain samples selected from NVT sites. Values are expressed on a dry weight basis (Norton 2012; 2014).
State | NSW | NSW | NSW mean | SA | SA | SA mean | Vic | Vic | Vic mean |
|---|---|---|---|---|---|---|---|---|---|
Wheat | |||||||||
P in grain (mg/kg) | 2.7 | 3.6 | 3.1 | 3.1 | 3.9 | 3.4 | 2.9 | 3.6 | 3.2 |
Canola | |||||||||
P in grain (mg/kg) | 3.9 | 6.6 | 5.2 | 5.1 | 7.8 | 6.2 | 5.2 | 6.5 | 5.7 |
Approximations used for P budgeting in wheat include:
- Grain P export (2.7–3.6kg P/t) plus
- Stubble P not accessible to the following crop (0.4–0.8kg P/t) plus
- Soil losses (0.3–0.7kg P/t grain production).
This provides an estimated 3.6–5.5kg P required /t of grain production. Similarly for canola:
- Seed P export (4.0–6.5kg P/t) plus
- Stubble P not accessible (0.6–1.0kg P/t) plus
- Soil losses (0.3–0.7kg P/t grain production).
This provides an estimated 6.1–10.2kg P required /t of seed production.
On a per hectare basis the export of P for wheat and canola is approximately the same assuming canola has half the water use efficiency for grain production as wheat. These budgets are of course very approximate and they must be assessed and adjusted by tracking soil P values to determine if soil test values are increasing (overestimate of P budget), decreasing (under estimate of P budget) or remaining within the critical 90 and 95% range (P budget balance). After several years of soil testing and adjusting P inputs it is possible to ensure relatively stable soil P test values.
Starter P, often applied as MAP at sowing, is very important for; (i) early root development which assists the plant in exploring the greater soil P reserve, (ii) early tillering and (iii) early head development when potential grain number is set (e.g. at or just prior to DC30). Many phosphorus experiments have shown responses to starter P, however P savings can be made after drought especially where (a) December P export in grain is lower than P inputs at sowing and (b) soil Colwell P values are greater than soil critical values for the target species. In these circumstances one third of historical average annual P inputs can be applied down to a base level of 5kg P/ha. As an example if our wheat target yield for 2020 is estimated at 3 t/ha and the P budget is estimated to be 3.6-5.5kg P/t of grain production then we have a P budget of 10.8-16.5kg P/ha or 49-75kg/ha MAP. If we assume a medium value of 62kg /ha MAP (13.5kg P/ha) as our standard P budget we would reduce this by two thirds down to 18.6kg /ha of MAP or 4.1kg P/ha. This however does not meet the minimum amount rule of 5 P kg/ha so the actual rate of P applied in this case would be 5 kg P/ha (23 kg MAP/ha). At this 23 kg/ha MAP granules are placed in-row at ~3.0-3.5cm spacings when using 25 cm tyne spacing. Wheat sowing rates (50-65 kg/ha) are likely to place seed at every ~2-3cm in-row while the full MAP rate of 62 kg/ha provides an in-row granule spacing of ~1.0cm.
The exception to the above reduction in P budgets after drought applies to calcareous soils with high pH. Phosphorus savings in this example are not possible as the excess lime (calcium or magnesium carbonate) is not readily dissolve at high pH and serves as a P sink for surface adsorbed calcium phosphate precipitation. In addition the lime in calcareous soil reacts with P in soil solution to form calcium phosphate at the surface of the lime. The first process of P bonding occurs in dry condition and consequently P availability is low even in circumstance where P take-off has also been low. In these soils advantages in P supply are achieved with highly concentrated P bands with minimal soil mixing.
P budgeting and off-take in hay
P off-take in hay per hectare is higher than for grain production. Previously we estimated a 1 t/ha wheat crop would remove 2.7-3.6kg P/ha in grain while the hay crop is estimated to remove 1.0-2.0kg P/ha/t. The same comparisons for canola indicate a 1 t/ha grain crop exports 4.0-6.5kg P/ha in seed while the hay exports an estimated 3.0-4.0 kg P/ha/t. In some circumstance where significant hay yields are achieved (e.g. 6 t/ha) large amounts of P are removed (e.g. 6 to 12 kg P/ha for a 6 t/ha hay yield in wheat). Large variations in P off-take in hay are also likely due to hay quality and quantity as well as the proportion of unbaled straw and leaf remaining in the paddock. Note the unbaled leaf component for canola can be significant and rain on cut hay can leach plant available P into the soil. Phosphorus savings in 2020 after hay cut in 2019 are unlikely because of the higher P off-take and soil Colwell P values will have declined more significantly than grain paddocks.
Phosphorus stratification
There are several reasons why P is often highly stratified near the soil surface, including;
- In their native state, most Australian soils were deficient in P and farming systems have for the most part applied P in the top 0–10cm of soil
- P is highly reactive in soils binding with Fe, Al and Mn at low pH and Ca at high pH as well as bonding with small clay particles, consequently P is not readily leached in most soils
- Farming systems have shifted from intensive cultivation prior to sowing to no-till or minimum till systems and this has reduced soil mixing, and
- P in stubble retained systems is recycled to the soil surface.
An example of a stratified soil sampled in July 2017 is provided in figure 7 (Armstrong et al 2017). In this example, the ‘plant row’ has a Colwell P of ~55mg P/kg soil in the 0–2.5cm section and increases to ~62 in the 2.5–5cm section as sampling takes in the fertiliser drilled at sowing. At 5–10cm the Colwell P value drops to ~24 and declines further to ~10mg P/kg in the 10–15cm layer. The sampling ‘near row’ has no fertiliser spike in the 2.5–5cm section (e.g. ~37 ‘near row’ compared to ~62 ‘plant row’ in the 2.5–5cm section). The ‘middle row’ (inter-row) section shows very high Colwell P at the soil surface (~133mg P/kg soil on the 0–2.5cm section). This is most probably because the tyne on the plant row has thrown P rich surface soil into the inter-row space (e.g. middle row).
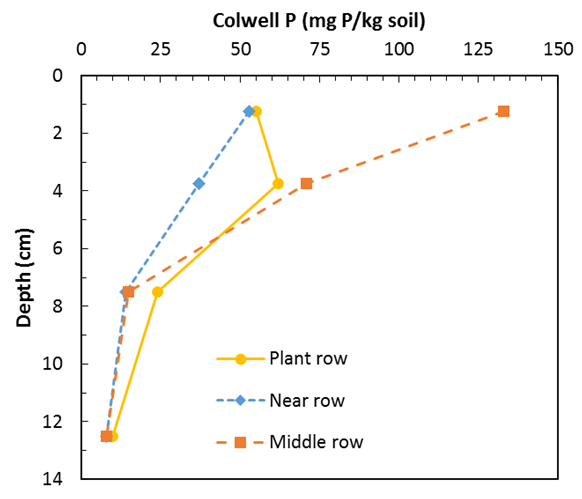 Figure 7. Vertical and horizontal stratification of P measured as Colwell P at the long term Hart experiment. Samples taken in 2017 (Armstrong et al 2017).
The calculated Colwell P 0 - 10cm from figure 7 for the plant row is ~40.5mg/kg. Where P is high stratified in the soil surface combined with low soil moisture, the question arises how much of this surface P (0-5cm) does the plant root access given a sowing depth of around 5cm and frequent drying of surface soil. In this scenario, let’s assume the plant does not access P in the top 0–2.5cm. In this case, the estimated Colwell P 0–10cm is 27.4mg P/kg soil. In most cases, this is still adequate P for 90% of maximum yield (Table 2) however, it highlights a number of very important issues including what is the relative efficiency of P access at different depths and soil moisture. In the above example (Figure 7), if we assume a 0–10cm Colwell P of 30 mg/kg instead of 40.5 mg/kg and the same proportion of P stratification is applied with no access to P in the 0–2.5cm layer then the Colwell P value becomes ~20mg P/kg soil. In this contrived scenario, crop yield may be limited by P. While the above scenario’s are simplistic (e.g. zero P access in the 0–2.5cm section) and the more likely outcome is low efficiency of P access in the 0–2.5cm, the point is clear that highly P stratified soils have the potential to limit yield particularly where P is highly stratified in the 0–2.5cm layer and this layer is subject to frequent drying. Figure 8 demonstrates the principle that P uptake can be limited by soil moisture and soil P status. This evidence supports the theory that a frequently drying surface soil with adequate subsoil moisture may respond to deeper placement of P.
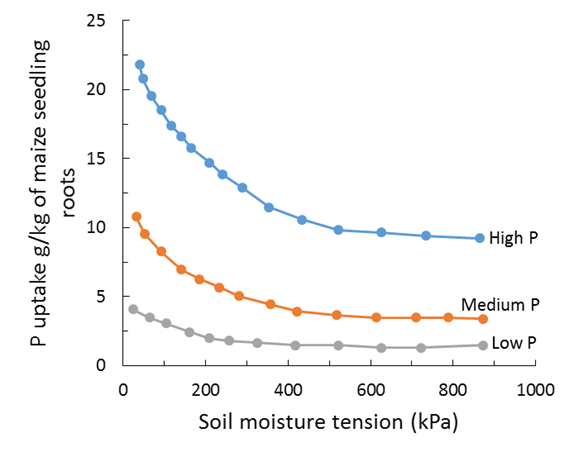 Figure 8. Phosphorus uptake in roots of maize to different soil moisture and soil phosphorus levels (Olsen et al 1961).
Phosphorus placement at sowing
Compared with broadcasting or banding fertiliser P with seed, the placement of phosphorus 2–6cm below seed has shown significant yield increases in 14 scientific studies (wheat: Alston 1976; Webb 1993; Sander and Eghball 1999; Singh et al 2005; Wilhelm 2005; canola: Grewal et al 1997; Hocking et al 2003; Wilhelm 2005; lupin: Jarvis and Bolland 1990, 1991; Crabtree et al 1998; Brennan 2001; Crabtree 1999; Scott et al 2003) and no significant increase in 5 scientific studies (Hudak et al 1989; Reeves and Mullins 1995; Bolland and Jarvis 1996; McCutcheon and Rzewnicki 2001; Vyn and Janovicek 2001). All of these studies placed P at depths less than 15cm values.
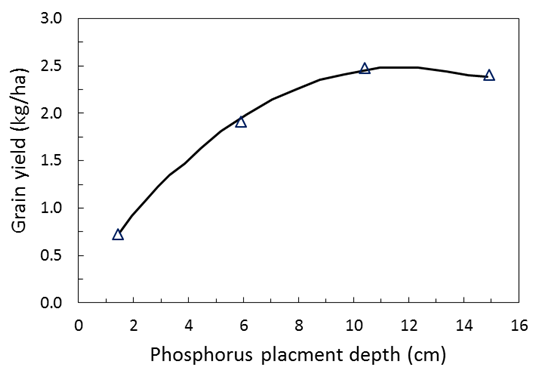 Figure 9. Effect of different depths of P placement at sowing on winter wheat yield in Nebraska (McConnell et al 1986).
A P placement study in Nebraska the optimum P placement depth was determined as 11.9cm (figure 9). Research in WA by Bolland and Jarvis (1990) found in the first year of sowing with single superphosphate the grain yield of wheat was increased by ~20% when the fertiliser was placed at 9cm below the soil surface, when compared to fertiliser placement at 3cm. In the second year, superphosphate increased grain yield by ~60% in lupins where the fertilizer had been placed 13 cm deep in the previous year compared with freshly drilled fertiliser at 3cm deep.
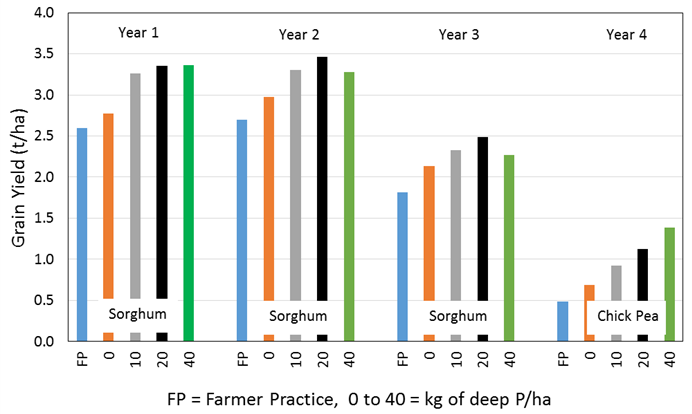 Figure 10. Deep P drill in year 1 (2013) at a depth of 20cm and row spacing of 50cm and the subsequent grain yield response over 4 consecutive years at Dysart QLD for sorghum and chickpea. No additional deep P was applied in subsequent years and annual P at sowing was 6kg/ha (Bell et al 2016).
Deep P
More recent research has focused on deeper placement (20cm) of P as MAP at 50cm row spacing in northern NSW and QLD. Figure 10 (Bell et al 2016) shows results from Dysart in Queensland where the deep P was drilled in 2013. The zero deep P rate represents deep drilling at 20cm with no deep P applied, while the farmer practise represents no deep drilling and no deep P. Therefore, the difference between these results is a tillage effect. The percent increase from the zero deep P rate to the best deep P response in each consecutive year was 17%, 11%, 7% and 59%. In year 2 (11% increase) and 3 (7% increase) nitrogen limited maximum yield production (Figure 10). Consequently, the P responses for years 2 and 3 may be considered conservative. In each treatment 6kg/ha of P was applied at sowing and this plus the soil reserve P was not expected to limit potential yield (Figure 10). A summary of deep P results (data not shown) indicates deep P applied as MAP at 20kg P/ha provided an average of 13% yield increase in wheat yield, 11% increase in chickpea grain yield based on 10 and 4 crop years of research respectively.
Cash flow approach to P budgeting
One-off P savings after drought or failed crop production are made possible because most P for crop production is drawn from the soil reserve. Because of this, P budgeting can be somewhat retrospective. As an example, this ‘somewhat retrospective’ approach firstly estimates the P budget based on long term rainfall and water use efficiency to produce likely average grain yield for wheat and the subsequent P budget (e.g. stored soil water = 30 mm, in season rainfall = 230mm, plant available soil water = 260 mm, soil evaporation = 110 mm, water use efficiency of grain production = 20 kg grain production per mm of crop transpired water, grain yield therefore = 3 t/ha, P budget ~13.5 kg P/ha is the long term average or 62 kg /ha MAP). The second component of the budgeting exercise requires the same approach above but applied to the season just passed. In this case let’s assume last year’s grain yield was 1.5t/ha and a retrospective P export and losses are estimated at 8.25kg P/ha (e.g. half the long term average). The final step is to average the two estimates for the coming seasons crop and in this example that is estimated at ~11kg P/ha (50 kg MAP/ha). The advantage of this approach is it considers both long term P budgeting to maintain soil P reserves and last year’s retrospective P export plus losses, which is also most likely to reflect cash flow. This simple model adds more P after higher yielding years and less P after low yielding years. The underlying assumption is that the soil Colwell P starting point is between 90 and 95% of crop critical P. Phosphorus inputs should always be assessed against soil test values to ensure input assumptions are maintaining Colwell P values in the critical range.
Conclusions
Maintaining soil phosphorus levels at or slightly above the critical range is important to maintaining crop yield potential and maximising water use efficiency.
Phosphorus budgets can be estimated from grain exports and other losses (e.g. soil and stubble) however the final amount of P to be added should be informed by accurate soil testing.
Very low or very high pH, high PBI and/or high surface P stratification (0-5cm) can reduce the availability of soil P to crops.
Fertiliser savings after drought are possible with P. This is because the extensive history of P application in southern cropping systems of NSW combined with low soil PBI’s to ensure that P can be supplied to crops from the greater soil reserve. In addition, the soil reserve supplies most of the P requirements of crops while fertiliser P only directly supplies a much smaller proportion (<30%).
Starter P should always be added to grain crops at sowing, as research has identified that this approach consistently increases crop yield.
References
Alston AM (1976) Effects of depth of fertilizer placement on wheat grown under three water regimes. Australian Journal of Agricultural Research 27, 1–10.
Armstrong R, Dunsford K, Robertson F, Mason S (2017). Understanding the stratification of nutrients in the southern region and developing appropriate fertiliser practices. Agriculture Victoria Research Millstone report number 4.
Bell MJ, Lester DW, Graham R, Sands D, Brooke G (2016) Phosphorus and potassium nutrition. In 'GRDC Adviser Update - 2016. Goondiwindi', Mar 2016.
Bolland MDA, Jarvis RJ (1990). Placing superphosphate at different depths in the soil changes its effectiveness for wheat and lupin production. Fertiliser Research. 22: (2), 97-107
Bolland MDA and Jarvis RJ (1996) Effectiveness of different methods of applying superphosphate for lupins grown on sandplain soils. Australian Journal of Experimental Agriculture 36, 707–715. Crabtree WL (1999) Deep placement of Mn fertiliser on a sandy soil increased grain yield and reduced split seed in Lupinus angustifolius. Plant and Soil 214, 9–14. doi: 10.1023/A:1004373430488
Brennan RF and Bolland MDA (2001) Comparing fertiliser phosphorus requirements of canola, lupin and wheat. Journal of Plant Nutrition 24, 1885–1900.
Crabtree WL. (1999) Deep placement of Mn fertiliser on a sandy soil increased grain yield and reduced split seed in Lupinus angustifolius Plant Soil. 214 9–14.
Crabtree WL, Robson AD, Ritchie GSP (1998) Drying of surface soil decreased Lupinus angustifolius root length and manganese uptake in a split-root experiment. Australian Journal of Agricultural Research 49, 1119–1123.
Foyjunnessa AC, McNeill A, Doolette A, Mason S, McLaughlin M (2016). Use of 33P to trace in situ the fate of canola below-ground phosphorus, including wheat uptake in two contrasting soils. Crop and Pasture Science 67, 726-738.
Grewal HS, Lu Z, Graham RD (1997) Influence of subsoil zinc on dry matter production, seed yield and distribution of zinc in oilseed rape genotypes differing in zinc efficiency. Plant and Soil 192, 181–189.
He M, Dijkstra FA (2014). Drought effect on plant nitrogen and phosphorus: a meta‐analysis. New Phytologist. 204, 924-931.
Hocking PJ, Mead JA, Good JA, Diffey SM (2003). The response of canola (Brassica napus L.) to tillage and fertiliser placement in contrasting environments in southern New South Wales. Australian Journal of Experimental Agriculture 43, 1323–1335.
Hudak C, Stehouwer R, Johnson J (1989). An evaluation of K rate, placement and tillage systems for soybeans. Journal of Fertilizer Issues 6, 25–31.
Jarvis RJ and Bolland MDA (1990). Placing superphosphate at different depths in the soil changes its effectiveness for wheat and lupin production. Fertilizer Research 22, 97–107. doi: 10.1007/BF01116183
Jarvis RJ and Bolland MDA (1991). Lupin grain yields and fertiliser effectiveness are increased by banding superphosphate below the seed. Australian Journal of Experimental Agriculture 31, 357–366.
Price G, (2006). Australian Soil Fertiliser Manual. Fertiliser Industry Federation of Australia Inc. CSIRO Publishing.
Mcbeath TM, McLaughlin MJ, Kirby JK and Armstrong R, (2012). The effect of soil water status on fertiliser, topsoil and subsoil phosphorus utilisation by wheat. Plant and Soil 358(1-2).
McConell SG, Sander GH, Peterson GA (1986). Effect of Fertilizer Phosphorus Placement Depth on Winter Wheat Yield. Soil Science Society of America Journal. 50 (1) 148-153.
McCutcheon J, Rzewnicki P (2001). Placement of P and K on corn. Special Circular. Ohio Agricultural Research and Development Center, Ohio State University, Wooster, OH. pp. 80–81.
Moody PW (2007) Interpretation of a single-point buffering index for adjusting critical levels of the Colwell soil P test. Australian Journal of Soil Research 45, 55–62.
Nable RO and Webb MJ (1993). Further evidence that zinc is required throughout the root zone for optimal plant growth and development. Plant and Soil 150, 247–253.
Noack S, McLaughlin M, Smernik R, McBeath T, Armstrong R (2012) Crop residue phosphorus: speciation and potential bio-availability. Plant and Soil 359, 375–385.
Norton RM, (2012). Wheat grain nutrient concentrations for south-eastern Australia. "Capturing Opportunities and Overcoming Obstacles in Australian Agronomy". Edited by I. Yunusa. Proc. 16th Australian Agronomy Conference 2012, 14-18 October 2012, Armidale, NSW.
Norton RM, (2014). Canola seed nutrient concentration for southern Australia. In Ware AH and Potter TD (eds) 18th Australian Research Assembly on Brassicas (ARAB 18). Tanunda, 2014. Proceedings. Australian Oilseed Federation, p 1-6.
Olsen SR, Watanabe FS, Danielson RE (1961). Phosphorus absorption by corn roots as affected by moisture and phosphorus concentration. Soil Science Society Proceedings 1961. Soil Science Society of America Journal, 289-294.
Price G, (2006). Australian Soil Fertiliser Manual. Fertiliser Industry Federation of Australia Inc. CSIRO Publishing.
Reeves DW and Mullins GL (1995). Subsoiling and potassium placement effects on water relations and yield of cotton. Agronomy Journal 87, 847–852.
Sander DH and Eghball B (1999). Planting date and phosphorus fertiliser effects on winter wheat. Agronomy Journal 91, 707–712.
Scott BJ, Carpenter DJ, Braysher BD, Cullis BR, Evans CM (2003). Phosphorus fertiliser placement for lupins in southern New South Wales. Australian Journal of Experimental Agriculture 43, 79–86.
Singh DK, Sale PWG, Routley RR (2005). Increasing phosphorus supply in subsurface soil in northern Australia: rationale for deep placement and the effects with various crops. Plant and Soil 269, 35–44.
Simpson RJ, Richardson AE, Nichols SN, Crush JR (2014). Pasture plants and soil fertility management to improve the efficiency of phosphorus fertiliser use in temperate grassland systems. Crop and Pasture Science 65: 556-575.
Smith CJ, Chalk PM (2018). The residual value of fertiliser N in crop sequences: An appraisal of 60 years of research using 15N tacer. Field Crops Research 217 (2018) 66–74.
Wilhelm NS (2005). Deep placement of nutrients—few excuses left not to recommend it. In ‘Eyre Peninsula Farming Systems 2005 Summary’ pp. 126–127. (South Australian Research and Development Institute: Urrbrae, S. Aust.).
Vyn TJ and Janovicek KJ (2001). Potassium placement and tillage system effects on corn response following long-term no till. Agronomy Journal 93, 487–495.
Acknowledgments
The research undertaken as part of this project is made possible by the significant contributions of growers through both trial cooperation and the support of the GRDC, the author would like to thank them for their continued support. This research was undertaken as part of project UQ82.
Contact details
Graeme Sandral
NSW DPI, Wagga Wagga Agricultural Institute
Ph: 0409 226 235
Email: graeme.sandral@dpi.nsw.gov.au
Twitter handle: @gsandral
GRDC Project Code: UOQ1905-009RTX,
