Can ‘stabilised’ and controlled-release N deliver improved N use efficiency when applied in concentrated bands?
Can ‘stabilised’ and controlled-release N deliver improved N use efficiency when applied in concentrated bands?
Author: Chelsea Janke (University of Qld), Phil Moody (Qld Dept of Environment and Science), Ryosuke Fujinuma (International Christian University, Japan), Michael Bell (University of Qld) | Date: 04 Mar 2020
Take home messages
- New fertiliser technology offers opportunities to reduce environmental losses of N, but achieving better crop N recovery will be the key to its adoption by the grains industry. The fertiliser application method may need to vary for different types of products
- Urease inhibitors can be effective with surface broadcast applications, but offer limited N use efficiency benefits when applied in sub-surface fertiliser bands. Exceptions may be when substantial denitrification losses are expected within 2 – 3 weeks of application
- Nitrification inhibitors applied in banded fertilisers are more likely to be effective in soils with low permeability and high cation exchange capacity. These soils support limited distribution of N (both as urea and ammonium-N) from the fertiliser band and keep the inhibitor and substrate (ammonium-N) closer together
- Polymer-coated urea should only be used to provide a regulated base N supply. Neighbour-granule interactions that occur in banded applications may slow N release to longer than expected time frames, although more work is needed. Further, a relatively high soil moisture content is necessary to enable release of N from granules. If soil moisture is too high, N may release too quickly and be at risk of denitrification and/or leaching losses. Conversely, if soil moisture is very low, N may remain ‘locked-up’ within polymer granules.
Introduction
Declining soil fertility has increased reliance on nitrogen (N) fertiliser inputs to maintain crop yields. However, increasing awareness of the potential impacts of fertiliser N moving off-site has stimulated public concern and discussion about regulation of N-fertiliser use in agricultural industries. The Australian fertiliser industry now offers a range of ‘enhanced efficiency fertilisers’ (EEFs) which aim to improve the timing of N supply relative to crop demand via a suite of technologies that utilize ‘stabilising’ compounds or controlled-release properties. However, many of these products were developed for the highly regulated European market, with soils, climates and agricultural practices not representative of Australian farming conditions. In particular, the practice of broadcasting fertiliser has been increasingly replaced by fertiliser banding in Australia, as a strategy for improving nutrient access by crop roots and for benefits associated with reduced tillage.
This study aimed to investigate several urea-based EEF products in soils and conditions that are representative of QLD agricultural regions to determine if, and in what scenarios, these products may be effective when applied in fertiliser bands. Urea-based products tested included Green Urea NV™ (added urease inhibitor, UI), ENTEC® (added nitrification inhibitor, NI) and Agromaster Tropical® (polymer-coated urea, PCU), and were compared to granular urea as the industry standard.
Methods
This paper combines results from a laboratory diffusion incubation and a field experiment to provide insight into fertiliser band dynamics that is both mechanistic and indicative of field performance.
Laboratory diffusion incubation
Two soils were collected from the top 10 cm of cropped fields in the Bundaberg region, comprising a yellow Dermosol and black Vertosol. These soils differed in their physico-chemical properties and texture (Table 1), allowing us to investigate the effects of varying soil type on EEF dynamics.
Table 1. Chemical and physical characteristics of soils used in the diffusion incubation. The pH and EC values were derived from a 1:5 (soil:water) measurement, while pHBC refers to the pH buffering capacity, CEC is the cation exchange capacity and concentrations of both ammonium (NH4+) and nitrate (NO3-) mineral N species are reported.
Soil Order | pH | EC (dS m-1) | pHBC | Particle size analysis (%) | CEC Exchangeable cations | NH4-N (mg kg-1) | NO3-N (mg kg-1) | Gravimetric water content (g g soil-1) | |||
|---|---|---|---|---|---|---|---|---|---|---|---|
Coarse sand | Fine sand | Silt | Clay | ||||||||
Dermosol | 6.30 | 0.07 | 1.32 | 38 | 46 | 9 | 9 | 4.5 | 3.2 | 6.8 | 0.12 |
Vertosol | 7.15 | 0.35 | 3.51 | 5 | 26 | 21 | 52 | 28.5 | 4.8 | 8.5 | 0.32 |
Approximately 3 kg of air-dry soil (< 2 mm) was placed in round incubation pots (225 mm diameter and 5cm deep). Three cotton wicks (4.5 cm lengths of natural cotton cord) were inserted in an offset pattern at varying distances of 1-3 cm, 3-5 cm, 5-7 cm, 7-9 cm, and 9-11 cm from the fertiliser band (0-1 cm), while a single wick was placed in the fertiliser band. Nitrogen-fertiliser treatments were applied in a vertical ‘band’ in the centre of the pot at an in-band concentration equivalent to that from N-fertiliser applied at 150 kg N ha-1 in bands spaced 1.8 m apart – a rate typical of the sugar industry. The N-fertiliser treatments described in this paper include: (i) standard granular urea; (ii) Green Urea NV, which is granular urea coated with the UI, N-(n-butyl) thiophosphoric triamide (NBPT); (iii) ENTEC, which is granular urea coated with the NI, 3, 4-dimethyl pyrazole phosphate (DMPP); and (iv) Agromaster Tropical, which is a PCU with a reported release period of 90 days. Replicated incubation pots were sealed and maintained at a moisture content equivalent to field capacity (± 5 %) and an ambient temperature of 25°C (±2°C).
Destructive sampling occurred 2, 5, 9 and 16 days after incubation (DAI) for urea and inhibitor treatments and at 2, 10, 20 and 35 DAI for PCU. Soil was sampled in concentric rings 2 cm in diameter out from the central 1 cm band. Each increment was thoroughly mixed and analysed for pH1:5w, EC1:5 and 2M KCl-extractable ammonium (NH4+) and nitrate (NO3-). Wicks were removed and bulked for each ring, extracted using ultra-pure water, and analysed for urea, NBPT and DMPP.
Field experiment
The field experiment was conducted at the Gatton Campus research station of the University of Queensland on a black Vertosol (Table 2).
Table 2. Chemical and physical characteristics of the field soil where pH and electrical conductivity (EC) refer to 1:5 (soil:water) measurement; cation exchange capacity (CEC); total organic carbon (TOC); nitrate (NO3-) and mineral N species are reported
Soil Order | pH | EC | Particle size analysis (%) | CEC | Mineral N | NO3-N | TOC | |||
|---|---|---|---|---|---|---|---|---|---|---|
Coarse sand | Fine sand | Silt | Clay | |||||||
Vertosol | 7.8 | 0.07 | 3 | 16 | 21 | 62 | 49.3 | 2 | <1 | 1.13 |
Fertiliser treatments included: (i) granular urea; (ii) Green Urea NV; (iii) ENTEC; and (iv) Agromaster Tropical. These fertiliser treatments were applied at in-band concentrations equivalent to 150 kg N ha-1 at row spacing of 1.8 m (27 g N m-1), while additional treatments for urea and ENTEC were included at in-band concentrations equivalent to 50 and 100 kg N ha-1. Fertiliser bands were placed at a depth of 12.5 cm in plots that were 10 m long with 2.5 m between treatments, with four replications.
At each sampling time, a vertical ‘face’ was excavated at right angles to the fertiliser band to a depth of 30 cm. The resulting slab of soil was sectioned into nine 5×5 cm zones of varying height, depth and lateral distances from the fertiliser band. Zones analysed included: (1) 7.5 – 12.5 cm directly above; (2) 2.5 – 7.5 cm at 45° above; (3) 2.5 – 7.5 cm directly above; (4) 7.5 – 12.5 cm lateral horizontal distance; (5) 2.5 – 7.5 cm lateral horizontal distance; (6) band zone (designated the ‘fertosphere’): 0 – 2.5 horizontal and vertical; (7) 2.5 – 7.5 cm at 45° below; (8) 2.5 – 7.5 cm directly below; and (9) 7.5 – 12.5 cm directly below (where cm refers to distance from the centre of the band zone). Individual soil samples (i.e., each segment) were tested using the same analytical procedures as outlined for the diffusion incubation.
Results and discussion
Standard urea (granular)
Rapid hydrolysis of a urea band resulted in significant localized increases in pH (>9.0), electrical conductivity (EC, 1.5 – 2.5 dS m-1) and aqueous ammonia (NH3, 10 -30 mg L-1), with the magnitude and extent of chemical changes dependent on soil type. These changes resulted in a zone of nitrification inhibition that was observed within and around the fertosphere (soil within 0.01 m of the fertiliser band, Figures 1, 2) in all soils. The impacted zone was greater in coarse-textured, low CEC soils like the Dermosol (Figure 1), that supported greater diffusion of solutes out from the band. In the field, N persisted predominantly as ammonium-N (NH4-N) from within the fertosphere to 12.5 cm below the band and 7.5 cm horizontally for up to 34 days, although nitrification had commenced by 21 days (Figure 2). It’s likely that significant rainfall (139 mm) between 21 and 34 days in the field study leached or denitrified a considerable portion of the existing nitrate–N (NO3-N). However, renewed nitrification after the heavy rain saw concentrations of NO3-N increase by the sampling at 49 days, and remain relatively high at approximately 100 mg N kg-1 soil by 71 days within the fertosphere and immediately below.
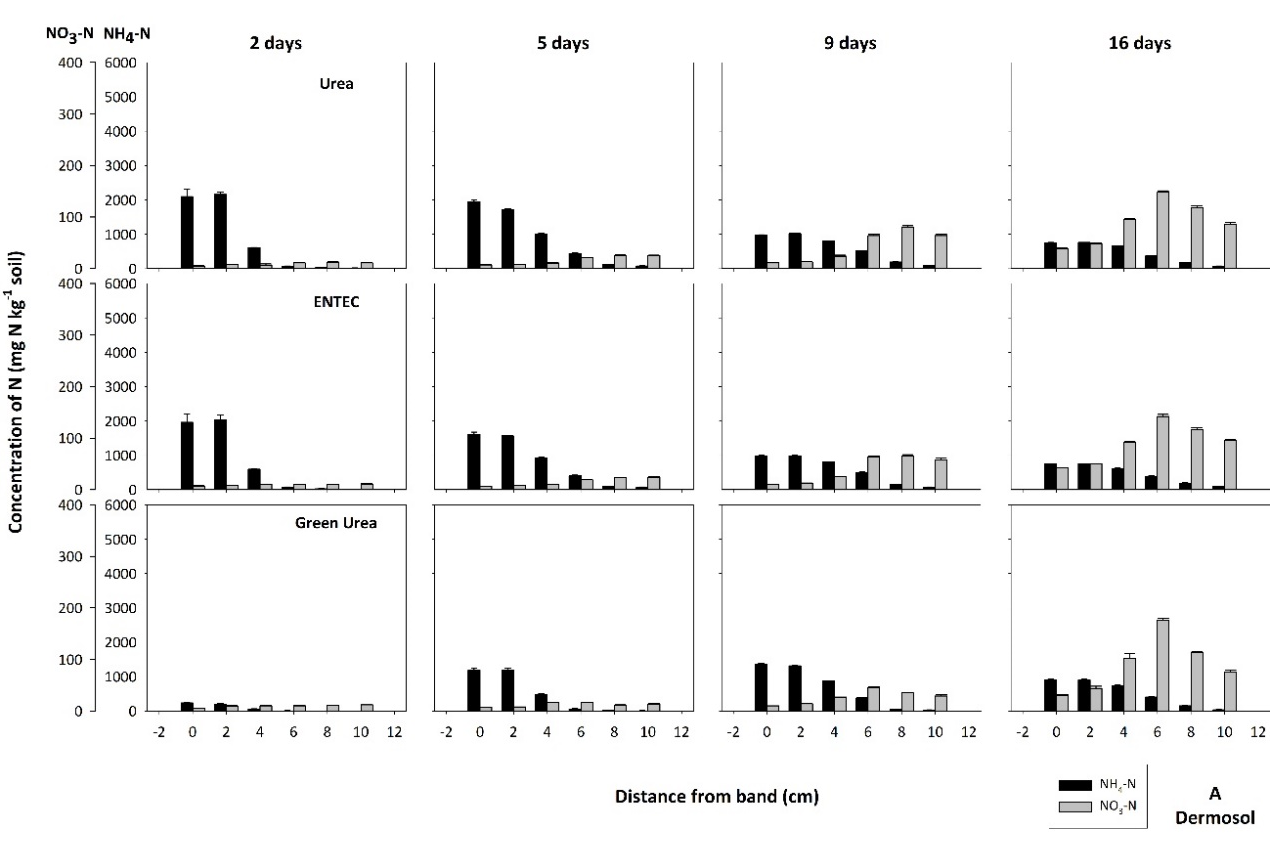
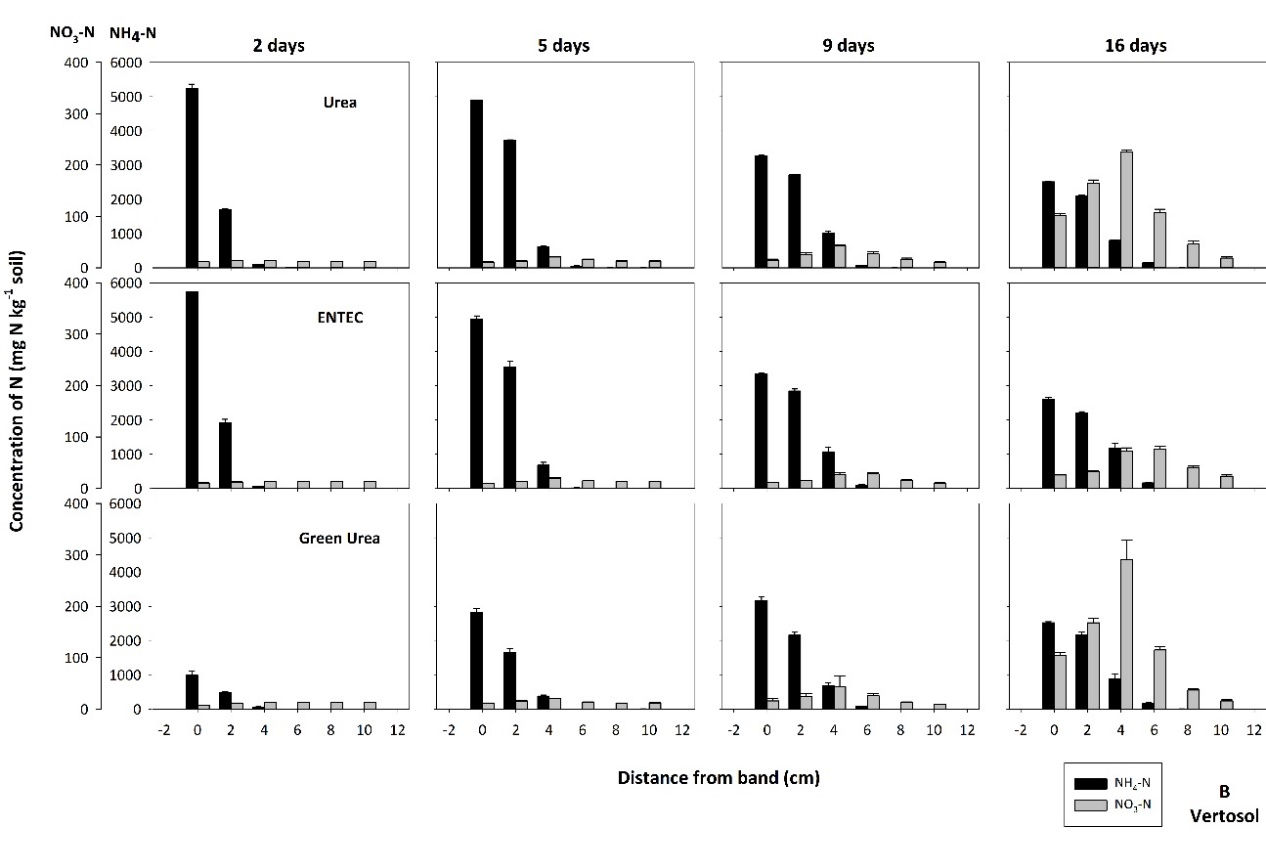 Figure 1. The concentration and distribution of ammonium-N and nitrate-N from bands of urea, ENTEC and Green Urea in the (A) Dermosol and (B) Vertosol of the laboratory diffusion study. Standard error bars of means for each data point are presented.
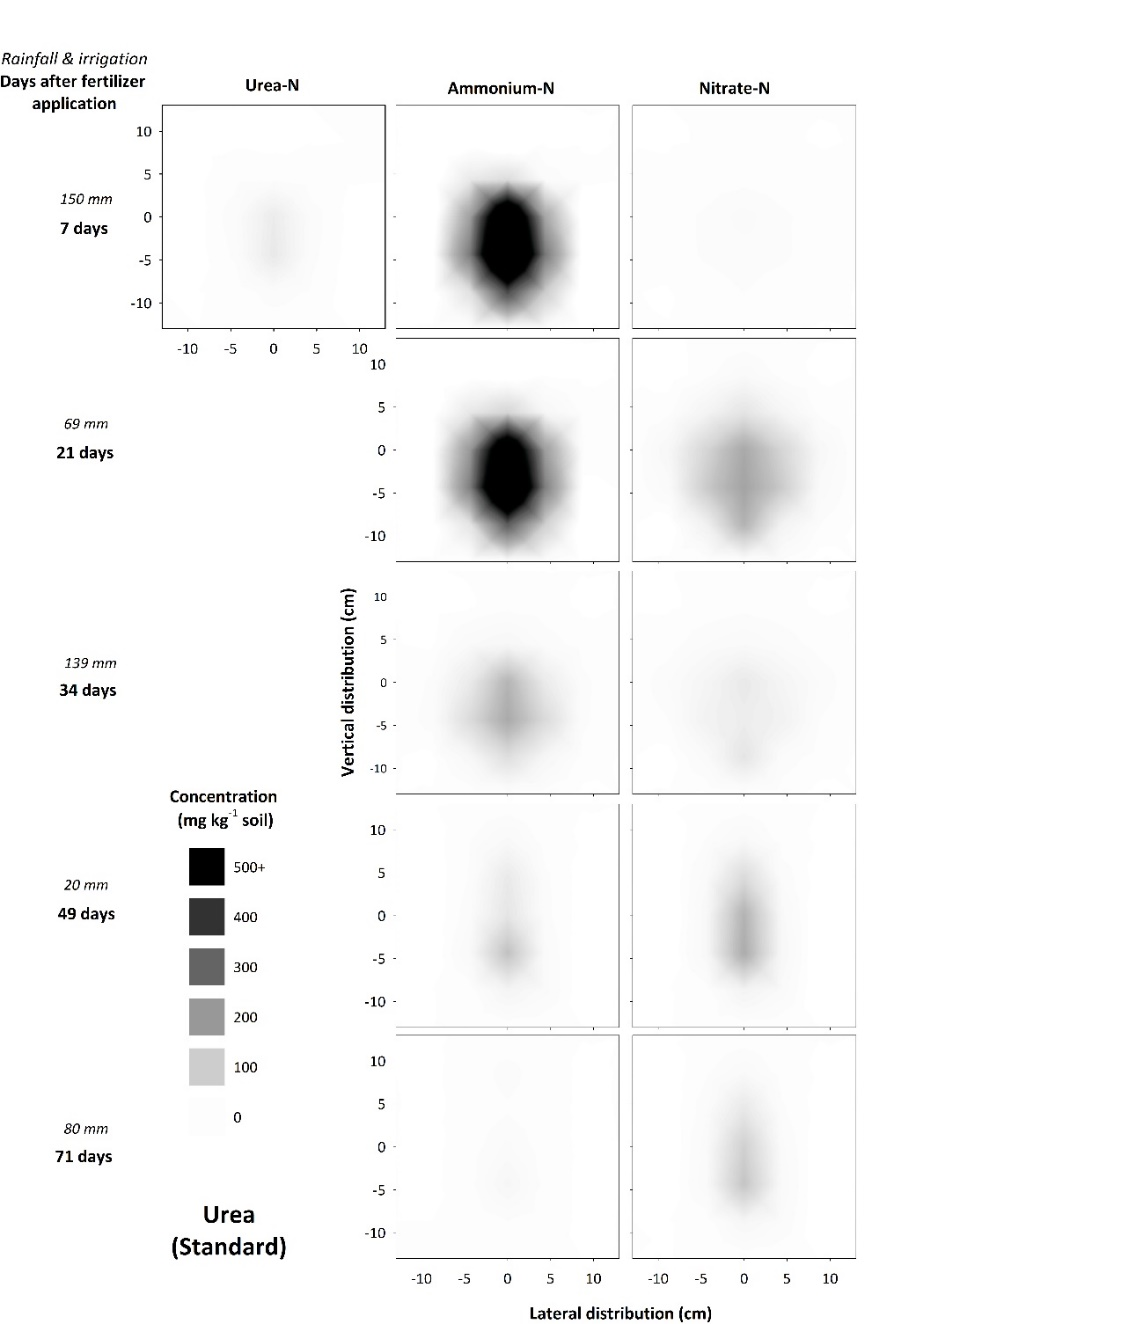 Figure 2. Concentration and distribution of urea-N, ammonium-N and nitrate-N over time in the profile of a Vertosol (field experiment) treated with granular urea.
Urease inhibitor: NBPT
The urease inhibitor (UI) in Green Urea slowed urea hydrolysis for up to 7 – 21 days (Figures 1, 3), with this urea-preservation effect most notable at 7 days in the fertosphere (compare urea heat map in Figure 2 vs Figure 3). This is consistent with studies of broadcast / incorporated application (approximately 7 – 14 days inhibitor efficacy) and indicates UI efficacy is not influenced by banding. Urease inhibitors may therefore prevent denitrification in the event of substantial rainfall within a week following fertiliser application, by preventing transformations of urea to NH4+ and then NO3-. However, this product will not prevent leaching of N, as even in this Vertosol soil there was evidence of leaching of N deeper into the soil profile with Green Urea (Figure 3 v’s urea in Figure 2). This can be due to leaching of preserved urea alone, as well as more rapid nitrification caused by less inhibitory changes in soil chemistry (i.e., pH, EC and aqueous NH3) in and around the band, enabling rapid nitrification and leaching of NO3-.
The use of UIs may therefore be potentially of benefit in regions of the grains industry where more rapid movement of N into deeper soil layers is desirable (e.g., from top-dressed applications during a fallow), but could exacerbate N losses in soils with high leaching potential. Additionally, the delayed urea hydrolysis slowed the formation of aqueous NH3 so that concentrations in UI treated bands never achieved the same concentration as with standard urea. While these lower aqueous NH3 concentrations would indicate a reduced risk of volatilization losses from broadcast / surface applied N-fertilisers, reductions in volatilization from buried fertiliser bands are likely to be minimal. Urease inhibitors may provide some benefit when fertiliser is co-applied with NH3-sensitive seed, although this was not tested in this study.
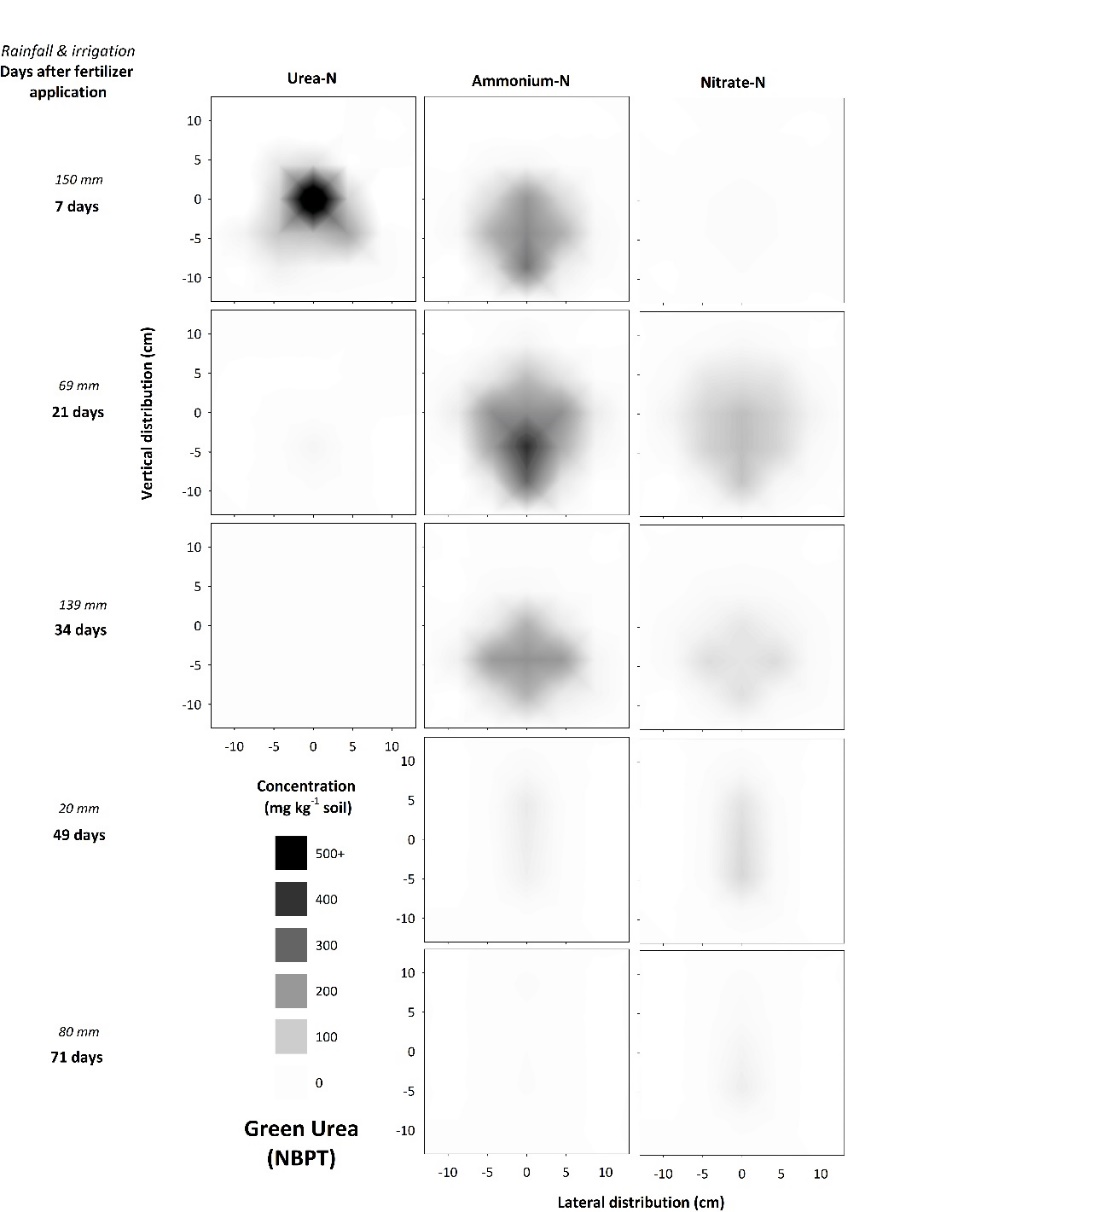 Figure 3. Concentration and distribution of urea-N, ammonium-N and nitrate-N over time in the profile of a Vertosol (field experiment) treated with Green Urea.
Nitrification inhibitor: DMPP
Soil properties which dictate solute movement were the dominant factors influencing nitrogen inhibitor (NI) efficacy. In soils where diffusion is limited (i.e., the Vertosol with low permeability and high CEC), the movement of N out of the fertosphere was restricted (Figure 1). As chemical changes due to urea hydrolysis dissipate, the zone of nitrification is more closely aligned to inhibitor distribution (approximately 1 cm from fertosphere) in these soils than in soils like the Dermosol where greater diffusive movement occurs (Figures 1, 4). Grain-growing regions with soils that are of low permeability and have high CEC (i.e., Vertosols of the northern grains region) will therefore receive the greatest NUE benefits from banded NIs.
In these soils, N is preserved in NH4+ form close to the zone of application (Figure 5), reducing the risk of denitrification loss in heavy rainfall events following fertilisation when compared with standard urea. In this N-form leaching losses will also be minimised because of its retention on the cation exchange complex. In contrast, banded NI applications in soils that support rapid diffusion (i.e., coarse-textured soils with low CEC) are not likely to achieve significant NUE benefits due to rapid separation of substrate (NH4+) and inhibitor. Interestingly, in the field experiment, inhibitory effects on nitrification in ENTEC-treated soil (Figure 5) were observed for approximately 30 days longer than with standard urea (Figure 2). This is considerably longer than inhibitory effects reported from broadcast / incorporated application. This could be due to the very high inhibitor concentrations found in the band environment (as compared with individual granules mixed through soil, as with broadcast/incorporated applications) and/or preservation of the inhibitor due to hostile band conditions (i.e., alkalinity, salinity and high aqueous NH3 concentrations) limiting microbial degradation. This is the subject of on-going investigation. Regardless, the net effect was preservation of high NH4-N concentrations in and around the band for at least 2.5 months under hot, wet summer conditions. This preservation will have large impacts on movement of N into deeper soil layers with rainfall/irrigation, and potentially increase the risk of fertiliser N remaining trapped in the shallow topsoil layers, inaccessible to plant roots once these layers dry.
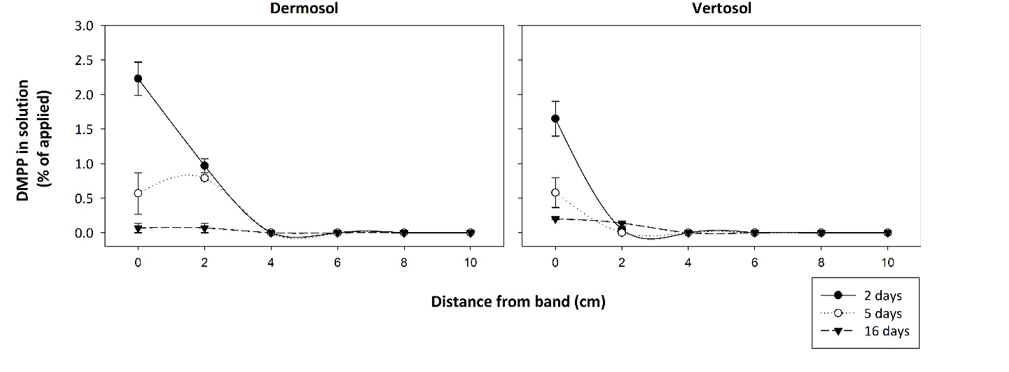
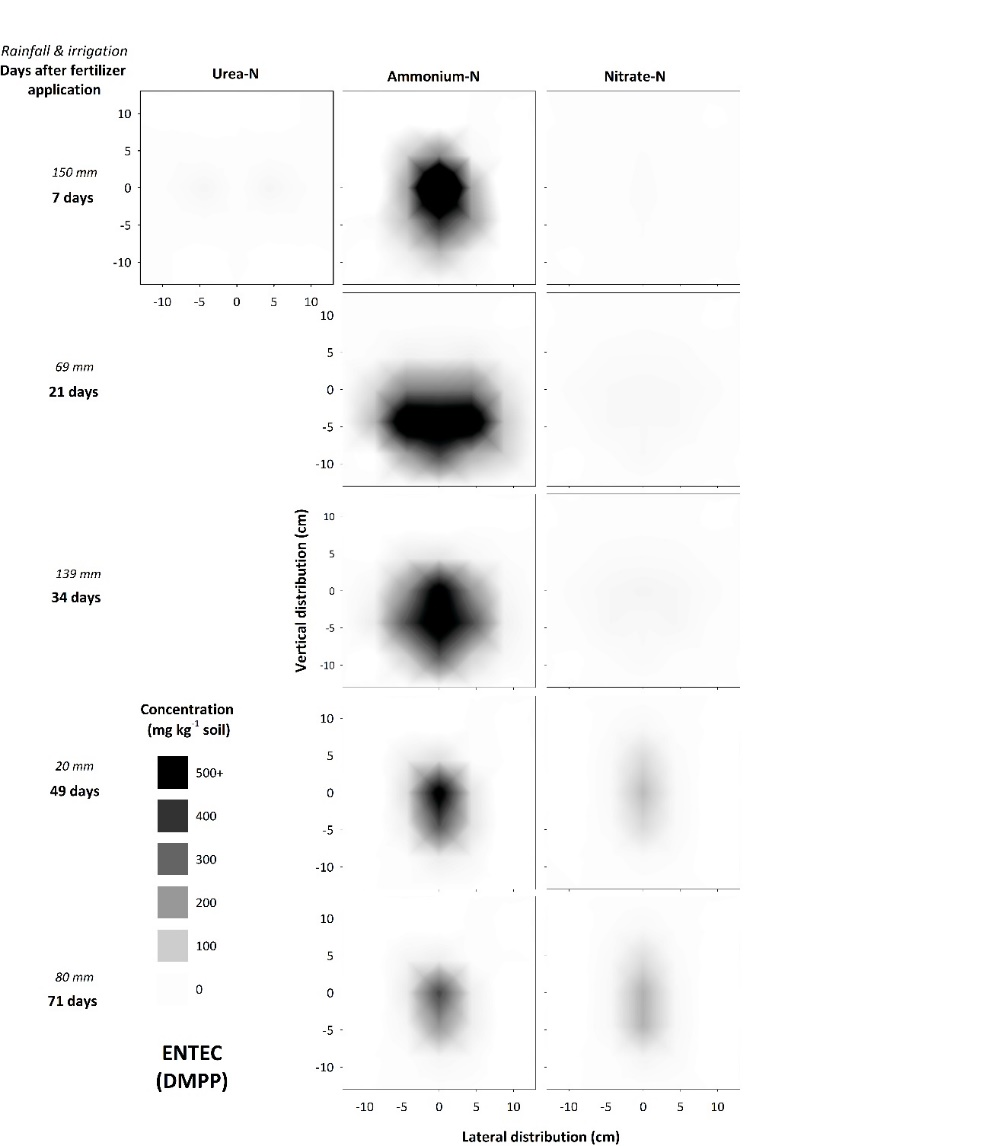 Figure 5. Concentration and distribution of urea-N, ammonium-N and nitrate-N over time in the profile of a Vertosol (field experiment) treated with ENTEC applied at a rate of 150 kg N ha-1.
Lower rates of ENTEC application resulted in lower concentrations and reduced movement of N from bands, and inhibitory effects (both induced by ureolytic activity and conferred by DMPP) were not as persistent (Figure 6). While concentrations of NH4-N increased with increasing fertiliser application rate, at 7 days NO3-N concentrations were similar between the application rates (data not shown). This is indicative of inhibitory effects associated with urea hydrolysis but may also be partly due to loss of NO3-N following rainfall after fertiliser application. By 21 days, the concentration of NH4-N in urea bands applied at 50 and 100 kg N ha-1 had declined but remained high in bands of ENTEC applied at the same rates (Figure 6). This indicates that DMPP had begun to take effect in bands applied at these rates. For ENTEC applied at 50 kg N ha-1, inhibitory effects associated with DMPP were greatest at this time (Figure 6). Similar comparisons of NH4-N in standard urea bands with that of ENTEC bands applied at the same rates indicated that DMPP was most effective at 34 and 71 or more days for fertiliser rates of 100 and 150 kg N ha-1, respectively (Figure 6).
Interestingly, concentration of NO3-N and total mineral N (i.e., plant available N) were identified in soil profiles treated with 100 and 150 kg N ha-1 from approximately 34 days (Figures 5, 7). This indicates that application rates of ENTEC may be reduced by as much as 50 kg N ha-1 without adversely influencing N availability for crops. However, N availability was substantially lower over the initial 34 days in soil treated with ENTEC at 100 kg N ha-1 (when compared with 150 kg N ha-1), thereby limiting the suitability of reduced fertiliser rates to crops/scenarios where N supply is not critical for the first month following fertiliser application. This delay in plant N availability with ENTEC may also indicate that in-crop or side-dress applications of ENTEC may not be effective if not applied in advance of anticipated crop N requirements.
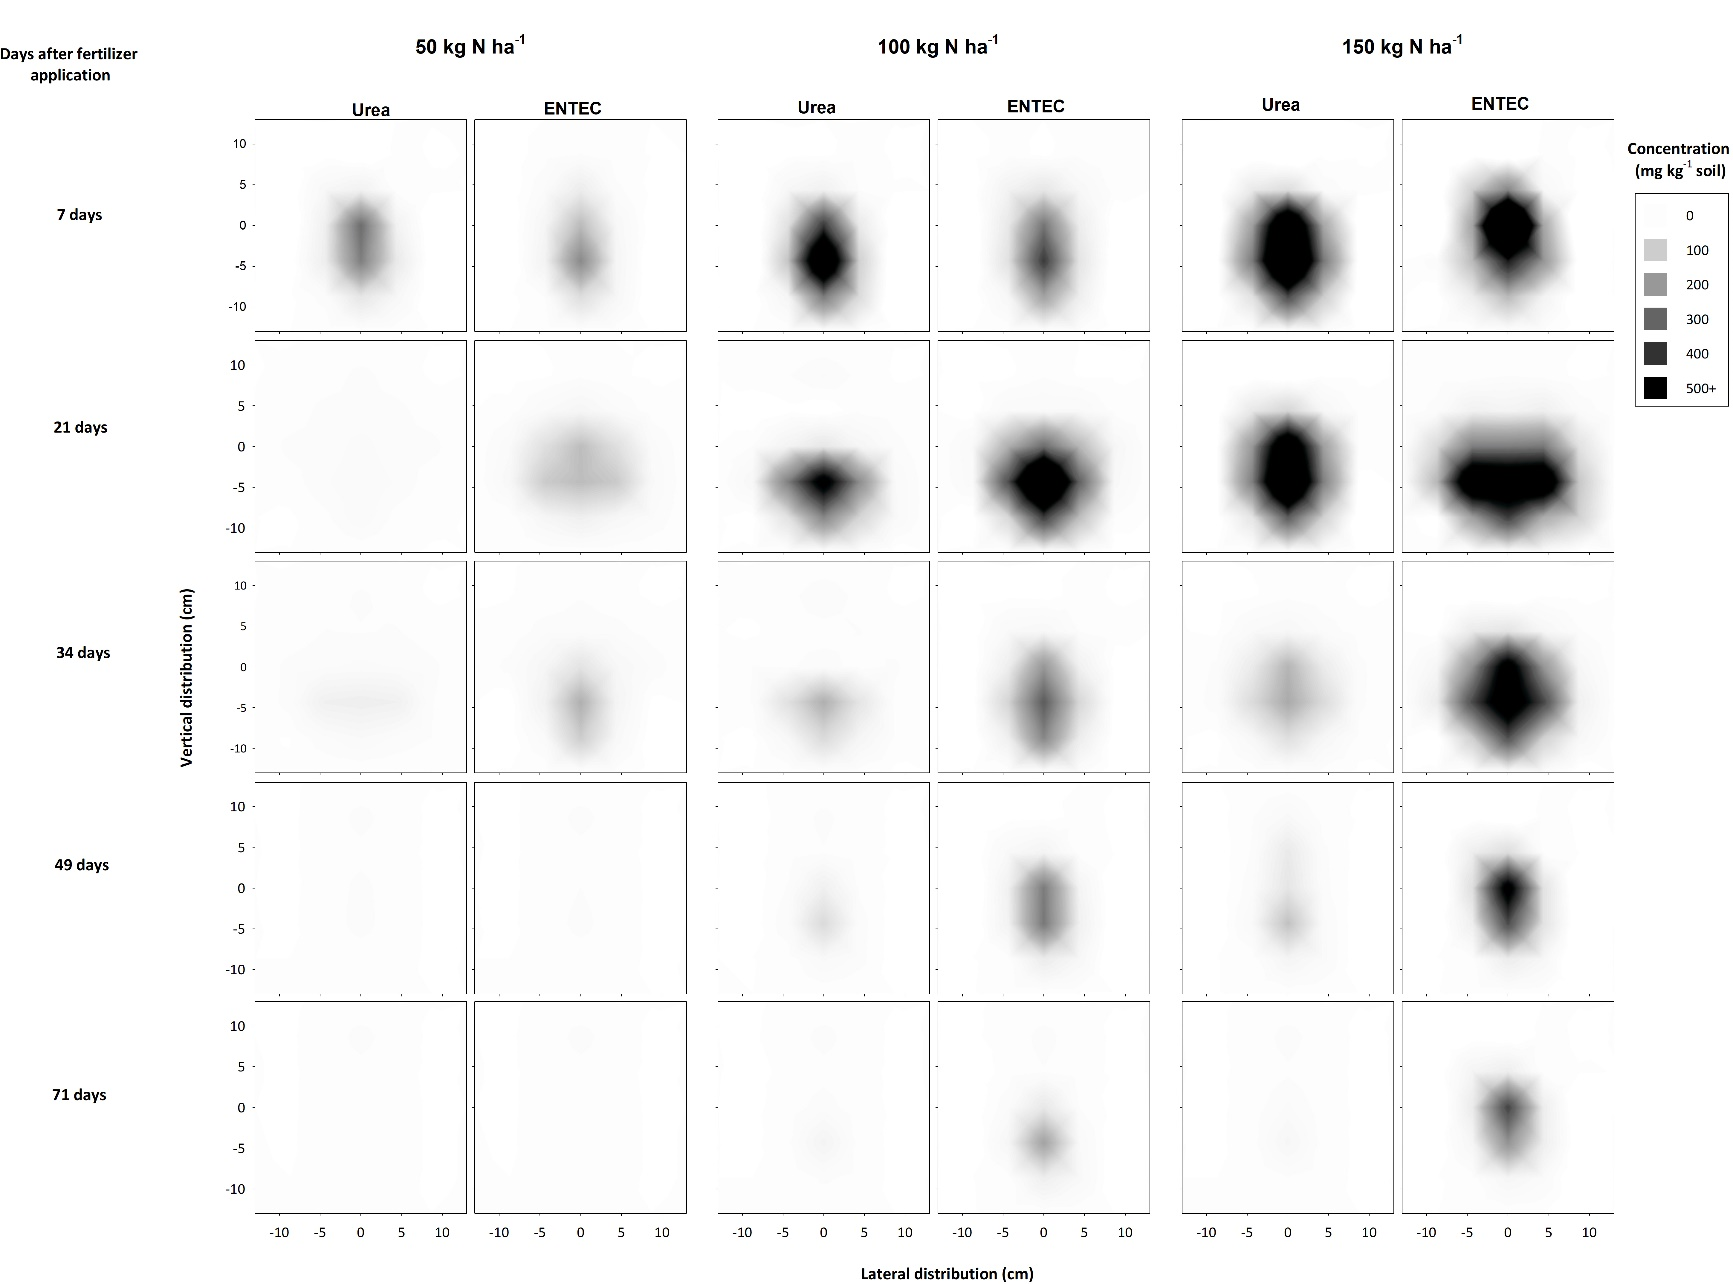 Figure 6. Concentration and distribution of ammonium-N from urea and ENTEC applied at 50, 100, 150 kg N ha-1 over time in the profile of a Vertosol (field experiment).
Controlled-release: polymer-coated urea (PCU)
Banding polymer-coated urea (PCU) delayed the release of N into the soil solution as expected (Figures 7, 8), however, N supply appeared to be lower and slower than would be anticipated for a product with a 90-day release. Preliminary laboratory results suggest banding diminishes the concentration gradients between the interior of a granule and the surrounding soil due to the effect of ‘neighbour-granules’. As the rate of urea release is driven by this concentration gradient, the slower release when these products are banded seems logical. This contrasts with situations where the same product is broadcast and incorporated, whereby concentration gradients between PCU granules and the surrounding soil solution are maximized and the diffusion-based N-release process is not restricted. Banding PCU granules may therefore extend the predicted release period, resulting in an unpredictable N supply.
Quantification of the effects of banding and in-band concentration (i.e., fertiliser application rate) on delayed release of N from PCU may overcome some possible issues associated with an unpredictable N supply in field conditions. Soil moisture must also be taken into account, as this factor plays a key role in controlling the diffusion-based release mechanisim. In laboratory incubations, more rapid release of N from PCU granules in the Vertosol (Figure 7) was attributed to the greater volumetric water content of this soil at field capacity, which enabled more rapid movement of water into granules and subsequent diffusion of N solutes away from the fertiliser band. Interestingly, the relatively ‘benign’ chemical conditions of PCU bands, due to the low urea concentrations in soil solution at any given time, resulted in nitrification rates similar to that of standard urea over 71 days (Figures 2, 8). Thus, while relatively moist conditions are necessary for effective release of N, these same conditions represent an elevated risk of leaching or denitrification loss of N released from PCU bands. Soil moisture is therefore a key factor influencing PCU efficacy and delivery of improved NUE. Benefits from banded PCU are therefore most likely in soils with a full (but not saturated) moisture profile and/or are affected by the distribution and amount of seasonal rainfall. Under relatively dry conditions, limited release and distribution of N from PCU may worsen positional unavailability of N, potentially resulting in yield penalties.
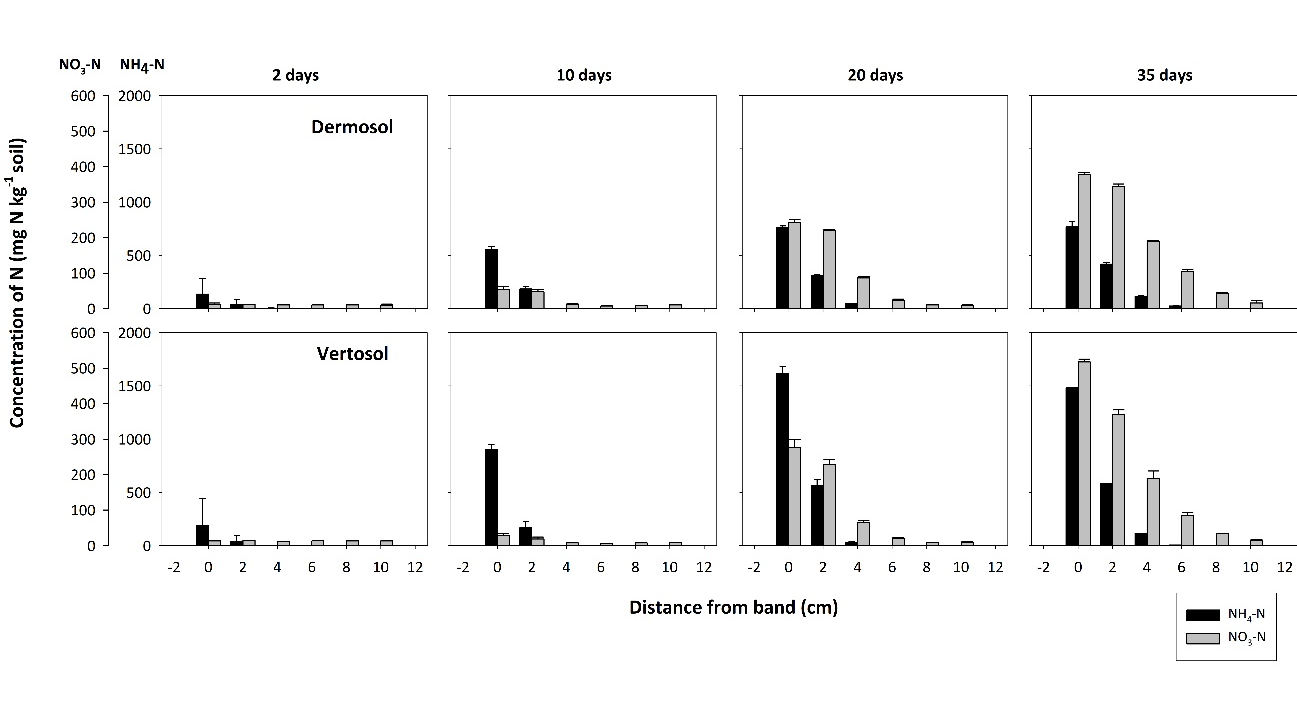 Figure 7. The concentration and distribution of ammonium-N and nitrate-N from Agromaster Tropical bands in the Dermosol and Vertosol of the laboratory diffusion study. Standard error bars of means for each data point are presented.
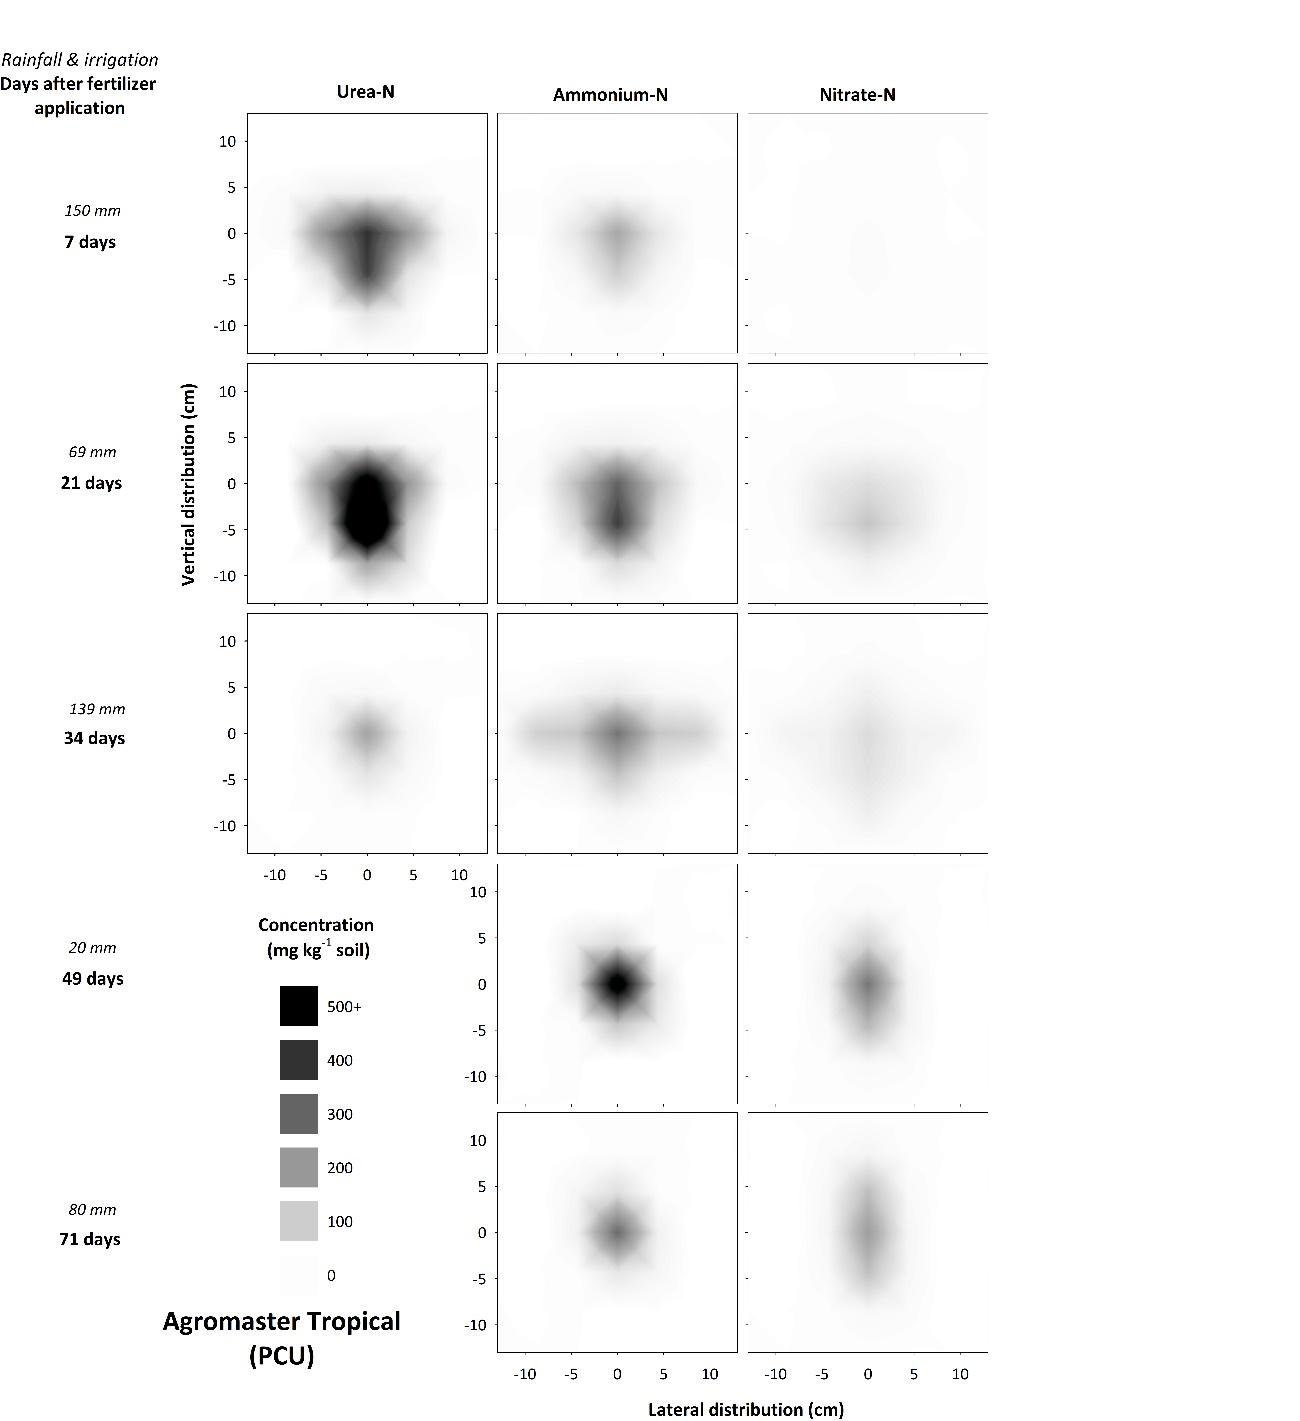 Figure 8. Concentration and distribution of urea-N, ammonium-N and nitrate-N over time in the profile of a Vertosol (field experiment) treated with Agromaster Tropical.
Conclusions
Banding (compared with broadcast/ incorporated application) can have unexpected effects on the efficacy of EEFs. Effective utilization of EEFs in banded application relies on understanding the mechanisms of the differing EEF technologies and the effects and interactions of key factors, such as soil type, soil moisture and/or rainfall. The activity of NIs is likely to be enhanced with banded applications in soil types with low permeability and high CEC, as the inhibitor and substrate (NH4-N) are better co-located in the soil profile compared to soils in which rates of diffusion and mass flow are much greater. However, the enhanced NI activity may further limit the movement of fertiliser N (NH4+ is retained on the soil’s high CEC) into deep soil layers with rainfall or irrigation events, and actually increase the risk of fertiliser N being ‘marooned’ in dry topsoil layers under rain fed conditions. NI-urea application rates, which were reduced by 50 kg N ha-1 compared to standard urea, demonstrated similar mineral N concentrations in soil solution, suggesting that there is potential for rates reductions with this EEF without adversely affecting N supply. However, this only occurs after approximately 30 days following fertiliser application, limiting this practice to crops with delayed N requirements.
Polymer coated urea is likely to exhibit slower rates of N release when applied in a band (compared with dispersed application) as ‘neighbouring-granules’ within the band restrict diffusion out of the granule. The most effective release of N from these granules occurs in moist-wet soil conditions. However, rapid nitrification of released N indicates that once this N is released the risk of leaching and/or denitrification losses is similar to that of urea, and the longer release period may actually represent a similar or greater loss risk profile over a fallow or a full growing season.
The UI product was the exception in that banding did not appear to substantially influence the effectiveness of the EEF technology compared with broadcast/incorporated application. However, the UI was only effective for a maximum of 21 days following fertiliser application, limiting the benefit of this EEF to scenarios where significant denitrification losses might be expected within 2 – 3 weeks of fertiliser application. The UI does not appear to be an effective option for mitigating leaching losses of N.
Acknowledgements
This research was supported by the National Environmental Sciences Program (Tropical Water Quality Hub) project 2.1.8 ‘Improved Water Quality Outcomes from On-Farm Nitrogen Management’. Scholarship support from the Australian Government Research Training Program (RTP), Howard Memorial Trust, and Sugar Research Australia is gratefully acknowledged.
Contact details
Chelsea Janke
School of Agriculture and Food Science,
University of Queensland
St Lucia, Brisbane 4072
Email: c.stroppiana@uq.edu.au
™ Trademark
® Registered trademark
