Grain production in a changing climate - elevated CO2, heat and moisture stress
Grain production in a changing climate - elevated CO2, heat and moisture stress
Author: Glenn J Fitzgerald (Agriculture Victoria) | Date: 03 Mar 2020
Take home messages
- Higher atmospheric CO2 levels can increase yield, water use efficiency and slow the impacts of rising temperature and drought to crop production
- Because higher levels of CO2 decrease grain protein in cereals, which lowers bread and market grade quality, new traits/cultivars are needed to overcome this reduction
- Crop management strategies and new traits that help use water more efficiently, especially during grain filling may give an extra boost to yields under future climates
- Because of increased water use efficiency, nodule biomass and more carbon, there may be more N available from legumes, which could make them more attractive in rotations
- Elevated CO2 is highly likely to increase the incidence of certain pests, thus improved pest management may be needed
- Adaptations to CO2, heat and drought will require multiple solutions and need to be tuned to local conditions in terms of times of sowing, choice of cultivar and suitable traits (such as WUE, rooting, season length, heat tolerance) and crop, residue and soil management
- Given the increasing speed at which changes are occurring, the sooner we understand what is needed to adapt, the more time we will have to create adapted cropping systems.
Background
Fundamentals
From the perspective of agricultural production, the components of climate change include: increasing and more extreme temperature, more variable rainfall, increasing atmospheric CO2, changing soil nutrition and interactions between these environments and biotic components, such as pests, diseases and crops. In addition, rainfall distribution and season lengths are changing. These changes are happening simultaneously and there are already many pressures on agricultural systems.
Mean temperatures across Australia are currently about 1°C above those at the beginning of the last century. Importantly, the frequency of extreme temperatures is increasing (Figure 1a). The patterns for rainfall are less clear with high variability for all locations, including eastern Australia (Figure 1b). It is worthwhile noting that the increase in temperature of 1°C may not appear to be very significant. However, as shown in Figure 2, a shift in the mean is really a shift in the distribution of temperatures around the mean. Thus, a relatively small shift to mean temperature translates into a larger change in the number of extreme values, in this case, number or frequency of hot days.
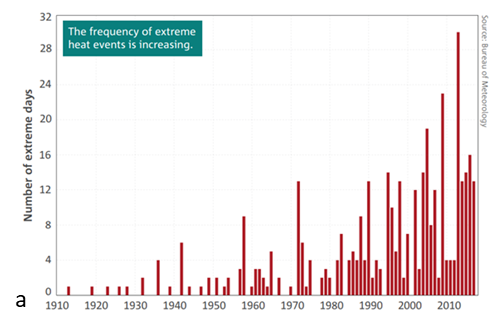
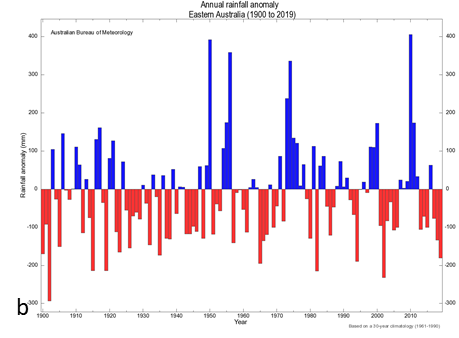 Figure 1. Graphs of (a) increasing frequency of extreme heat events since 1920 and (b) annual mean rainfall deviations in eastern Australia since 1900.
Figure 2. Example of the change in number of extreme heat days due to a shift in the distribution of temperature because of an increase in mean temperature.
Atmospheric CO2 has risen from ~280ppm in 1860 to ~410ppm today. It is expected that by 2050 CO2 concentration will reach 550ppm or as much as a rise in the next 30 years as in the previous 160 years (Figure 3).
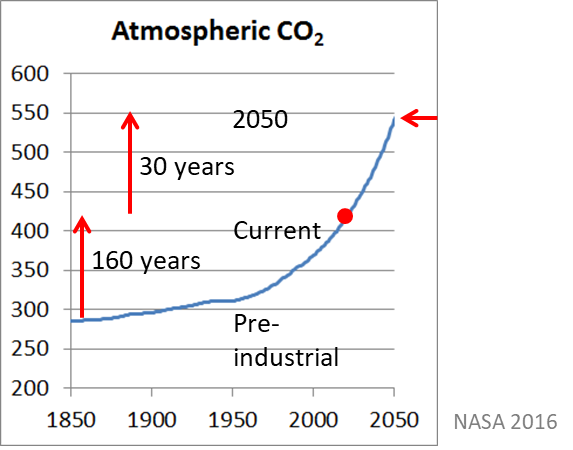 Figure 3. The increase in CO2 from the beginning of the industrial revolution (~1850 to 2050).
From a fundamental perspective these environmental changes alter carbon, nitrogen and water processes in plants and soil, which, in turn, alter photosynthesis and basic plant and crop growth patterns. In general, for C3 plants (such as wheat, pulses, canola), increasing CO2 by itself increases growth, water use efficiency and decreases plant N concentration, while higher temperatures and heat waves tend to do just the opposite, and drought can decrease all three (Figure 4). Elevated CO2 also causes canopy temperatures to rise due to closing stomata and reduced evaporative cooling. Individually, the effects of these environmental factors on crops are fairly well understood but it is important to understand how they interact.
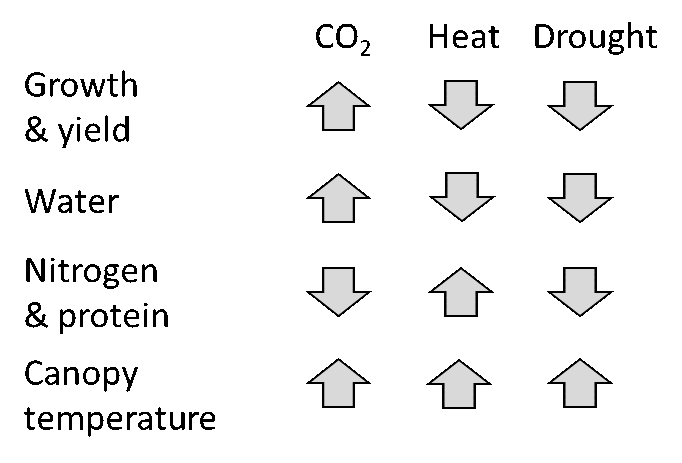 Figure 4. Impacts of major climate change factors on crops. Up arrows indicate increase or improvement of growth, while down arrows show a negative impact.
Thus, given there are changes in fundamental plant processes from a changing environment, how do these impact agricultural production?
Agriculture under increased CO2, heat and drought
From 2007-2017 the Free Air CO2 Enrichment (AGFACE) facility operated at Horsham, Victoria (Figure 5a) and for two years (2008-2009) at Walpeup, Victoria. In these facilities, many experiments were run to answer a range of questions relevant to dryland agriculture. Wheat was the predominant crop, but field pea and lentil were also grown. A number of lines and cultivars were grown to test questions around breeding traits for future climates. A sister facility, SoilFACE (Figure 5b) was run from 2009-2015 to answer questions around soils and nutrition in large intact soil cores with three diverse soils.
In each sub-facility (TraitFACE, SoilFACE, Walpeup) half of the plots were kept as ambient controls at current levels of CO2 (375 - 400ppm) and half of the plots had an octagonal ‘ring’ from which CO2 was emitted to raise the concentration around the growing plants to 550 ppm, the concentration expected in 2050. There were always four replications of treatments. Within each plot, small sub-plots (~1.5 x 4m) were sown with different cultivars and N levels, depending on the relevant questions. From 2007 – 2012, there were two levels of irrigation, a rainfed and an irrigated, in other years all plots were rainfed. Ring diameters (Figure 1) varied, depending on location and year, from 4m (SoilFACE and Walpeup) to 12m or 16m at Horsham. The CO2 emissions were computer controlled according to wind direction and speed to maintain relatively uniform levels across the ring. See Mollah et al. (2009) for complete engineering specifications.
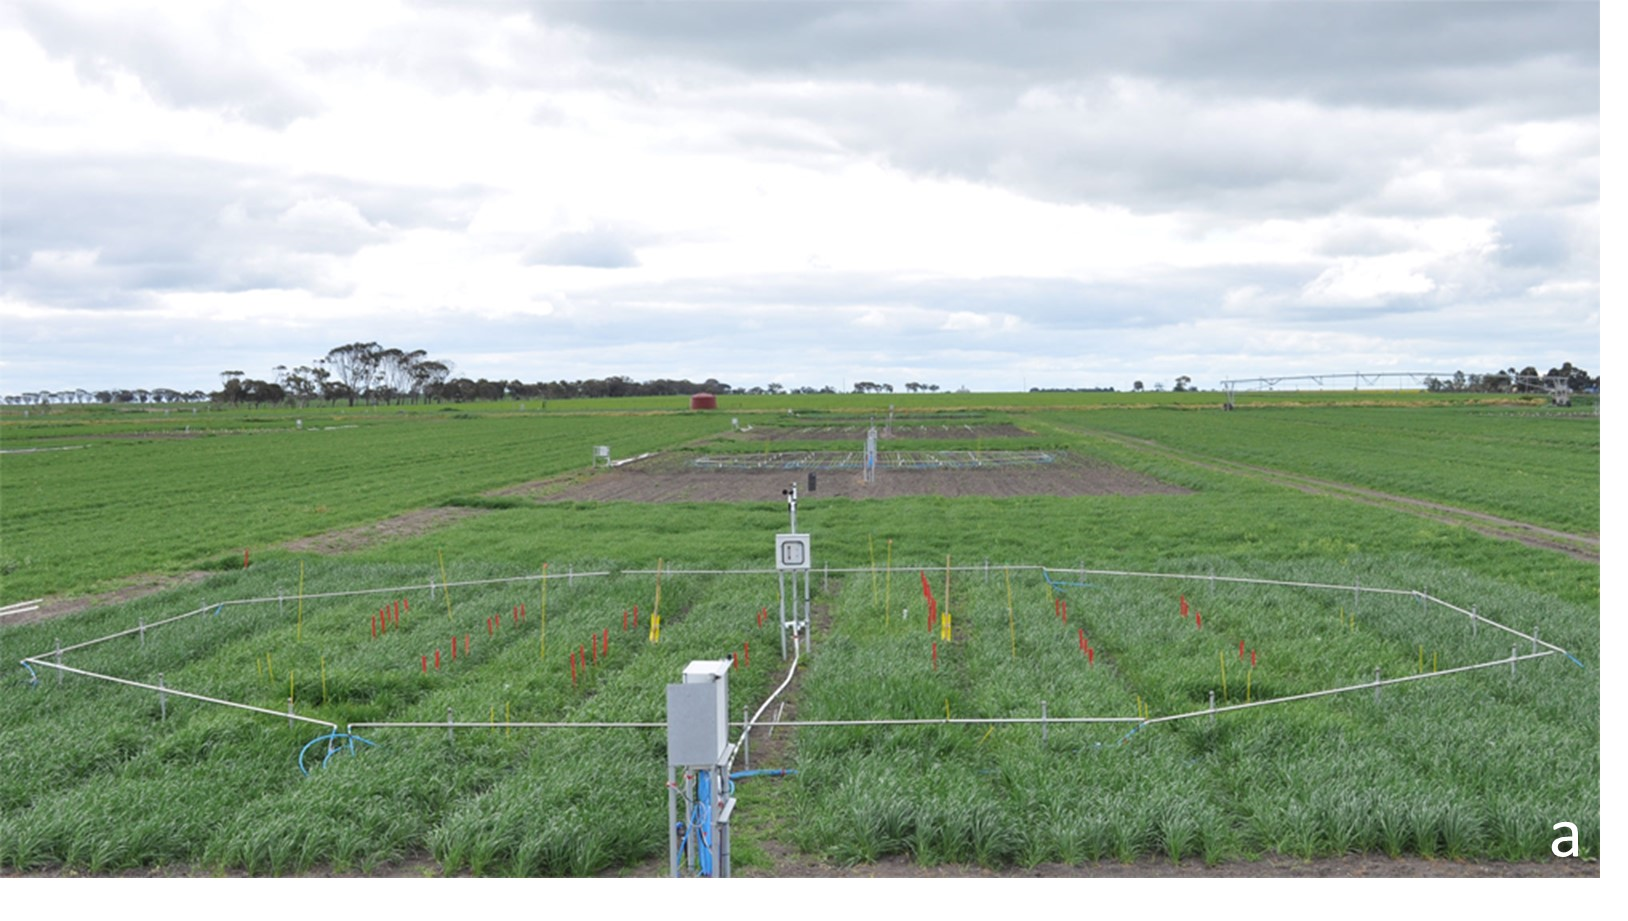
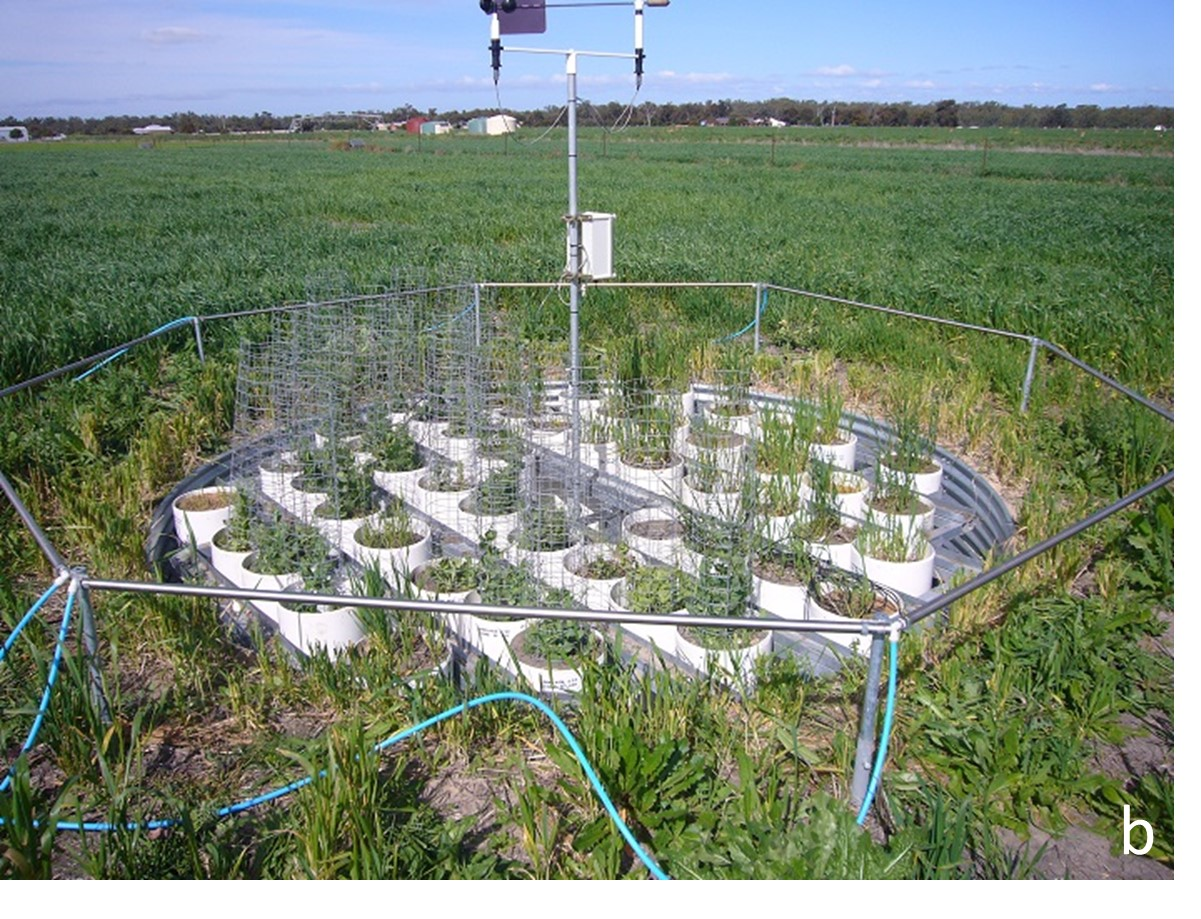 Figure 5. (a) One 12m ‘ring’ from the main AGFACE and (b) SoilFACE experiments (4m ring) with 30cm soil cores inset.
The strength of using a FACE facility rather than glasshouses, poly tunnels or other enclosures, is that the open nature of the structure allows for multi-factor, dynamic and realistic environments to be tested. This includes allowing variable rainfall, temperature, wind and pests into the growing crops to simulate field conditions as closely as possible. This was critical since the data collected were used to not only to understand agronomic, physiological and soil responses, but were used to validate computer simulation models, which allow us to extrapolate to other locations and into the future. In addition, glasshouses and control environment chambers were also used for more detailed physiological questions, and enclosed chambers in the field were also utilised for studying the impacts of acute heat waves on crops (Figure 6). This type of research is critical to Australian agriculture because climate change may be greatest in semi-arid regions already constrained by marginal growing conditions. Understanding the impacts to crop production will allow us to prepare for the future.
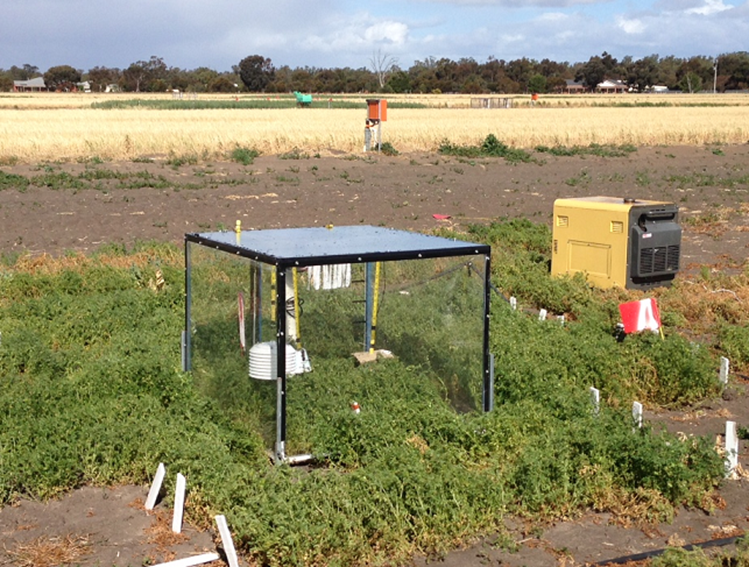 Figure 6. A temperature regulated field enclosure for imposing acute heat stresses on crops.
Results
Agronomy
Yield and grain N
Under elevated levels of atmospheric CO2 (eCO2), biomass and yields of C3 crops generally increase (Kimball, 2016) and this was confirmed in the AGFACE. Under rainfed conditions for wheat, field pea and lentil, yields increased by 21%, 29%, and 58% respectively (Figure 7) on average across the various years of the different experiments. The mean yield increase for wheat under irrigation (extra 76mm water) was 35% at Horsham and 56% at Walpeup. At Walpeup, soils are sandier, temperatures higher and rainfall less than at Horsham, usually resulting in lower yield. Average yields ranged from 1.3 to 3.8 for wheat, field peas and lentils across both sites. Thus, the mean yield increase under eCO2 for rainfed wheat was 0.7 t/ha, 0.9-1.0 t/ha for field pea and lentil, and 1.2 t/ha for the irrigated wheat. There was greater reduction in wheat grain N at Walpeup (-15%) than at Horsham (-7%). In the pulse crops, there was only a small reduction in grain N (Figure 7, right hand side of graph). Similar experiments conducted with irrigated cotton under eCO2 in semi-arid Arizona in the U.S. showed boll and lint increases of 40-60% (Kimball, 2006).
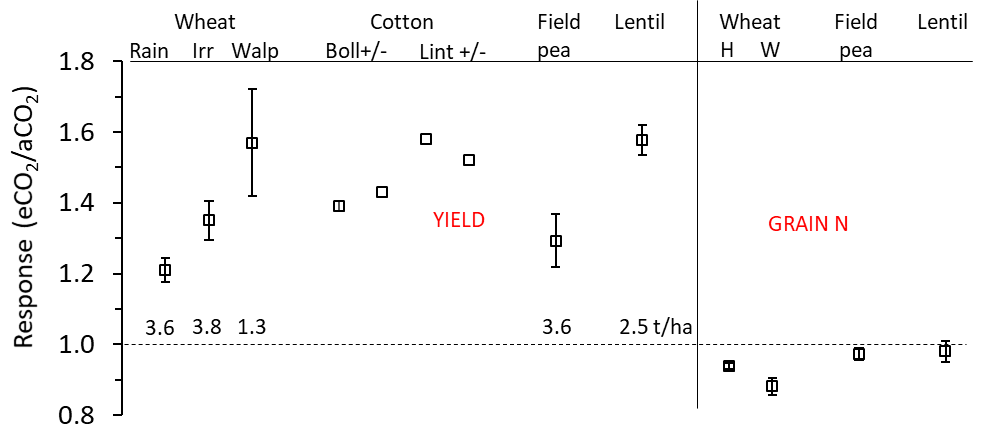 Figure 7. Response of yield and grain/boll/lint and grain N to elevated CO2 (eCO2/aCO2) for wheat, cotton, field pea and lentil. Response (y-axis) is displayed in terms of fractional response compared to ambient (aCO2) (e.g., 20% increase = 1.2 times increase or 10% decrease = 0.9). Wheat, field pea and lentil data are from the AGFACE. Cotton data is from the Arizona FACE (Kimball, 2006). Yield: Wheat, Rain = rainfed treatments at Horsham, Irr = irrigated treatments at Horsham, Walp = Walpeup site. Cotton: Boll or Lint = boll or lint yield with ample N and H2O (+) or with ample N but deficit H2O (-). Grain N: Wheat, H = Horsham, W = Walpeup. Error bars are 95% confidence intervals. Actual yield (t/ha) of the ambient CO2 treatment for wheat, field pea and lentil are shown above the 1.0 horizontal dotted line (no response to eCO2).
N uptake
Because eCO2 increases biomass, more N is required by the crop (Figure 8, wheat). Thus, to take advantage of eCO2, more fertiliser inputs may be required. This demand for N may be tempered, however, by rising temperatures that will tend to depress yields.
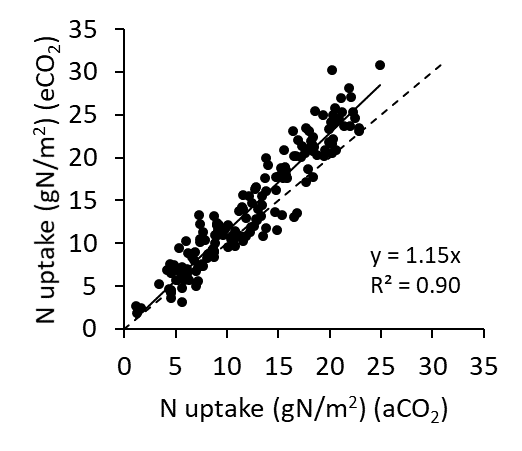 Figure 8. N uptake in above ground biomass at maturity in wheat in AGFACE across all cultivars for ambient and elevated CO2 (aCO2 and eCO2). The solid line represents the increase in N (mean +15%) taken up by crop due to increased biomass under eCO2. The dashed line is the 1:1 relationship (i.e. no response).
N from legumes
For both field pea and lentil, N2 fixation (rate and quantity) increased under eCO2 when there was sufficient soil water to support root rhizobia. In drought-affected field peas, N2 fixation was partially improved by increased water use efficiency (WUE) under eCO2, which prolonged nodule activity (Parvin et al., 2019). Because of increases in biomass, nodule activity and WUE, legumes might find a more prominent role in future rotation systems.
Heat
Changes in water dynamics, crop evapotranspiration and canopy temperature suggest that the effects of eCO2 may interact with heat waves. Because acute heat waves are predicted to increase in frequency, high temperature at critical growth stages was studied in AGFACE by measuring impacts of a natural heat wave and imposing artificial heat using temperature-controlled field chambers (Figure 6). Impacts of heat waves on crops under eCO2 was mixed. In a natural heat wave during grain fill in 2009, wheat grain size increased and screenings of small seed (<2 mm) decreased under eCO2 (Fitzgerald et al., 2016) suggesting this might buffer heat impacts. But, in controlled chambers, there was no interaction with CO2 of a imposed heat wave with maximums of 38 - 40 °C on three consecutive days near flowering in wheat (Nuttall et al., 2015) or lentil (Bourgault et al., 2018). In field-grown lentil, eCO2 helped negate the negative effects of heat on N2 fixation by improving plant water status (Parvin et al., 2019). These differences show that the impact of acute heat under eCO2 is complex and timing relative to grain filling is critical.
Quality
Elevated CO2 lowered grain protein concentration by about 7% across all treatments in the AGFACE experiments (Figure 7 and 9a). Adding N fertiliser did not reverse the loss in grain protein under eCO2 (Walker et al., 2017). The impact of this was to reduce bread quality (Figure 9b) across all conditions and cultivars tested. Only a small portion of this reduction was due to ‘dilution’ from increased carbohydrate translocation to grain. It has been suggested that this apparently universal reduction in cereal grain protein is due to a physiological bottleneck in nitrate assimilation and translocation of N to grain (Bloom et al., 2010) and evidence from AGFACE supports this hypothesis (Bahrami et al., 2017). Elevated CO2 also caused changes in the protein composition of grain (Walker et al., 2019) and reduced grain micronutrient composition of Fe (-5%) and Zn (-11%), which are important in human nutrition (Myers et al., 2014).
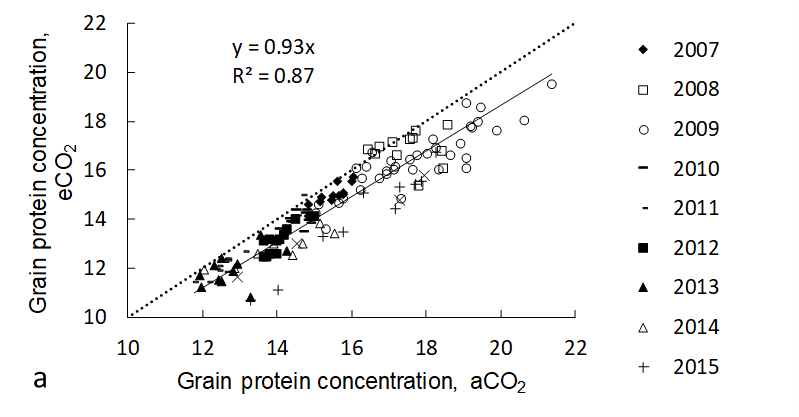
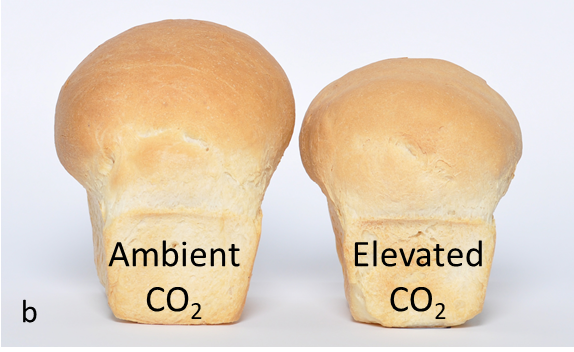 Figure 9. (a) Reduction in wheat grain protein under ambient CO2 and elevated CO2 conditions across years and environment for cv Yitpi. Less than 20% of this reduction can be explained by ‘dilution’ of N by carbohydrate translocation. The dashed line is the 1:1 (i.e. no response) line. (b) Example of reduction in bread quality due to eCO2.
A crop modelling study using AGFACE data showed that under the expected climate for 2050 (hotter, drier, higher CO2) the grain protein concentration decrease will vary greatly depending on location, with the Victorian Mallee region showing the largest decrease of 8.2% in grain protein concentration along with a 43% reduction in yield. In the Mallee and Wimmera regions, market grades produced were generally reduced (Figure 10), but not at all sites (see Korte et al., 2019). The net expected result is less grain that meets the standard for bread making (ASW1 grade), although increased yields at most sites will offset any reduction in income due to lowered a quality.
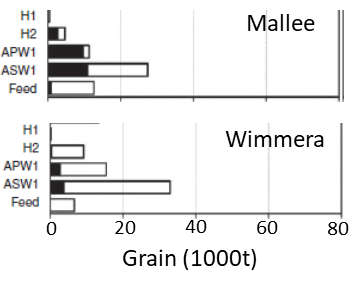 Figure 10. Changes in wheat grain market grades due to eCO2 levels and climate expected for 2050 for two regions in Victoria. The black bars indicated the amount of grain downgraded from the next higher grade under eCO2.
Pests
The main pest/vector studied in AGFACE was Barley Yellow Dwarf Virus (BYDV) on wheat. Because the virus is transmitted by the aphid host through phloem feeding, any changes in plant chemistry (e.g., changes in plant N) due to changes in environment could change aphid behaviour or virus virulence. Results from AGFACE showed that under higher temperatures (Nancarrow et al., 2014) the amount of virus in the plants increased under eCO2 by 11% (Trebicki et al., 2017). In addition, aphids significantly increased sap uptake under eCO2, increasing feeding damage. Under eCO2 plants infected by BYDV had relatively greater leaf N concentration than uninfected plants (Figure 11a), which attracts aphids, potentially increasing the spread of virus to other, non-infected plants. Higher virus loads in plants can reduce yields (Figure 11b). There have not been any studies under the combination of eCO2 and increased temperature, but the fact that both conditions increase virus loads suggests BYDV will become more severe under the future climate.
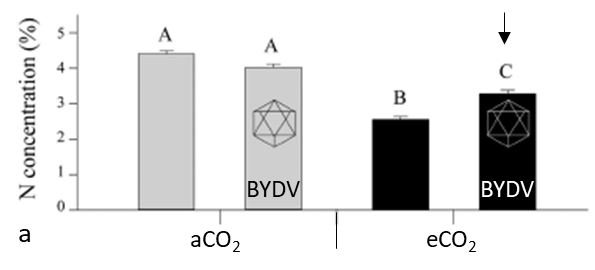
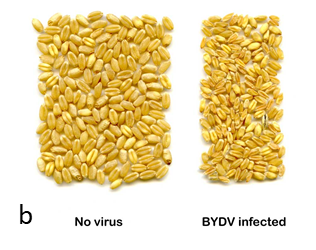 Figure 11. (a) Amount of plant N in wheat plants under ambient and elevated CO2 with and without BYDV infection (Trebicki et al., 2016). Letters that are different are statistically significant (p < 0.05). Under eCO2 infected plants have relatively higher plant N (arrow), which attracts aphids, potentially increasing infection and virus spread. (b) Example of effect of BYDV infection on wheat grain.
Traits
Transpiration efficiency
Traits that have been used in Australian physiological breeding programs such as increased water-soluble carbohydrates, transpiration efficiency (TE) and reduced tillering were tested in AGFACE to determine if these offer particular advantages under eCO2. Of these, the TE trait in cv Drysdale was found to increase yields by 19% under eCO2 above the comparison cv Hartog without TE (Tausz-Posch et al., 2012). In a modelling study across Australia (Christy et al., 2018), the TE trait was predicted to confer an extra 13% average yield advantage over current conditions even with a modelled reduction in rainfall of 20% and a 2°C warming with clear differences across the landscape (Figure 12). Without eCO2, the yield was reduced by 23% compared to current climate. Thus, there appears to be a clear advantage to a TE trait under future climate.
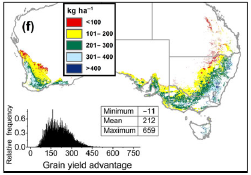 Figure 12. Grain yield advantage of wheat cv Drysdale (+TE trait) over cv Hartog (-TE trait) under eCO2 in 2050 assuming 20% less rainfall and +2°C of warming over current mean temperature (from Christy et al., 2018).
Roots
Another key trait for adaptation under dryland conditions is root architecture and growth. The impact of CO2 on root growth was assessed for canola and wheat in both glasshouse and field experiments in AGFACE. It was found that eCO2 increased root length and biomass at all depths and levels of soil water availability. However, yield was stimulated most when deeper roots had access to more water (Uddin, et al., 2018a, b, c). In addition, deeper rooting cultivars of canola and wheat showed greater stimulation of yield under eCO2. Thus, under eCO2 and dryland conditions, roots deeper in the profile allowed crops to take greater advantage of sub-soil water than under current CO2. The problem with dryland crops in low rainfall areas is that subsoil moisture may rarely be available.
Discussion
There is no denying that CO2 concentration and mean temperatures are increasing, and extreme temperatures are becoming more frequent. Climate models also predict that rainfall will be more variable and decreasing in the longer term. In terms of grain production, the effect of increasing CO2 on biomass and yield is expected to be mostly positive, except when soil N and water are scarce. Small amounts of extra water during grain fill and deeper root seem to provide a boost to the CO2 response for yield. Unfortunately, increasing temperature with reductions in rainfall has the opposite effect by reducing available water and yields. It is also possible higher temperatures reduce yield while increasing grain protein, and this will counteract the protein reductions seen under eCO2.
Hochman et al. (2017) demonstrated that wheat yields in Australia have stagnated since 1990 (Figure 13). Growers have adapted to drought and hotter conditions, which has maintained production, rather than resulting in decreasing yields. The question is, however, what can be done to adapt and increase yields given all the above-mentioned considerations and changes in climate, as opposed to the flat line in Figure 13b?
 Figure 13. (a) Increasing grain yields in wheat in Australia from 1900 and (b) yield plateau from 1990 to 2015 (Hochman et al., 2017).
We have been able to quantify the impacts of a number of the above factors on production within AGFACE and from international research, but it is not possible to test every combination of environments with all interactions. The complex nature of integrating the impacts of changing environments in agricultural production can be handled through simulation modelling. A good history and summary of modelling in Australian agriculture is presented by Hochman and Lilley, (2019). Field research can provide validation of simulation models, which can then be used to extrapolate to other locations and into the future.
Adaptation
In a recent modelling study using AGFACE and other data, Wang et al. (2018) showed that without adaptation, wheat yields will decline in some parts of Australia (Figure 14a). Two climate scenarios were tested for the years 2050 and 2090. The Relative Concentration Pathway (RCP) 4.5 is a future climate target with lower CO2 emissions, while RCP 8.5 has the highest emissions, which the world is currently tracking. Without adaptation, Queensland is predicted to be most heavily impacted for all projections, followed by New South Wales. The reasons are that higher temperatures and lower rainfall in the warmer states of QLD and NSW will decrease yields, while in cooler areas, such as Victoria, milder winters and reductions in waterlogging in some areas will benefit crop production.
There are a number of potential changes that can be made to adapt to climate change. In Figure 14a, projected yields are shown (small black rectangles) with earlier sowing (11-18 days) and sowing a longer season cultivar. Shifting the growing season earlier often allows capture of more water, increasing water use efficiency. Sowing a cultivar with a long growth cycle helps resist the shortening of the growing season as temperature rises. Predicting yields nationally on an arable area basis (Figure 14b) showed that by the 2090s, even with the adaptations tested, there is a reduction in yield, which was caused by predicted reductions in the growing area for wheat.
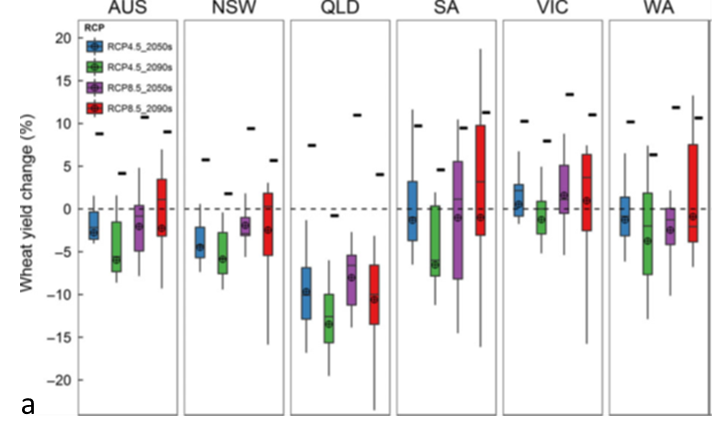
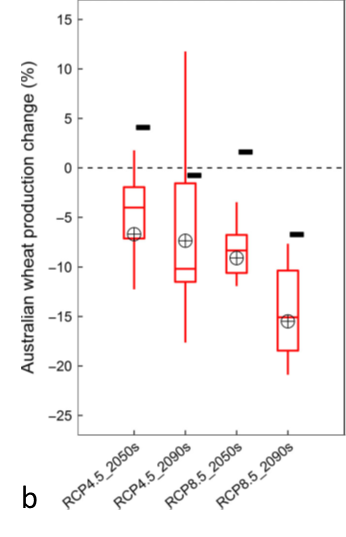 Figure 14. (a) Projected changes in APSIM-modelled wheat yield per hectare with no adaptation (box plots) in Australia and individual states with a moderate (RCP 4.5, blue and green) and business-as-usual (RCP 8.5, purple and red) climate outcome predictions for 2050 and 2090, compared to 1961-2000. Small rectangles represent yield projections with adaptation measures (sowing date shifted to earlier and a longer season cultivar). (b) Australian mean yield response on an area basis (areas climatically suitable for growing wheat). Reductions by 2090 are due to loss of arable land.
An example of local adaptation was shown by Ghahramani et al. (2015) and an excerpt for Goondiwindi is presented in Figure 15. As in Wang et al. (2018), they considered shifting to earlier sowing times and using longer season cultivars as options for the near future, in this case 2030. Their APSIM predictions also showed that despite decreases in yield there are measures that can be taken to adapt cropping systems to hotter, drier and more variable conditions.
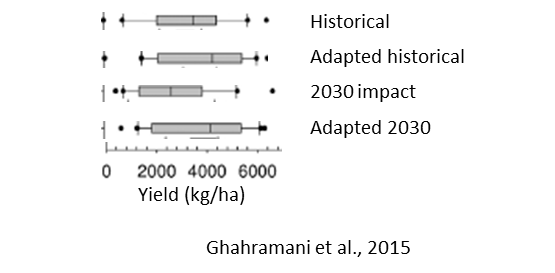 Figure 15. Yields (kg/ha) for 2030 for Goondiwindi for: historical (1980 – 1999), adaptation with historical yields, impact to yields in 2030, and with adaptation measures in 2030. Adaptations considered were earlier sowing and longer season cultivars. Means with error bars are shown.
On a local level, Luo et al. (2018) used modelling to understand how local environment, time of sowing, cultivar selection and phenology (flowering, start and end of grain filling) will impact wheat yields in 2030. Their study included three locations across NSW (Moree, Dubbo, Wagga Wagga), testing five times of sowing and three bread wheat cultivars at each site (Figure 16). The cultivars were of three maturity types: early-mid (Gladius), mid-late (Sunvale) and late (Sunbrook). They found that the rate of wheat development will increase, water use will decrease and WUE will increase in most cases. The combinations of time of sowing with cultivars that produced the highest yields varied by location, and hence, adaptation needs to be targeted to each specific location. Reductions in predicted yields at Moree suggest that other breeding and management solutions may also be needed for adaptation at this site.
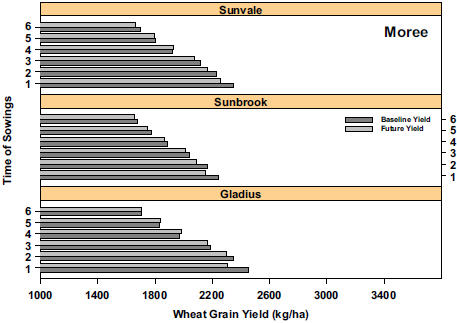
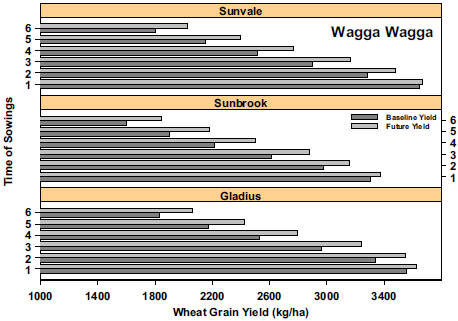 Figure 16. Examples of wheat yields (kg/ha) under baseline (1980-1999) and future 2030 conditions for six times of sowing at (a) Moree and (b) Wagga Wagga. At Moree, 2030 climate (light grey) is predicted to decrease yields. At Wagga, the 2030 climate is expected to increase yields with moderate to later sowings. The yield increase is attributed to eCO2, the interaction between eCO2 and soil fertility and more favourable climate (cooler, more rainfall) compared to Moree.
Because climate change involves multiple factors and an ever-shortening time frame, a combination of targeted approaches based on knowledge gained from decades of research could both maximise the positive aspects to crop production and help overcome the negatives. Combining genetics and management for adaptation in a systems approach to a new environment will potentially maintain production in semi-arid regions for longer than if changes are made in a piecemeal fashion.
Conclusion
Much research performed over the last century has underpinned the increases in grain production in Australia. In our dryland environments, this has focused on the impact of changes to water and heat on production using genetic and management tools. Impacts of elevated CO2 have not been often addressed, possibly in part, because it has been considered ‘positive’ for growth and yield and not something that needs to be overcome. Along with heat, drought, light, soils, nutrition and other factors, elevated CO2 is now included in most crop models.
To improve our ability to accurately assess climate change impacts to production and therefore to maximise adaptation, there are still a number of issues that need to be addressed in relation to eCO2:
- How do root growth and architecture and access to soil water change under eCO2, and for legumes, how does this impact rhizobia and ability to fix N?
- Does trait expression developed for heat tolerance and water use efficiency (stomata and root architecture) change under eCO2?
- How does the increase in canopy temperature due to stomatal closure affect crop development, C and N translocation and ultimately, grain yield and quality?
- Can the bottleneck in N translocation to grain and protein reduction in C3 crops be overcome?
- Only a few pests and diseases have been tested under eCO2 and interactions with other environments. How will these change and what are the strategies for adaptation?
- Crop management practices (e.g., conservation tillage, row spacing, fallow, legume rotation, etc.) have not been well addressed under eCO2 and greater understanding could help develop better climate-adapted systems.
Thus, a systems approach using all the experimental, analytical and practical tools at our disposal would seem prudent. Given the increasing speed at which changes are occurring, the sooner we understand how to adapt, the more time we will have to create adapted cropping systems.
References
Bahrami H, de Kok Luit J, Armstrong R, Fitzgerald G, Bourgault M, Henty S, Tausz M, Tausz-Posch S (2017) Nitrate in leaves, but not changes in root growth, are associated with decreased grain nitrogen in wheat under elevated [CO2] in a dryland agro-ecosystem. J Plant Physiology 216:44-51.
Bloom, AJ, Burger, M, Asensio, JSR, & Cousins, AB (2010) Carbon dioxide enrichment inhibits nitrate assimilation in wheat and Arabidopsis. Science, 328(5980), 899-903.
Bourgault M, Löw M, Tausz-Posch S, Nuttall JG, Delahunty AJ, Brand J, Panozzo JF, McDonald L, O'Leary G, Armstrong R, Fitzgerald GJ, Tausz M (2018) Effect of a heat wave on lentil (Lens culinaris MEDIK) grown under Free Air CO2 Enrichment (FACE) in a semi-arid environment. J Crop Science 58:803-812.
Christy B, Tausz-Posch S, Tausz M, Richards R, Rebetske G, Condon A, McLean T, Fitzgerald GJ, Bourgault M, O’Leary G (2018) Benefits of increasing transpiration efficiency in wheat under elevated CO2 for rainfed regions. Global Change Biology 24:1965-1977.
Fitzgerald GJ, Tausz M, O’Leary G, Mollah M, Tausz-Posch S, Seneweera S, Mock I, Lowe M, Partington D, Argall R, McNeil D, Norton RM (2016) Elevated atmospheric [CO2] can dramatically increase wheat yields in semi-arid environments and buffer against heat waves. Global Change Biology 22:2269-2284.
Ghahramani A, Kokic PN, Moore AD, Zheng B, Chapman SC, Howden MS, Crimp SJ (2015) The value of adapting to climate change in Australian wheat farm systems: farm to cross-regional scale. Agriculture, Ecosystems and Environment 211:112-125.
Hochman Z, Gobbett DL, Horan H (2017) Climate trends account for stalled wheat yields in Australia since 1990. Global Change Biology 23:2017-2081.
Hochman Z, Lilley J (2019) Impact of simulation and decision support systems on sustainable agriculture. In (Eds J Pratley and J Kirkegaard) “Australian Agriculture in 2020: From Conservation to Automation” pp 337-356 (Agronomy Australia and Charles Sturt University: Wagga Wagga).
Kimball (2006) The Effects of Free-Air [CO2] Enrichment of Cotton, Wheat, and Sorghum. Ecological Studies, Vol. 187, J.Nösberger, S.P.Long, R.J.Norby,M.Stitt, G.R.Hendrey,H.Blum (Eds.) Managed Ecosystems and CO2, Case Studies, Processes, and Perspectives, © Springer-Verlag Berlin Heidelberg.
Kimball BA (2016) Crop responses to elevated CO2 and interactions with H2O, N, and temperature. Current Opinion in Plant Biology 31:36–43.
Korte CJ, Wilson P, Kearns B, Fitzgerald GJ, Panozzo JF, Walker CK, Christy B, Nuttall JG, Armstrong RD, Tausz M, O’Leary G. (2019) Potential impact of elevated atmospheric carbon dioxide and climate change on Victorian wheat marketing grades and value. Crop and Pasture Science, 70(11), 926-938.
Luo Q, O’Leary G, Cleverly J, Eamus D (2018) Effectiveness of time of sowing and cultivar choice for managing climate change: wheat crop phenology and water use efficiency. International Journal of Biometeorology (2018) 62:1049–1061.
Mollah MR, Norton RM, Huzzey J (2009) Australian Grains Free Air Carbon dioxide Enrichment (AGFACE) facility: design and performance. Crop & Pasture Science 60, 697-707.
Myers S, Zanobetti A, Kloog I, Dietterich L, Sartor K, Hasegawa T, Raboy V, Nelson R, Leakey A, Ottman MJ, Tausz M, Fitzgerald G, Seneweera S, Schwartz J (2014) Rising CO2 threatens human nutrition. Nature, 510:139-143.
Nancarrow, N, Constable, FE, Finlay, K J et al. (2014) The effect of elevated temperature on Barley yellow dwarf virus-PAV in wheat. Virus Research, 186, 97–103.
Nuttall J, Barlow K, Christy B, O’Leary G, Fitzgerald GJ (2015) Heat shock response in wheat under Free Air CO2 Enrichment. Proceedings of the Australian Society of Agronomy Conference, Hobart, Australia, 20-24 September.
Parvin S, Uddin S, Fitzgerald GJ, Tausz-Posch S, Armstrong R, Tausz M (2019) Free Air CO2 Enrichment (FACE) improves water use efficiency and moderates drought effect on N2 fixation of Pisum sativum L. Plant and Soil, 436(1-2): 587-606.
Tausz-Posch S, Seneweera S, Norton R, Fitzgerald G, Tausz M (2012) Can a wheat cultivar with high transpiration efficiency maintain its yield advantage over a near-isogenic cultivar under elevated CO2? Field Crops Research 133:160–166.
Trebicki P, Vandegeer RK, Bosque-Perez N, Powell K, Dader B, Freeman AJ, Yen AL, Fitzgerald GJ, Luck JE (2016) Virus infection mediates the effects of elevated CO2 on plants and vectors. Scientific Reports 6:22785, 1-11.
Trebicki, P, Nancarrow N, Bosque-Pérez NA, Rodoni B, Aftab M, Freeman A, Yen AL, and Fitzgerald G (2017) Virus incidence in wheat increases under elevated CO2: A 4-year study of yellow dwarf viruses from a Free Air Carbon Dioxide facility. Virus Research, 241, 137–144.
Uddin, S, Löw, M, Parvin, S, Fitzgerald, G, Bahrami, H, Tausz-Posch, S, Armstrong, R, O’Leary, Tausz, M (2018a) Water use and growth responses of dryland wheat grown under elevated [CO2] are associated with root length in deeper, but not upper soil layer. Field Crops Research, 224, 170-181.
Uddin, S, Löw, M, Parvin, S, Fitzgerald, GJ, Tausz-Posch, S, Armstrong, R, O’Leary, Tausz, M (2018b) Elevated [CO2] mitigates the effect of surface drought by stimulating root growth to access sub-soil water. PloS one, 13(6), e0198928.
Uddin, S, Löw, M, Parvin, S, Fitzgerald, G J, Tausz-Posch, S, Armstrong, R, Tausz, M (2018c) Yield of canola (Brassica napus L.) benefits more from elevated CO2 when access to deeper soil water is improved. Environmental and Experimental Botany, 155, 518-528.
Walker C, Armstrong R, Panozzo J, Partington D, Fitzgerald G (2017) Can nitrogen fertiliser maintain wheat (Triticum avestium) protein in an elevated carbon environment? Soil Research, Soil Research 55: 518-523.
Walker CK, Panozzo JF, Békés F, Fitzgerald G, Tömösközi S, Török K (2019) Adaptive traits do not mitigate the decline in bread wheat quality under elevated CO2. Journal of Cereal Science 88, 24-30.
Wang B, Liu DL, O'Leary GJ, Asseng S, Macadam I, Lines-Kelly R, Yang X, Clark A, Crean J, Sides T, Xing H, Mi C and Yu Q (2018) Australian wheat production expected to decrease by the late 21st century. Global Change Biology 2018;00:1-13.
Acknowledgements
The research undertaken as part of this project was made possible by the significant contributions of growers through the support of the GRDC, the author would like to thank them for their critical support. Research in the AGFACE program was a joint collaboration between Agriculture Victoria and The University of Melbourne. Research from the CSIRO was also supported in early years of the program. Major research support was also provided by the Australian Commonwealth Department of Agriculture and Water Resources and the Australian Research Council. Student, faculty and fellowship support granted for various individuals is documented in acknowledgements in individual publications. The author gratefully acknowledges the input of international colleagues and students from other FACE facilities and the Agricultural Model Inter Comparison and Improvement Project (AgMIP) consortium and collaborations. Finally the author would like to acknowledge the contribution of members of the AGFACE research team and contributors over the years: Michael Tausz, Garry O’Leary, Roger Armstrong, Joe Panozzo, Piotr Trębicki, Mahabubur Mollah, Sabine Tausz-Posch, Cassandra Walker, James G Nuttall, Maryse Bourgault, Markus Löw, Debra Partington, Clayton R Butterly, Shu Kee Lam, Robert M Norton, Sukumar Chakraborty, Jo Luck, David McNeil, Ivan Mock, Anwar Muhuddin, Marc Nicolas, Saman Seneweera, Alan Yen and others he may have inadvertently left out.
Contact details
Glenn J Fitzgerald
Agriculture Victoria
Department of Jobs, Precincts and Regions
110 Natimuk Rd, Horsham 3400
Ph: 03 4344 3145
Email: glenn.fitzgerald@agriculture.vic.gov.au
Varieties displaying this symbol beside them are protected under the Plant Breeders Rights Act 1994.
