Nitrogen and water dynamics in farming systems – multi-year impact of crop sequences
Nitrogen and water dynamics in farming systems – multi-year impact of crop sequences
Take home messages
- Grain legumes have utilised soil mineral nitrogen (N) to the same extent as cereal crops and have higher N export which often offsets N fixation inputs
- Additional applied N reduced the depletion of background soil mineral N status at most sites; we are recovering a high percentage (>50%) in soil mineral pool.
- Application of ~50 t/ha of compost or manure (10 t/ha OC) coupled with N fertiliser rates for 90th percentile yield potential has dramatically increased the soil mineral N in four years
- Decreasing cropping frequency has reduced N export and so stored more N over the longer fallows, which has reduced N fertiliser requirements for following crops
- Long fallows are mineralising N and moving N down the soil profile even under some very dry conditions
- Most excess N is not lost in the system rather it is moved down the soil profile for future crops
- The marginal WUE of crops (i.e. the grain yield increase per extra mm of available water) is lower when crops have less than 100 mm prior to planting. Hence, waiting until soil moisture reaches these levels is critical to maximise conversion of accumulated soil moisture into grain
- The previous crop influences the efficiency of fallow water accumulation with winter cereals > sorghum > pulses. Long fallows are also less efficient than shorter fallows (<8 months). This has implications for assuming how much soil moisture may have accumulated during fallows.
Introduction
While advances in agronomy and the performance of individual crops have helped grain growers to maintain their profitability, current farming systems are underperforming; with only 30% of the crop sequences in the northern grains region achieving 75% of their water limited yield potential. Hence, identifying ways to improve crop sequences to make more efficient use of soil water is needed. Growers also face challenges from declining soil fertility, increasing herbicide resistance, and increasing soil-borne pathogens in their farming systems. Change is needed to meet these challenges and to maintain farming system productivity and profitability. Consequently, Queensland Department of Agriculture and Fisheries (DAF), New South Wales Department of Primary Industries (NSW DPI) and CSIRO are collaborating to conduct an extensive field-based farming systems research program, focused on developing farming systems to better use the available rainfall to increase productivity and profitability. Since 2015 experiments have been comparing farming systems and crop sequences designed to meet the emerging challenges. Experiments were established at seven locations; a large factorial experiment managed by CSIRO at Pampas near Toowoomba, and locally relevant systems being studied at six regional centres by DAF and the DPI NSW (Emerald, Billa Billa, Mungindi, Spring Ridge, Narrabri and Trangie (red & grey soils). A common set of farming system strategies have been employed to examine how changes in the farming system impact on multiple aspects of the farming system.
Systems with best commercial practices (Baseline) at each location were compared to alternative systems with higher and/or lower crop intensity, higher crop diversity, higher legume frequency, higher nutrient supply and higher fertility (with the addition of organic matter).
Sites were selected to represent a range of climatic conditions, soil types, nutritional status and paddock history. Each site was comprehensively soil tested at the beginning of the project with ongoing soil sampling conducted prior to planting each crop and again after harvest.
Depths of testing:
- soil water; 0 – 10 – 30 – 60 – 90 – 120 – 150 cm
- nitrate and ammonium N; 0 – 10 – 30 – 60 – 90 cm
- comprehensive nutrient analysis; 0 – 10 – 30 – 60 – 90 - 120 – 150 cm
There is a considerable range in soil fertility across the sites which dramatically influenced the requirements for inputs of N fertilisers in particular at some sites (e.g. Billa Billa and Pampas) where high levels were present at the start of the experimental period.
This paper explores five years of data across all geographical locations to compare the nitrogen and soil water dynamics in different farming systems across the northern region, specifically:
- Changes in system nitrogen dynamics due to increasing legume frequency, increasing fertiliser inputs and decreasing crop frequency
- Where the nitrogen is in the soil profile and how it moves over long fallows and different fertiliser regimes
- Dynamics of soil water over different crop sequences demonstrating how these influence crop water extraction and accumulation during fallows
- How soil water availability influences crop water use efficiency and
- How crop type influences fallow efficiency.
How does increasing legume frequency impact on system N dynamics?
Grain legumes are integral in current farming systems. The area and frequency of legumes has consistently increased due to high grain prices and a belief that they improve soil fertility and reduce overall nitrogen (N) fertiliser input costs. The data produced from the Farming Systems project has allowed us to compare the effects of increasing legume frequency on N dynamics over a large geographic area. However, it is important to note here that as the project only has five years of data, all these systems have only planted 1 or 2 extra legume crops compared to the Baseline.
To date, results across our sites show that additional legume crops in the crop sequence has had little positive impact on soil mineral N except at Billa Billa (+ leg Figures 1, 2, 3 & 4). The legumes are actually utilising soil mineral N to the same extent as cereal crops and have higher N export which often offsets N fixation inputs. This result is consistent across various starting soil N conditions, from locations with very high starting mineral N status (e.g. Billa Billa - Figure 2 & Pampas – Figure 3) to locations with low mineral N status (Narrabri - Figure 4) where legumes would need to fix N to meet their needs. These results challenge the common assumption that grain legumes reduce N fertiliser needs in the crop sequence. Improved pulse breeding and agronomy has increased harvest index and hence the ratio of N removed in grain to that left in biomass, so residual N has been diminished after the crop.
What is the impact of increasing fertiliser inputs on system N dynamics?
With declining soil fertility across the northern region there is increasing interest in identifying ways to either halt or reverse the trend of increasing fertiliser inputs. Past research suggests that maximising biomass production is one way to achieve this. More biomass will increase soil organic matter levels which will build the natural supply of nutrients such as N and phosphorus. To maximise biomass production, supplying adequate crop nutrition is critical, along with providing nutrients to promote soil microbial processes.
The capacity to address nutrient depletion by increasing crop biomass and yield potential under favourable conditions was investigated, by implementing a system that increases nutrient supply budgets to target 90th percentile yield (Higher nutrient) compared to only 50th percentile yields in the Baseline. Another system was also implemented at two of the sites (Emerald and Billa Billa), Higher fertility, which also increases nutrient supply budgets to target 90th percentile yield but received an upfront addition of 10 t/ha organic carbon (as ~50 t/ha compost or manure) at the start of the experiment to raise the inherent fertility of the site. This system was designed to determine if a higher fertility level could be sustained with higher nutrient inputs.
The additional N that was applied in the Higher nutrient system (+ nut.) reduced the depletion of background soil mineral N status at eight of the ten sites (Emerald, Pampas mixed, Billa Billa & Narrabri shown Figures 1, 2, 3 & 4). The high starting nitrogen levels at Billa Billa has resulted in only one additional application of nitrogen in the Higher nutrient system for winter crop 2017, hence all systems have been utilising the original pool of N.
When comparing the Higher fertility system (+ fertility) at Emerald and Billa Billa (Figure 1 & 2) the additional organic carbon applied has dramatically increased the mineral N. The last two years has seen this system move ahead of all the systems at both sites. The largest change was seen at the Emerald site with this system holding an additional 150 kg available N/ha than the Higher nutrition system. It will be interesting to follow this system over further years to determine if this level of fertility can be maintained through the application of fertiliser rates budgeted for a 90th percentile yield potential.
These results show that applying N fertiliser to aim for a 90th percentile yield potential may reduce the mining of soil available N, and that significant amounts of additional N applied remains in the mineral N pool and hence is available in subsequent crops. To confirm this, longer term trends of underlying soil fertility such as organic carbon or total N pools will need to be assessed.
What is the impact of decreasing crop intensity on system N dynamics?
The Northern region farming system is centred on growing crops mainly on stored soil moisture. With low fallow efficiencies, the belief is often “use it or lose it”. However, others believe it is more profitable to increase fallow length to reduce the risk to individual crops by increasing soil water at planting. The nitrogen dynamics of this Lower crop intensity system (-inten.) are shown below at Pampas (Figure 3) and Narrabri (Figure 4). These systems are storing more N over the longer fallows, which is reducing N fertiliser requirements for following crops. Given the recent dry conditions and enforced long fallows it is interesting to consider the amount and location of available N for the next crop.
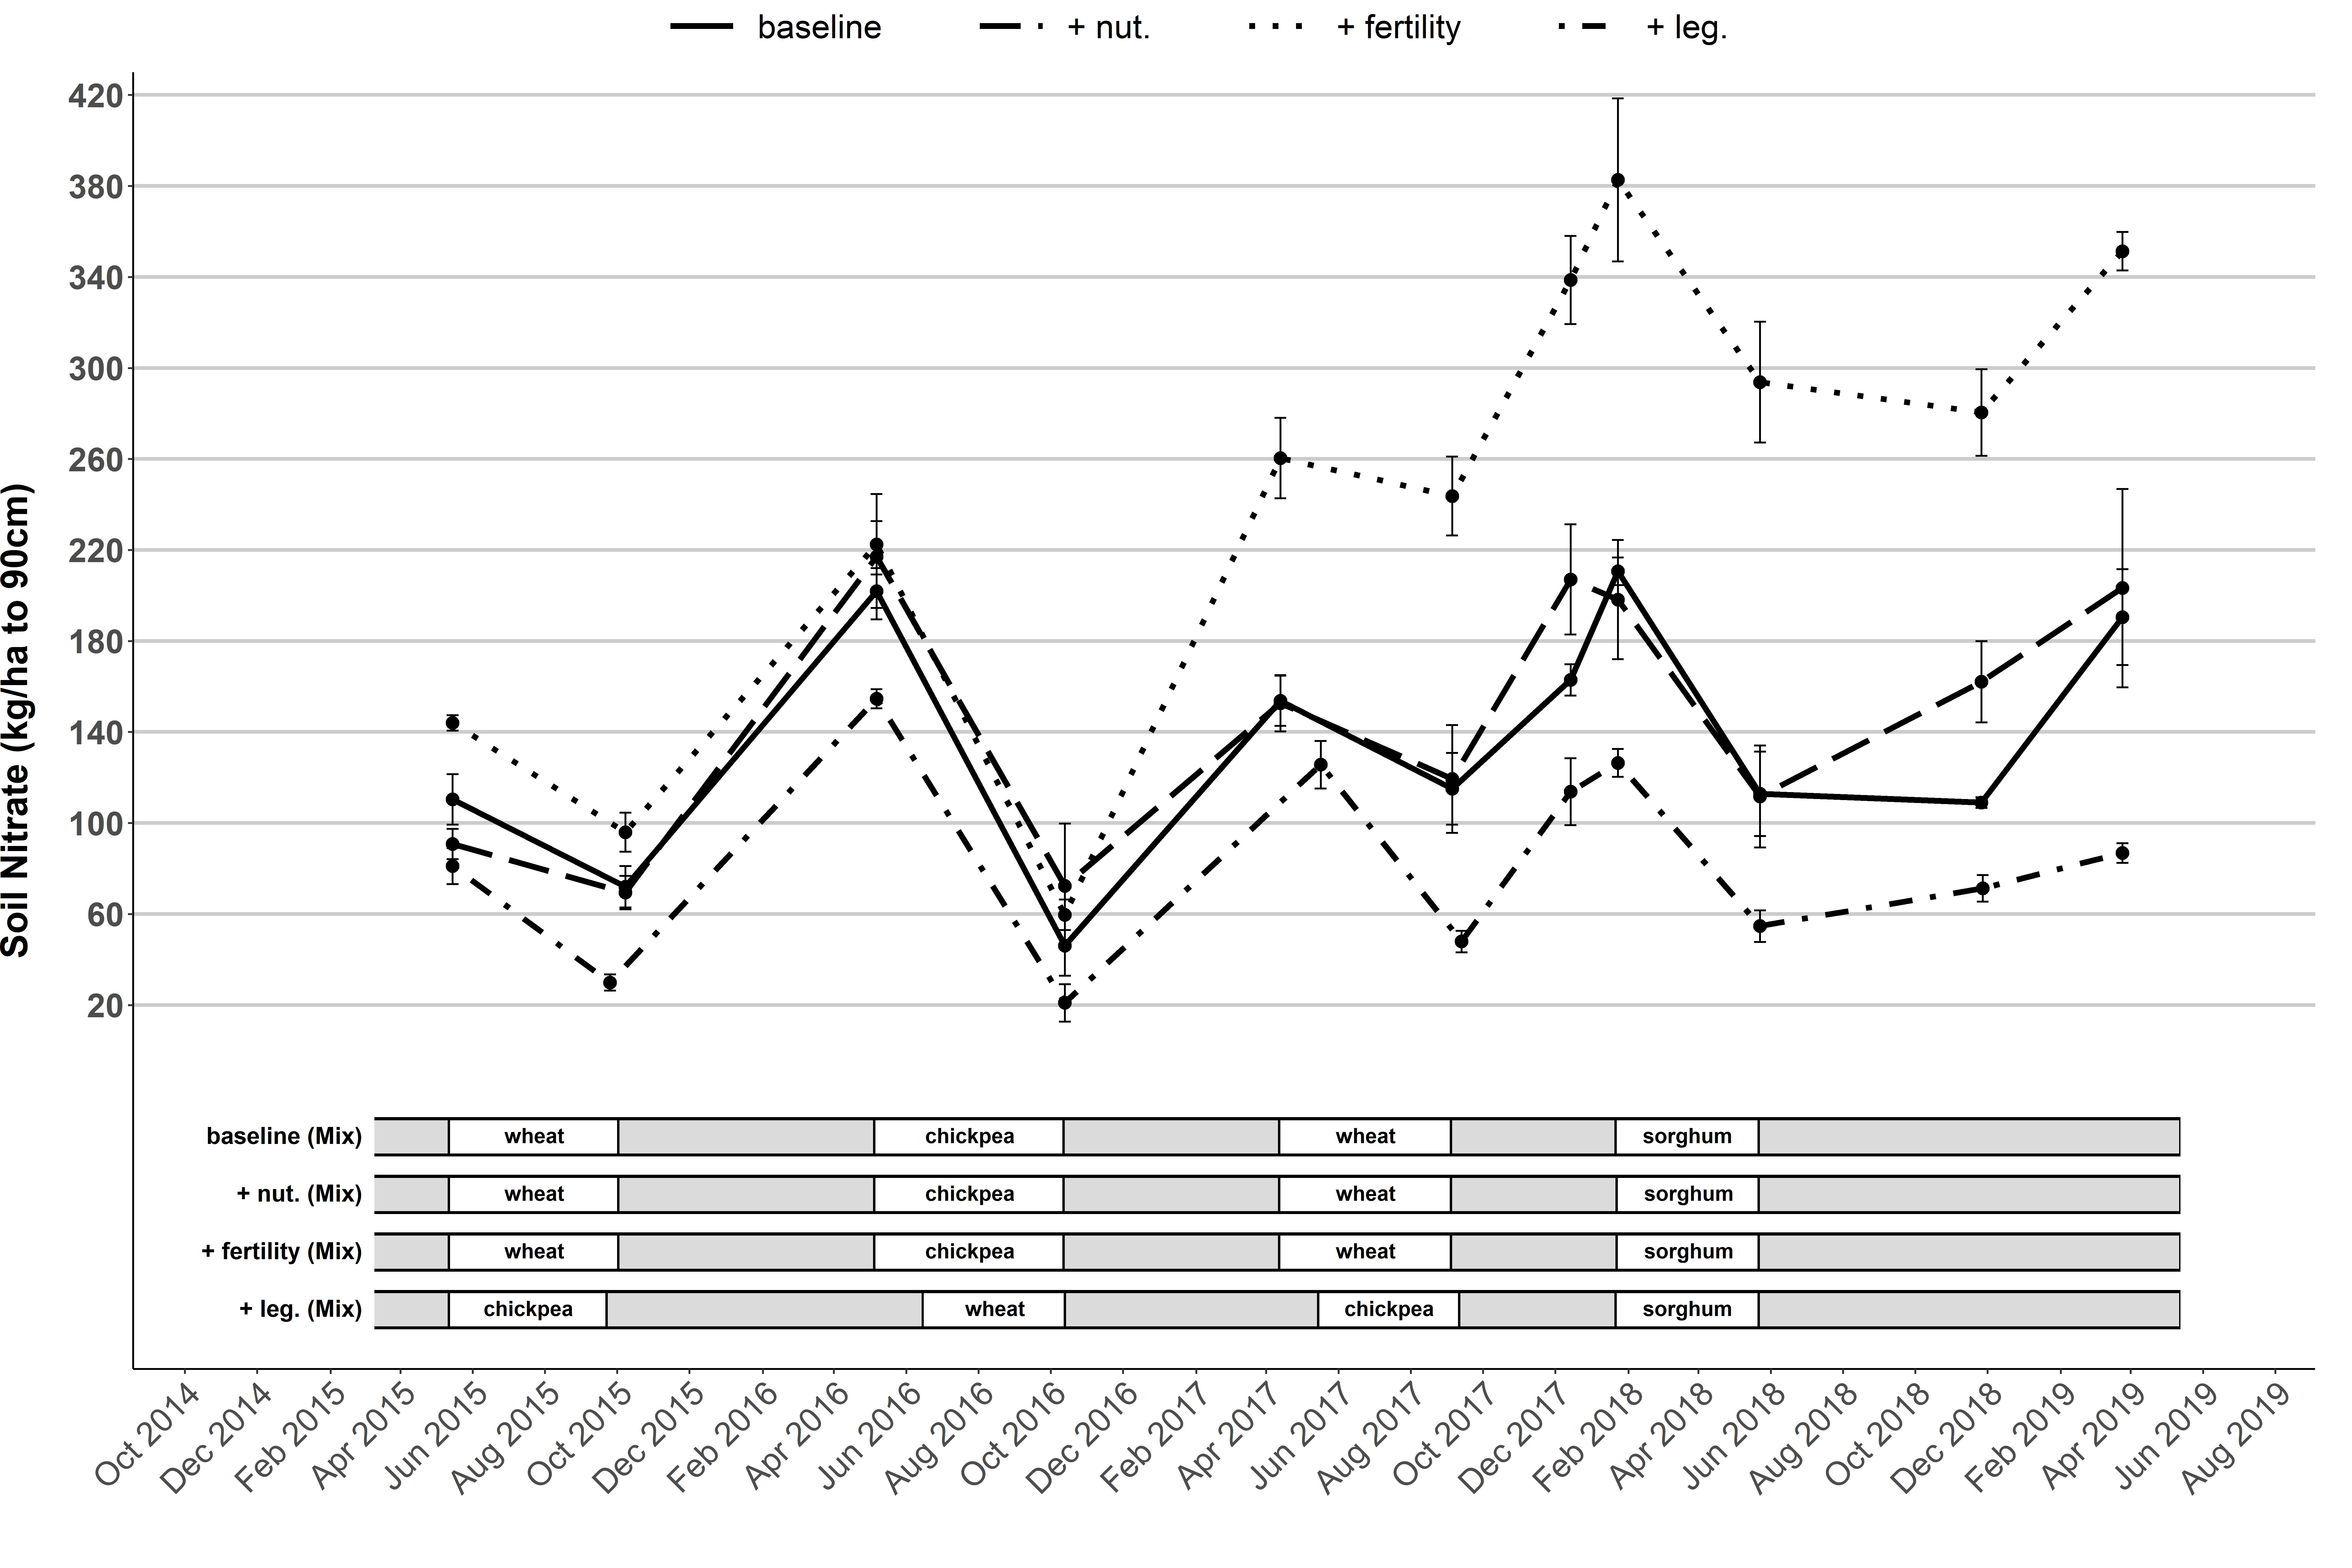 Figure 1. Dynamics of measured plant available soil nitrogen – Emerald.
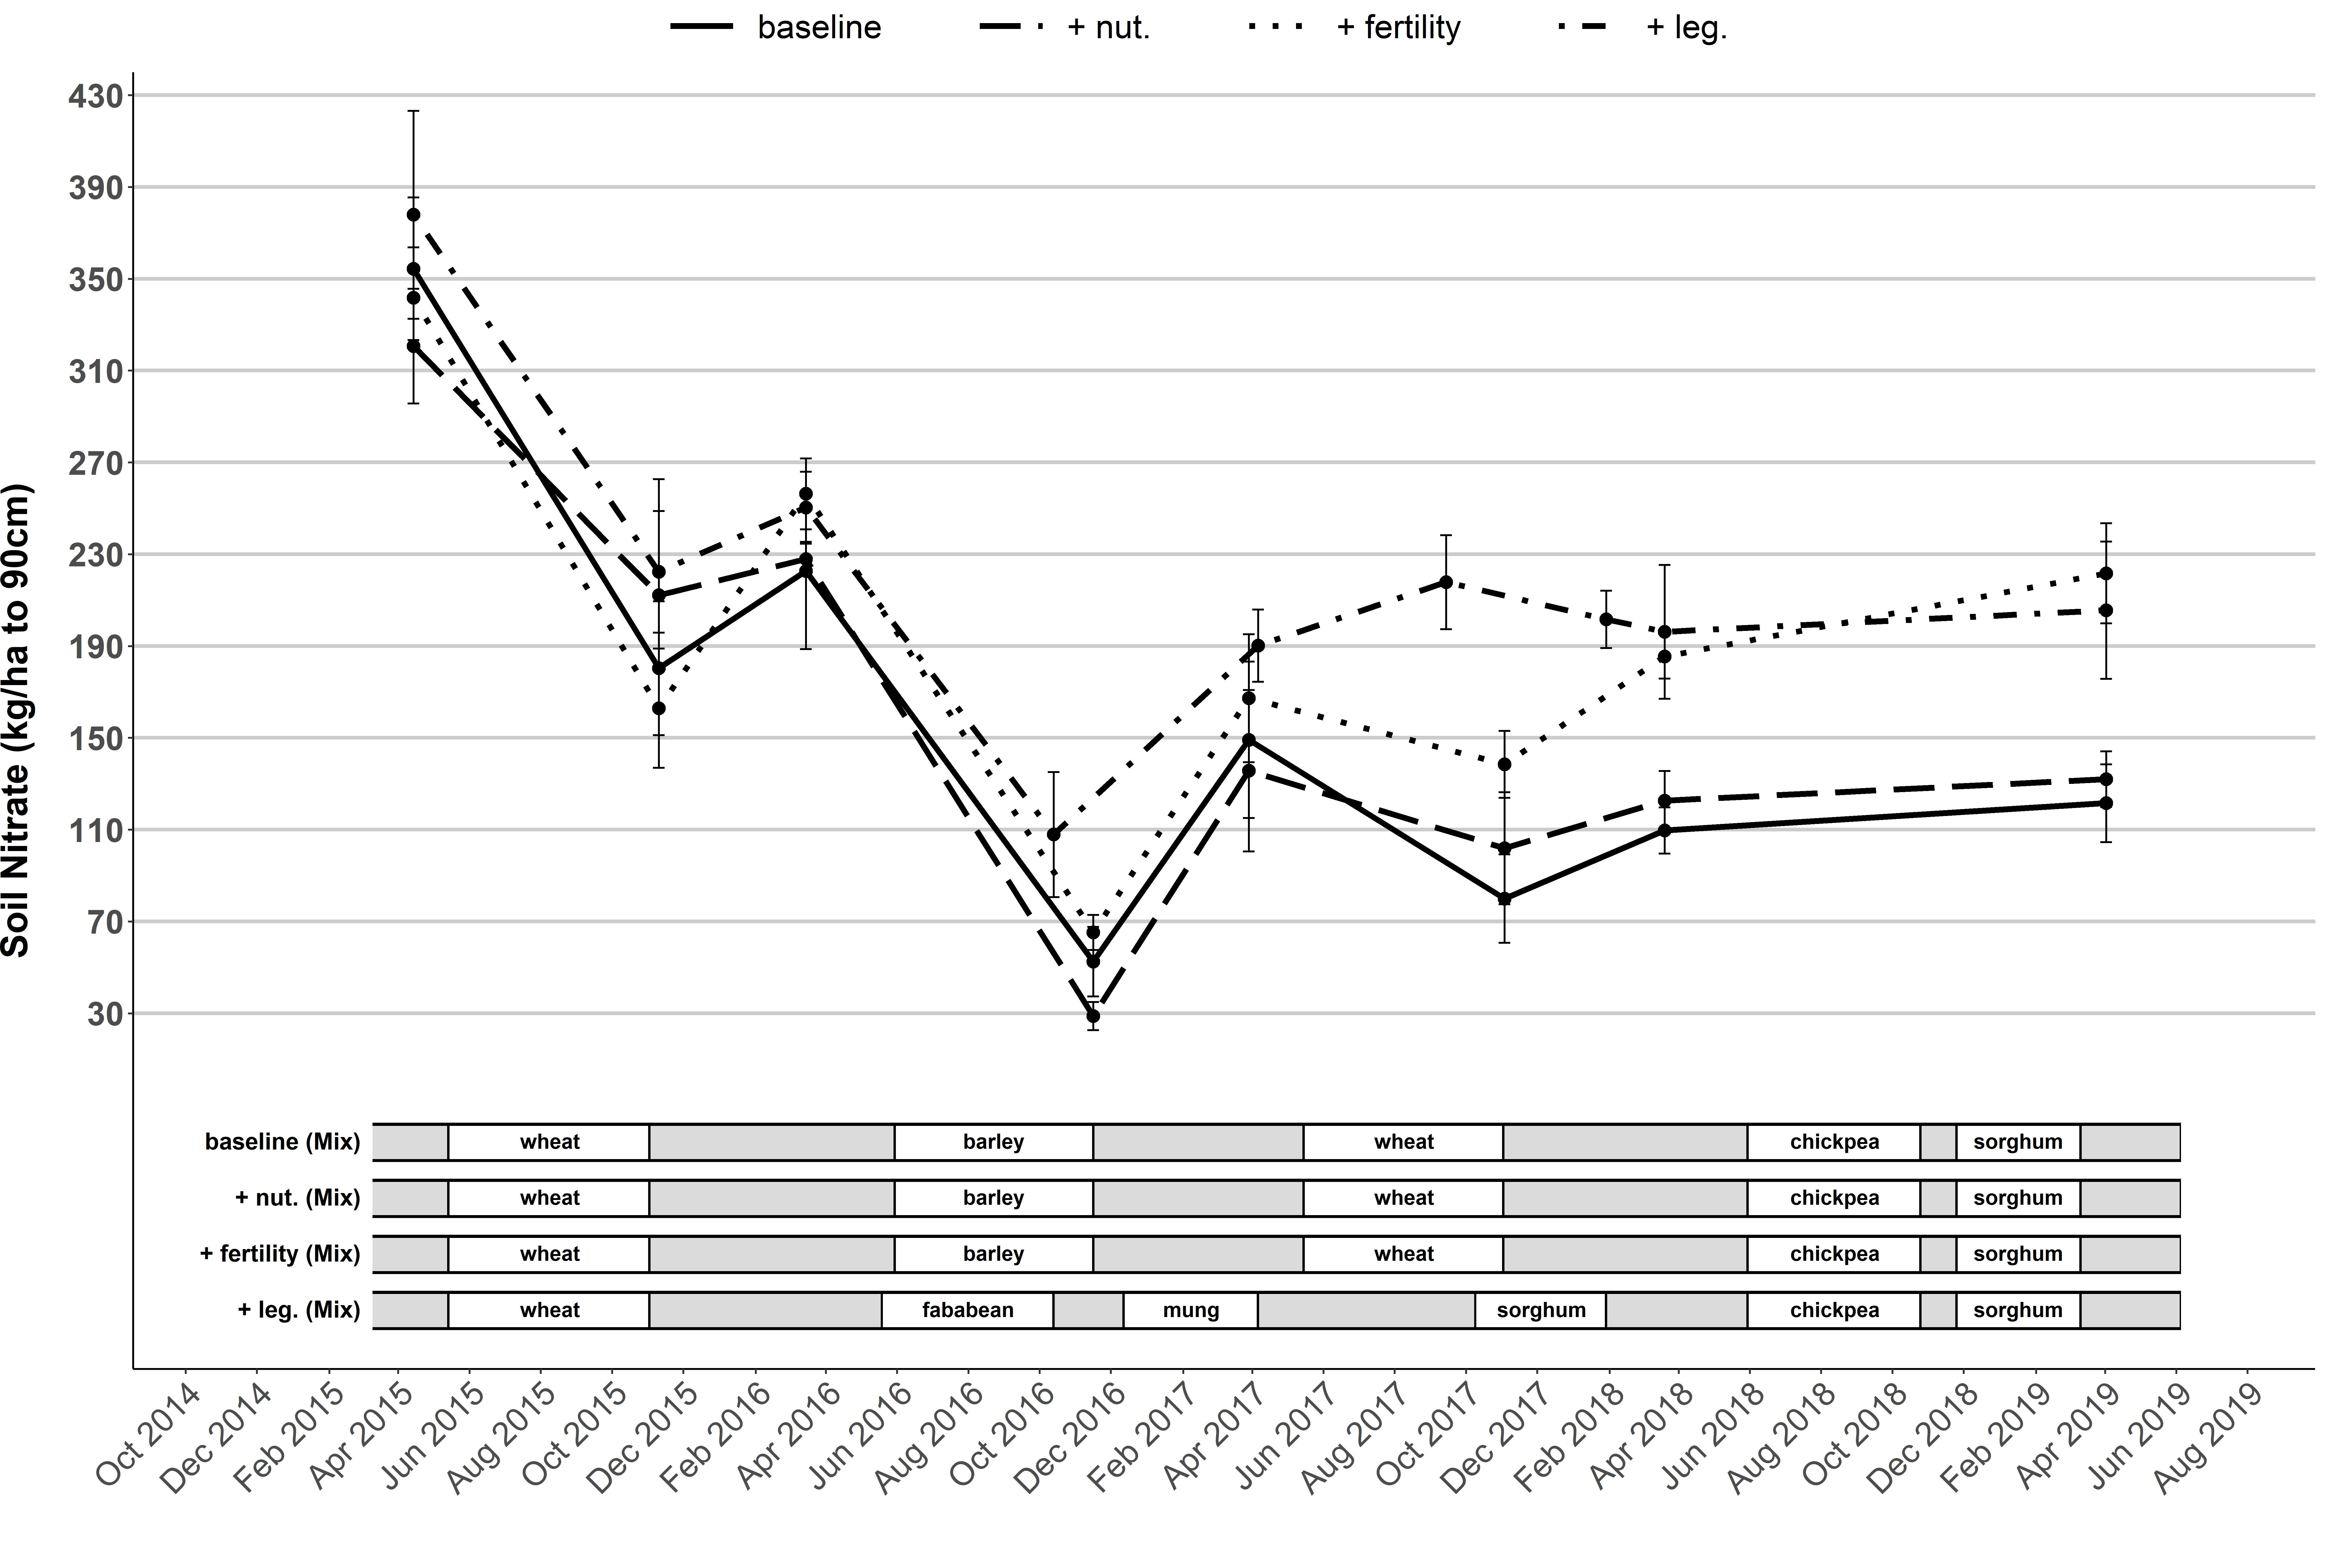 Figure 2. Dynamics of measured plant available soil nitrogen – Billa Billa.
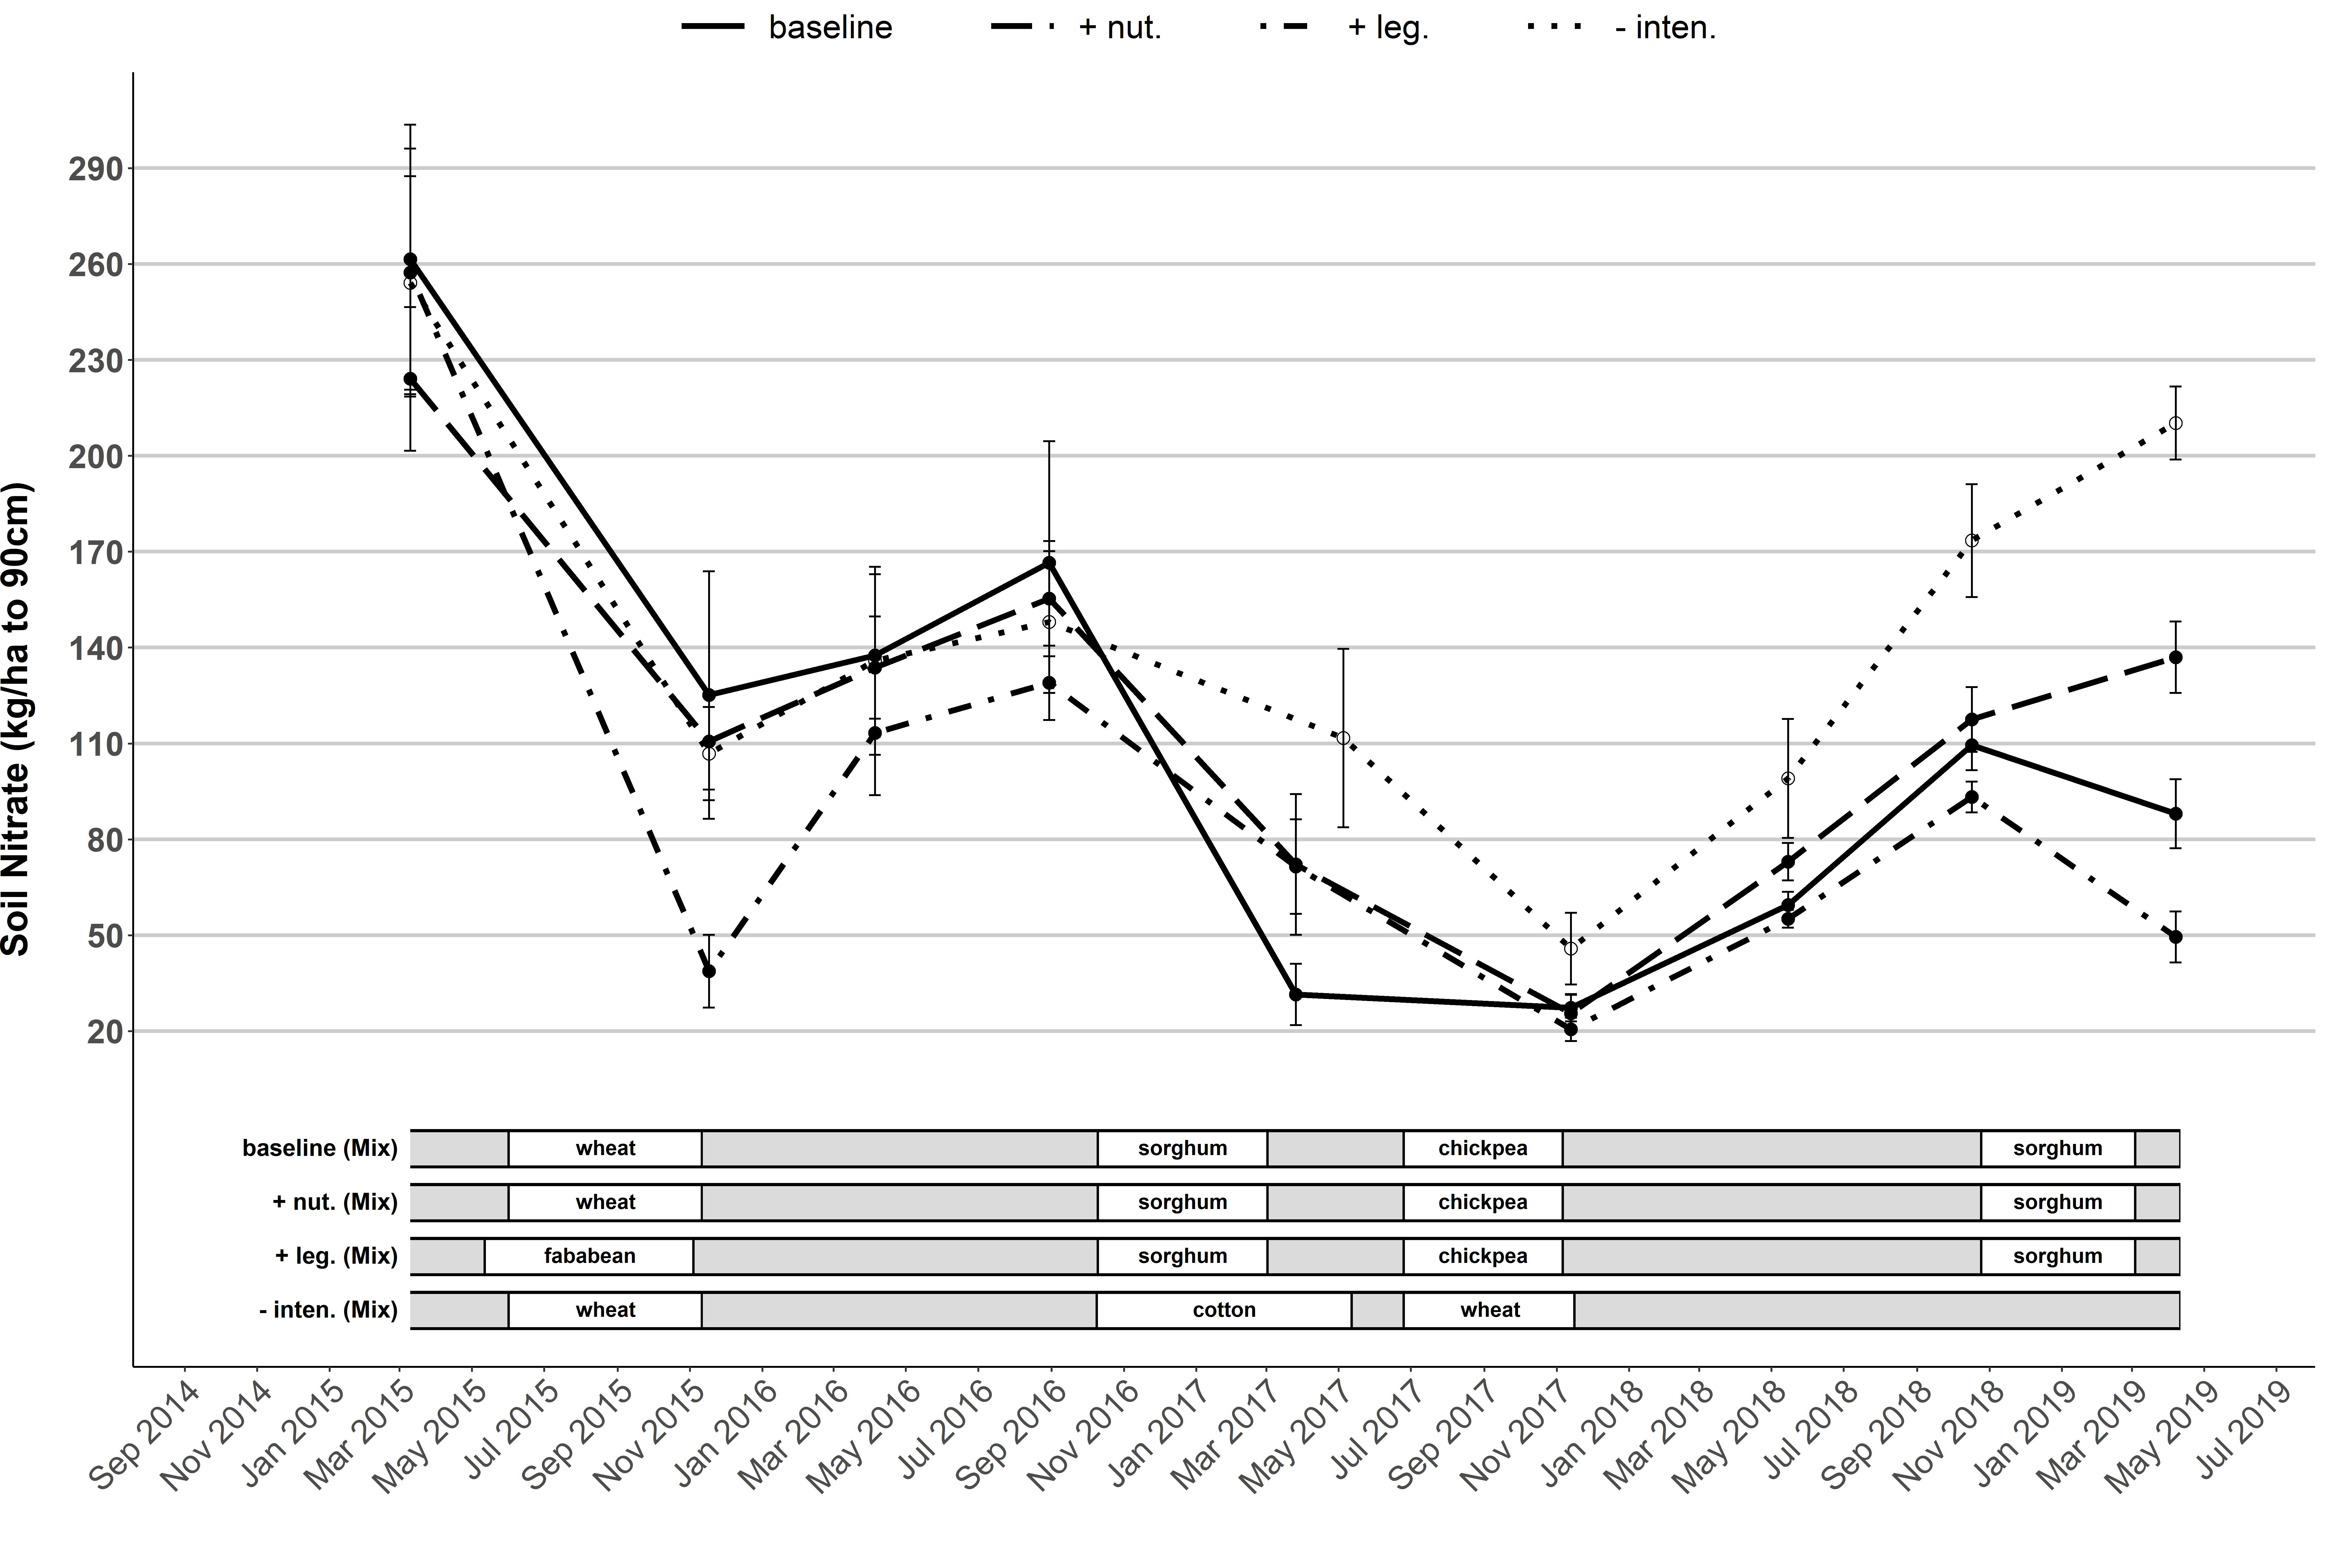 Figure 3. Dynamics of measured plant available soil nitrogen – Pampas mixed.
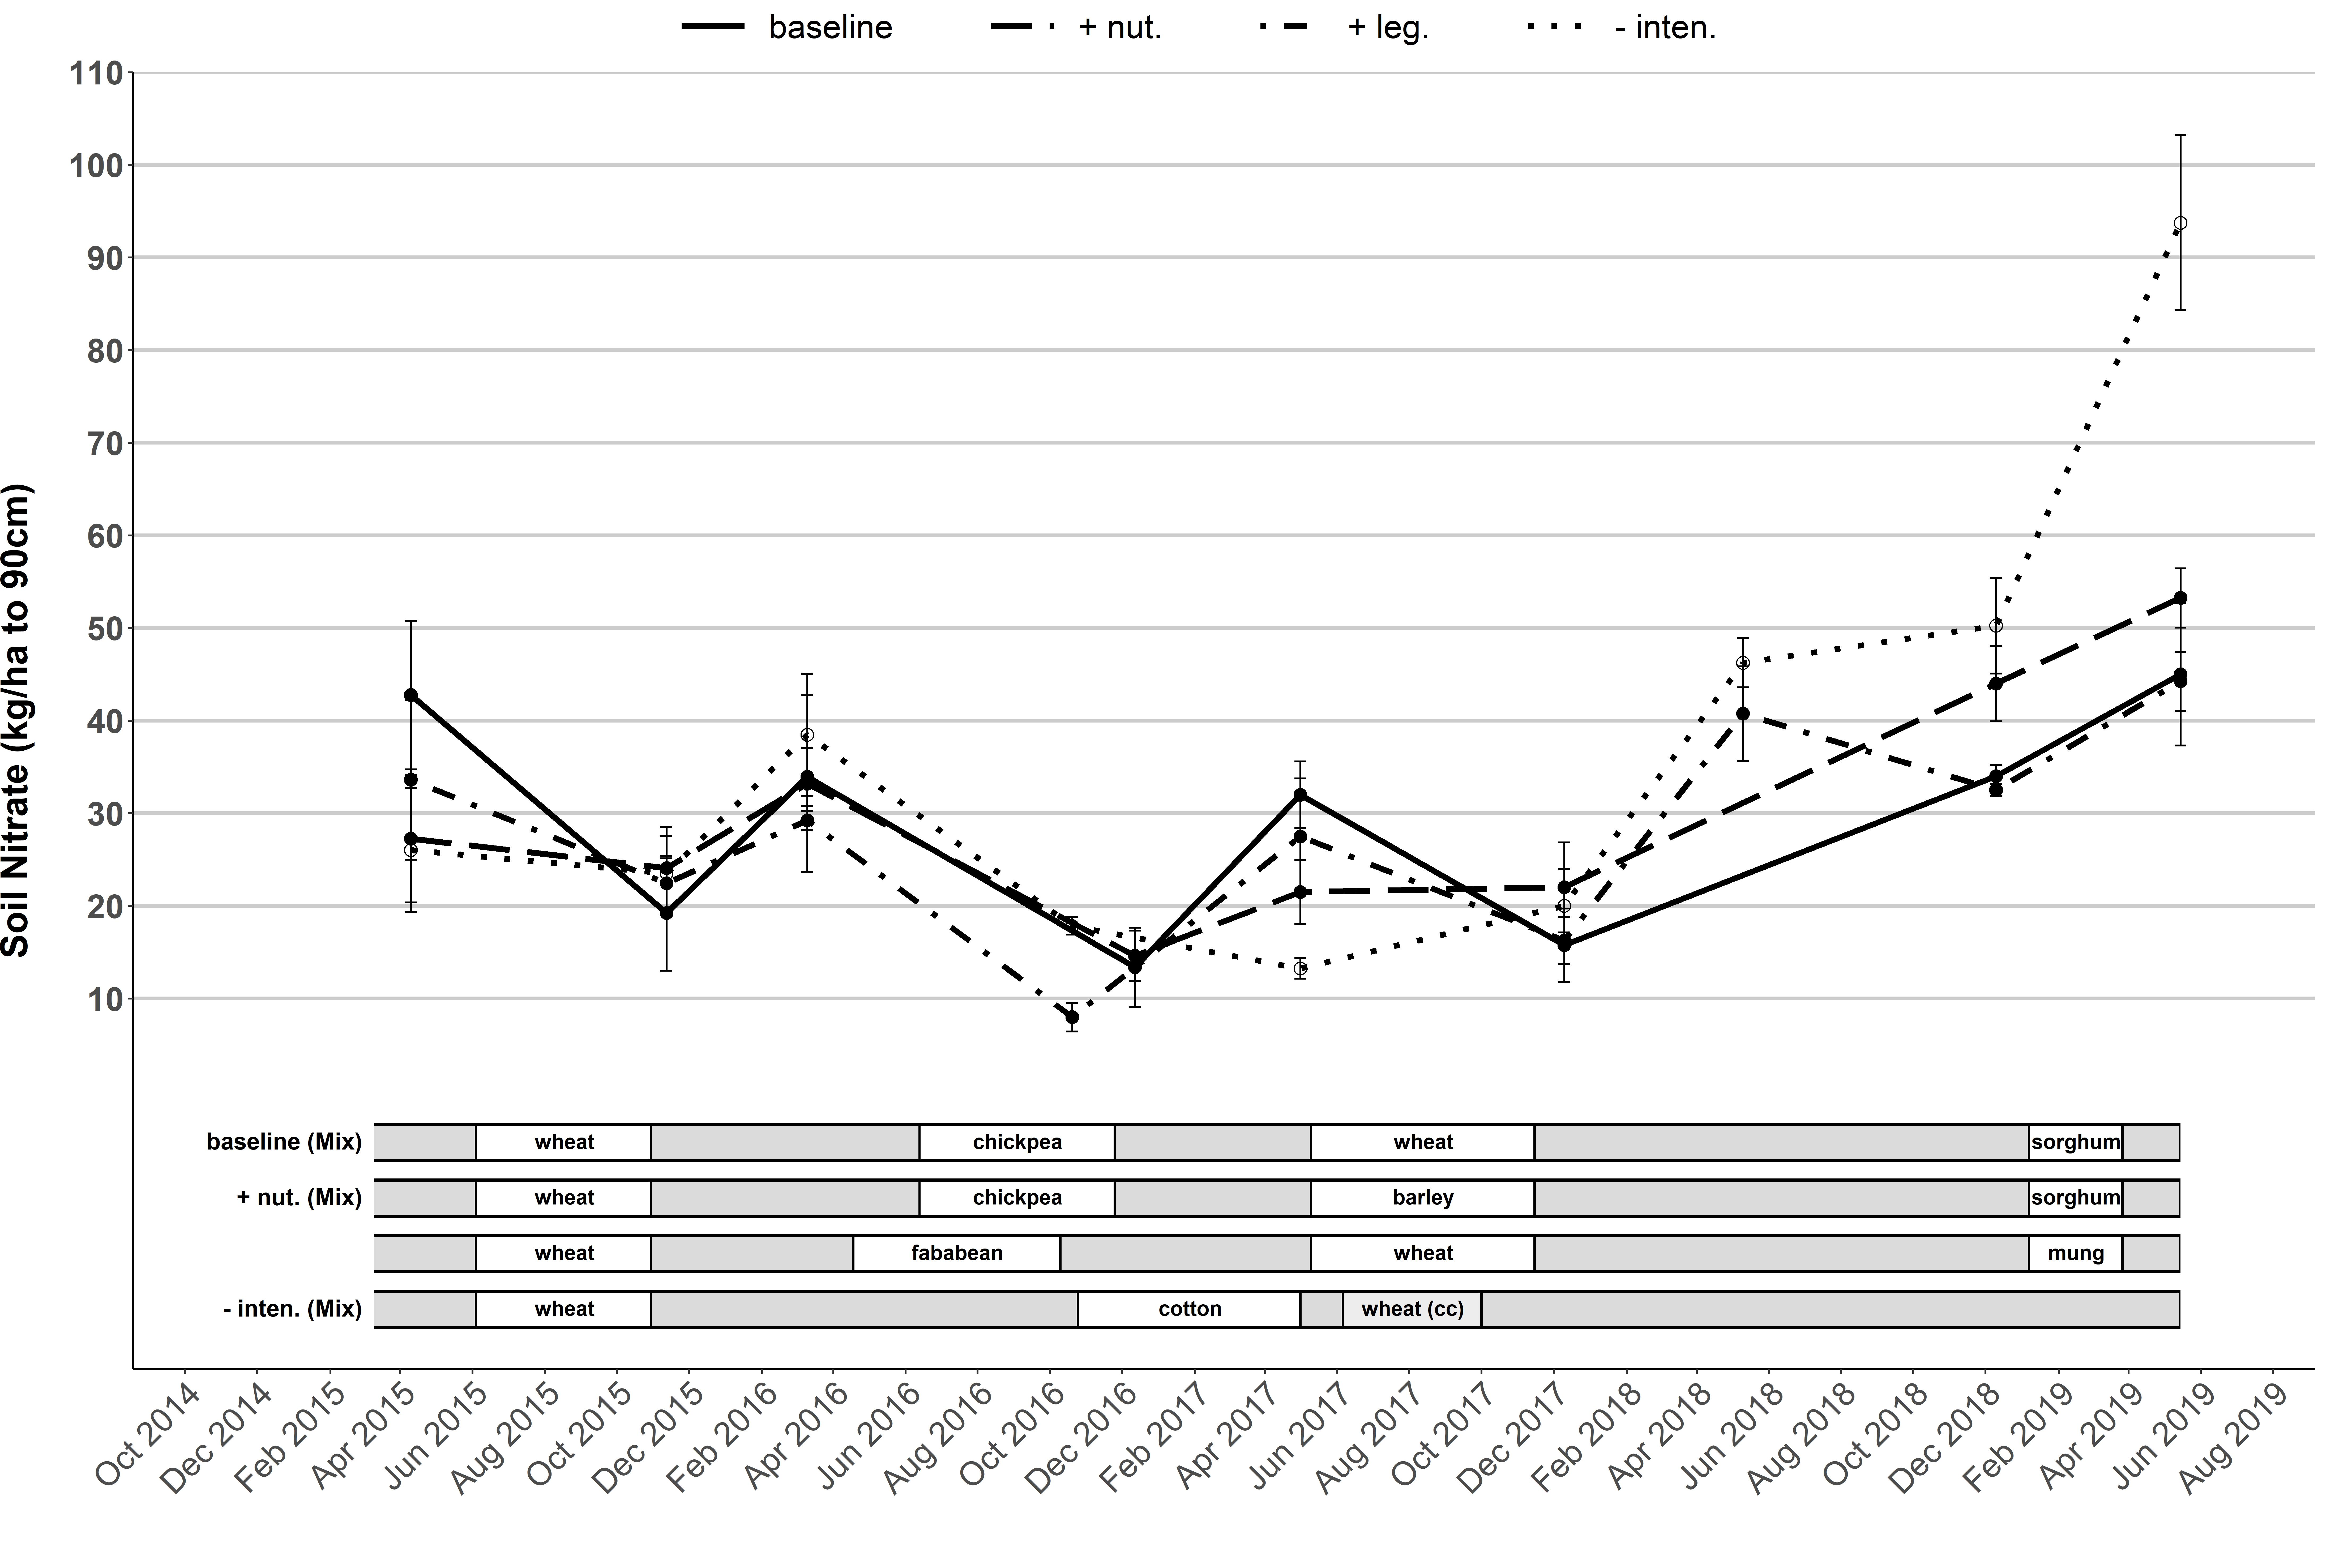 Figure 4.Dynamics of measured plant available soil nitrogen – Narrabri.
Where is the nitrogen and how does it move in the soil profile?
When studying N dynamics over time the next question becomes ‘where is the N and how does it move in the profile?’ We have compared the starting available mineral N against that available after four years and where it is positioned in the soil profile at Emerald and Billa Billa (Figure 5). The Billa Billa site with its high starting fertility has seen N throughout the profile decline over time, with the largest change seen in the 0 – 10 cm. However, the Emerald site with its lower starting fertility and use of N fertiliser across all systems, has seen both the Higher nutrient and Higher fertility systems building N. The majority of this increase was in the 30 – 90 cm layers, indicating that excess N has moved down the profile during this time frame but is still available for future crops.

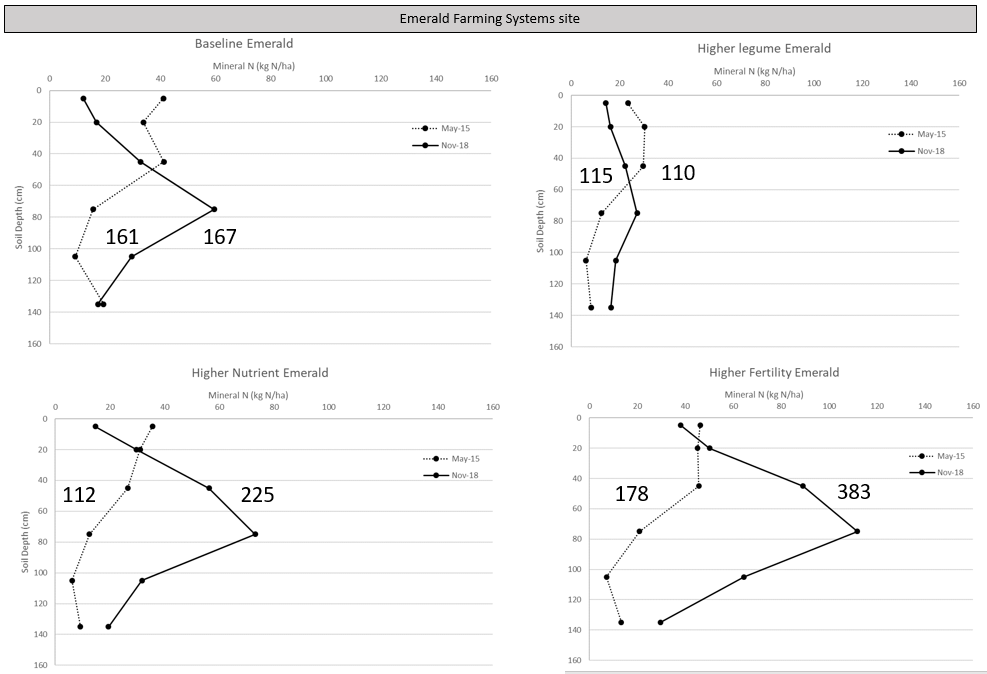 Figure 5. Distribution of mineral N placement within the soil profile from 2015 to 2019 at
Billa Billa and Emerald.
We know N mineralisation is related to soil type, organic carbon, biomass and rainfall – but what happens during extended dry periods such as the last 18 months across the northern grains region? After the initial increase of mineralised N in the topsoil across several sites, there was a definite movement of mineral N down through the soil profile. For instance, the summer season of 2017/18 saw significant levels of mineralisation within the 0 - 30 cm depth at the northern farming systems sites (Figure 6 - Narrabri and Pampas). This summer recorded below average rainfalls, but there was obviously still sufficient rain to trigger mineralisation. The increase in the 0 – 30 cm corresponds with the location of microbes responsible for the breakdown of organic matter into the plant available form of nitrate and ammonium. Sampling after the winter of 2018 found that the N mineralised during the previous summer, had filtered down the profile into the lower depths (30 - 60 cm). This pattern continued late into the fallow as the accumulated mineral N increased in the 60 - 90 cm depth. These results show that mineralisation can be triggered by even small falls of rain and this N can then move down the soil profile even with lower soil profile moisture levels or when rain does fall. This is important for the next phase of the cropping sequence, as it can be assumed that not only do we have ample mineral N available to maximise grain yields, but the location of the N is within the soil layers where plants require peak N uptake during key growth stages.
The Mungindi site (Figure 7) had preplant N applied for a winter crop that was not planted (2017). The Baseline received 20 kg N/ha and the Higher nutrient system received 80 kg N/ha in April 2017. The following year soil analysis showed that large amounts of N had mineralised and that this mineralised N and fertiliser N moved into the 10 - 30 and 30 - 60 cm layers during a very dry year. This data shows that if N is applied and not utilised by a crop that it may not be lost from the system but rather move down the profile to support future crop growth and grain production.


 Figure 6. Distribution of mineral N placement within the soil profile over a long fallow period at Narrabri and Pampas.
 Figure 7. Distribution of mineral N placement within the soil profile over a long fallow period at Mungindi.
Untangling the water use efficiency of crop sequences
System water use efficiency of a crop sequence is driven by the efficiency of its fallows (i.e. the proportion of rain falling during the fallow that accumulates in the soil to be available for the next crop) and how efficiently the subsequent crops can convert both the accumulated soil water and in-crop rainfall into grain or product. We have monitored crop water use, water use efficiency and subsequent fallow water accumulation for over 300 different crops to explore how soil water accumulates and is used over different crop sequences.
How does cropping intensity impact on plant available water (PAW) dynamics?
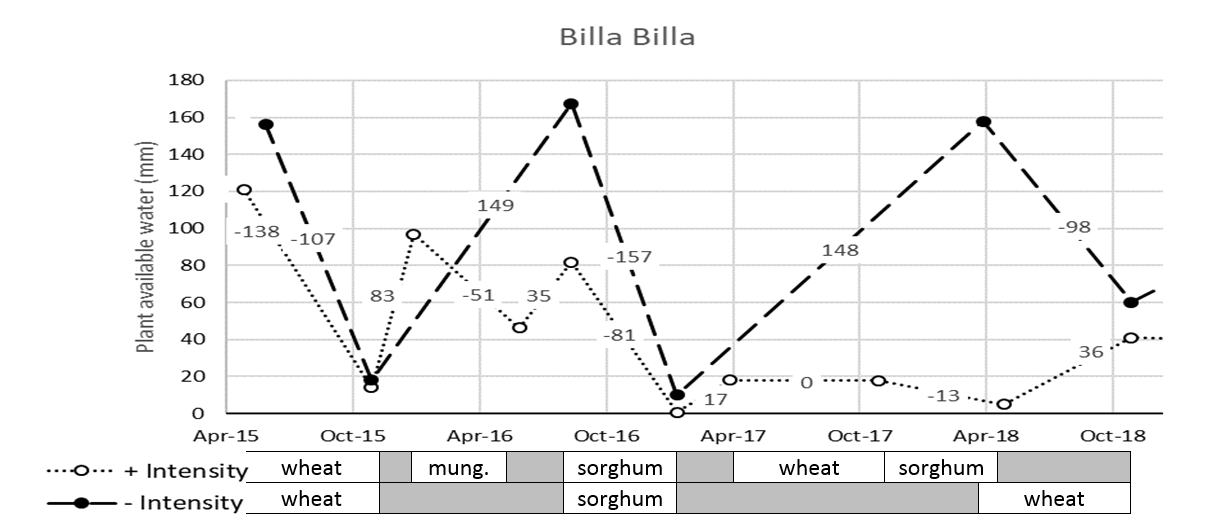
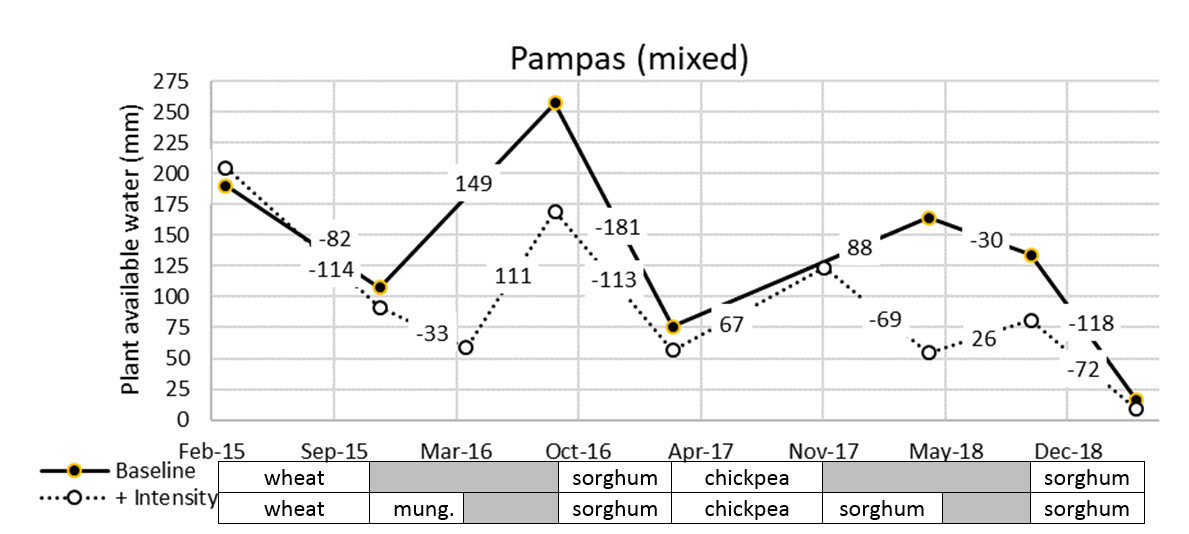
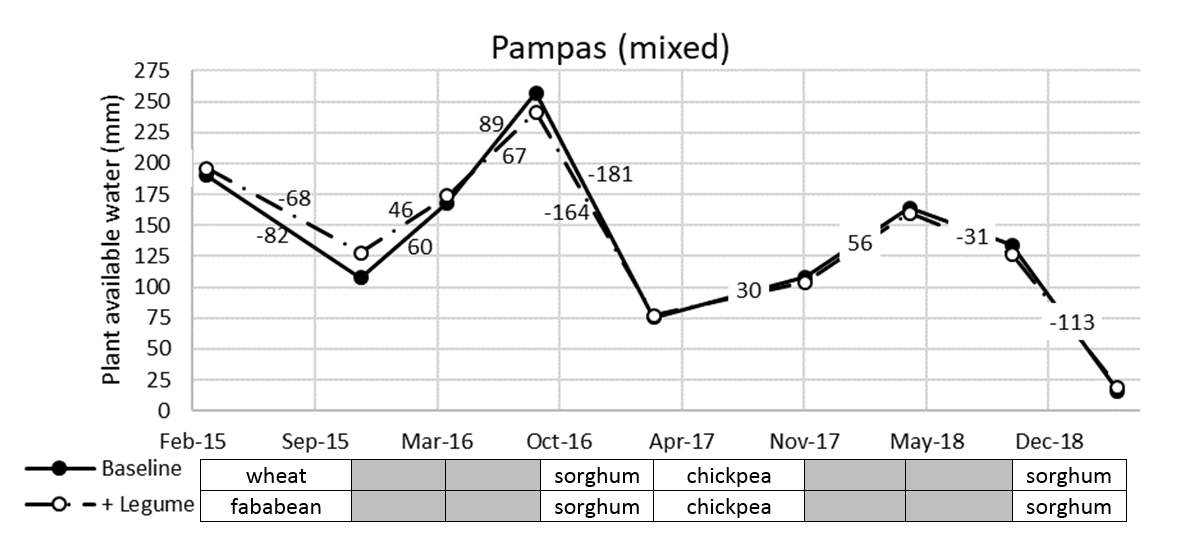
Cropping intensity impacted on the depth of recharge of the soil profile. In the two examples below at Billa Billa (Figure 8) and Pampas (Figure 9) the higher intensity soil profile was never allowed to refill as fully as the Lower intensity and Baseline systems. While there are implications on yield and WUE (discussed later in this paper) for having less stored water, not allowing the profile to fill may also affect the plants’ ability to extract deep nutrients.
How does crop choice impact on PAW dynamics?
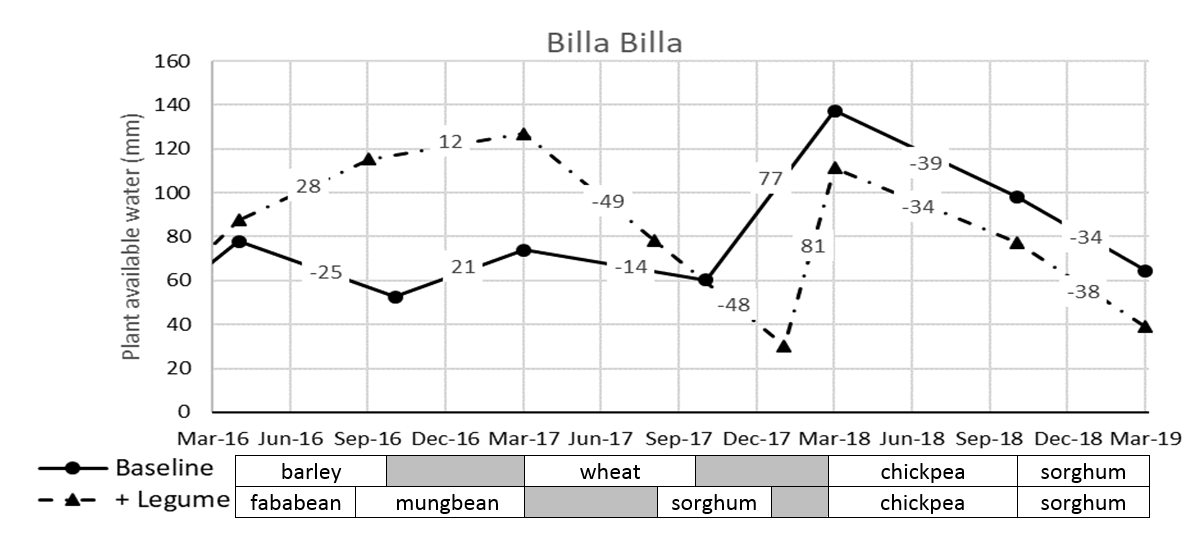
The Billa Billa Belah duplex soil is constrained by sodicity at depth, so pulse crops have left water below 50 cm. This deep PAW and rainfall at opportune times has allowed double cropping after pulses – an option that was not available in the systems where cereal crops (or canola) were grown (Figure 10) due to their higher ability than pulse crops to extract water from sodium constrained zones. This has allowed the Higher legume system to increase its cropping intensity, with the same PAW planting triggers as the Baseline. Similarly at Billa Billa, the Lower intensity wheat grown in 2018 reduced the profile by 98 mm (Figure 8) while chickpeas in the Baseline and Higher legume systems only reduced the profile by 39 and 34 mm respectively (Figure 10), allowing them to double crop to sorghum on the next rainfall event.
On the ‘less constrained’ black Vertosol at Pampas, the difference in PAW extraction is much less stark. There is still a difference in crop lower limits between the pulse and cereal crops, however the difference is much less. For example, faba beans and wheat were planted in the same season, with similar starting PAW (Figure 11). At harvest the wheat had extracted 14 mm more than the faba bean (compared to 53 mm in the constrained site). After harvest the wheat accumulated an extra 14 mm PAW, so that the two systems had the same PAW again when a winter crop was planted in the winter only systems. However, in the mixed systems the fallow was continued to sorghum in October 2016. With the longer fallow, the wheat stubble continued to provide higher fallow efficiency so had 12 mm more PAW at planting than the faba bean stubble. The extra stored PAW was used by the following sorghum crop, so that the two systems had the same PAW post-harvest and have maintained the same rotation and similar PAW since (Figure 11).
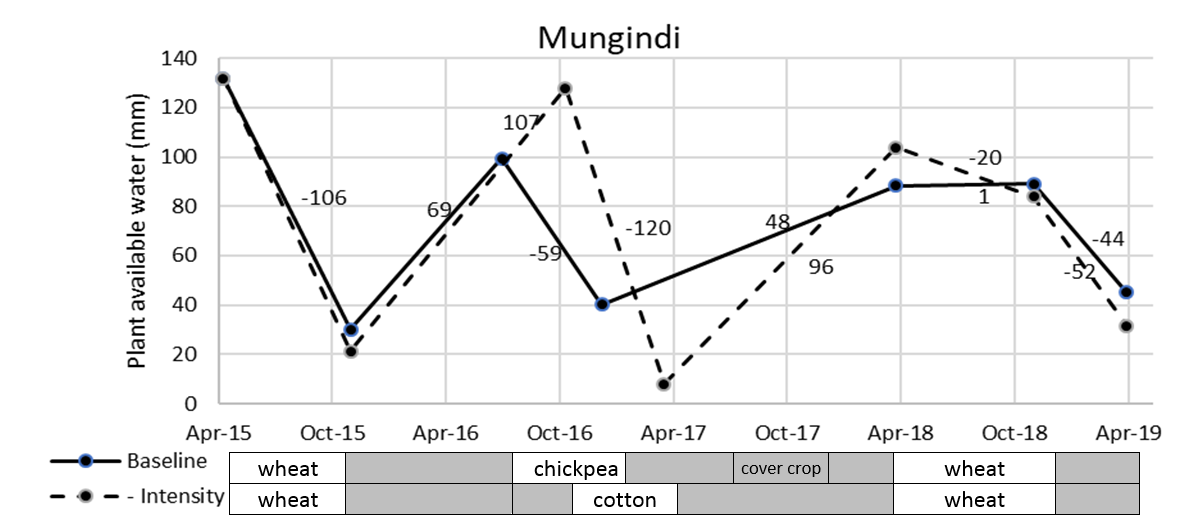
At Mungindi the Baseline and Lower intensity systems had the 2015 wheat crop in common. However, in 2016 the Baseline was planted to chickpea, while the Lower intensity was fallowed to cotton in the spring (Figure 12). A large portion of the rain that fell in that season was in the spring, when the chickpea and cotton crops were both in the ground, but with very little rainfall from chickpea harvest to cotton harvest. The cotton crop left the soil 32 mm drier than the chickpea at their respective harvests (chickpea was 19 mm drier at cotton picking), but a combination of residual wheat stubble and dry cracked soil post-cotton, resulted in the lower intensity system having an extra 15 mm PAW when the two systems were planted to wheat in 2018.
Drivers of crop water use efficiency
The availability of water is a key driver of crop yields in Australian farming systems and hence understanding what drives crop water use efficiency (WUE; the kg of grain produced per mm of crop water use) is critical. A relationship between grain yield and crop water use has been widely used to demonstrate the WUE potential of crops across different environments. In northern farming systems the water available to the crop can come from stored soil water at planting and in-crop rain; In contrast to southern Australia where in-crop rain alone has often been used to calculate crop WUE. Further, the unreliability of in-crop rain can mean that the stored moisture can make up a large proportion of the water available to the crop, and hence has high importance for determining crop yield and crop WUE.
Using the data collected from the farming systems experiments we show that the marginal WUE (kg/mm of additional crop water use) reached its potential at 24 for wheat, 12.5 for chickpea and 18 for grain sorghum. Despite this potential and optimal crop management in these experiments, in most cases the average across all the crops measured was lower; 15.3 for wheat, 8.8 for chickpea and 14.3 for sorghum (Figure 13, TOP). This demonstrates that while WUE is a useful benchmark, there is large season to season variability due to the timing of rainfall events or other stresses that may reduce crop yields.
There is no clear relationship between planting soil water and crop yield across this data, due to large seasonal differences in in-crop rain. Nonetheless, we found some interesting relationships between available soil water at planting for the crop and the marginal WUE that that crop achieved (Figure 13, MIDDLE). This shows that in general, the WUE of crops increases as more soil water is available at planting. Crops of wheat, chickpea and sorghum that had less than 100 mm of plant available water coming into the season, had much less chance of achieving high crop WUE. This is because crops planted on marginal soil moisture are more at risk of depleting the soil profile prior to flowering and the critical grain filling period, unless significant in-crop rainfall occurs. This data suggests that chickpea may be less susceptible than wheat or sorghum to this. We could hypothesise that this is because chickpea has a lower water requirement prior to the start of grain filling and the indeterminate growth habit means that acute water stress at critical phenological times impact less severely on grain yield.
Finally, the gap between the marginal WUE of each crop compared to the potential predicted here (dashed lines) increases significantly in crops with lower soil water prior to planting. Figure 13 (BOTTOM) shows the rate that crop WUE declines per mm of available water across a range of starting soil water conditions. This indicates that the lower the soil water is at planting, the more quickly that WUE will decline. This further demonstrates that crops planted on lower soil water are likely to achieve suboptimal crop WUE and this relationship is not linear. That is, as less soil water is available, the likely reduction in WUE increases further.
In summary, this analysis shows that soil water prior to planting is a critical driver of how efficiently a crop converts the water available to it into grain. It is worth noting however, that this analysis was done using soil water samples prior to planting and hence, in some cases did not include the planting rainfall event itself. Hence, if another 15-20 mm is required to achieve this then this was not included these calculations of soil water at planting.
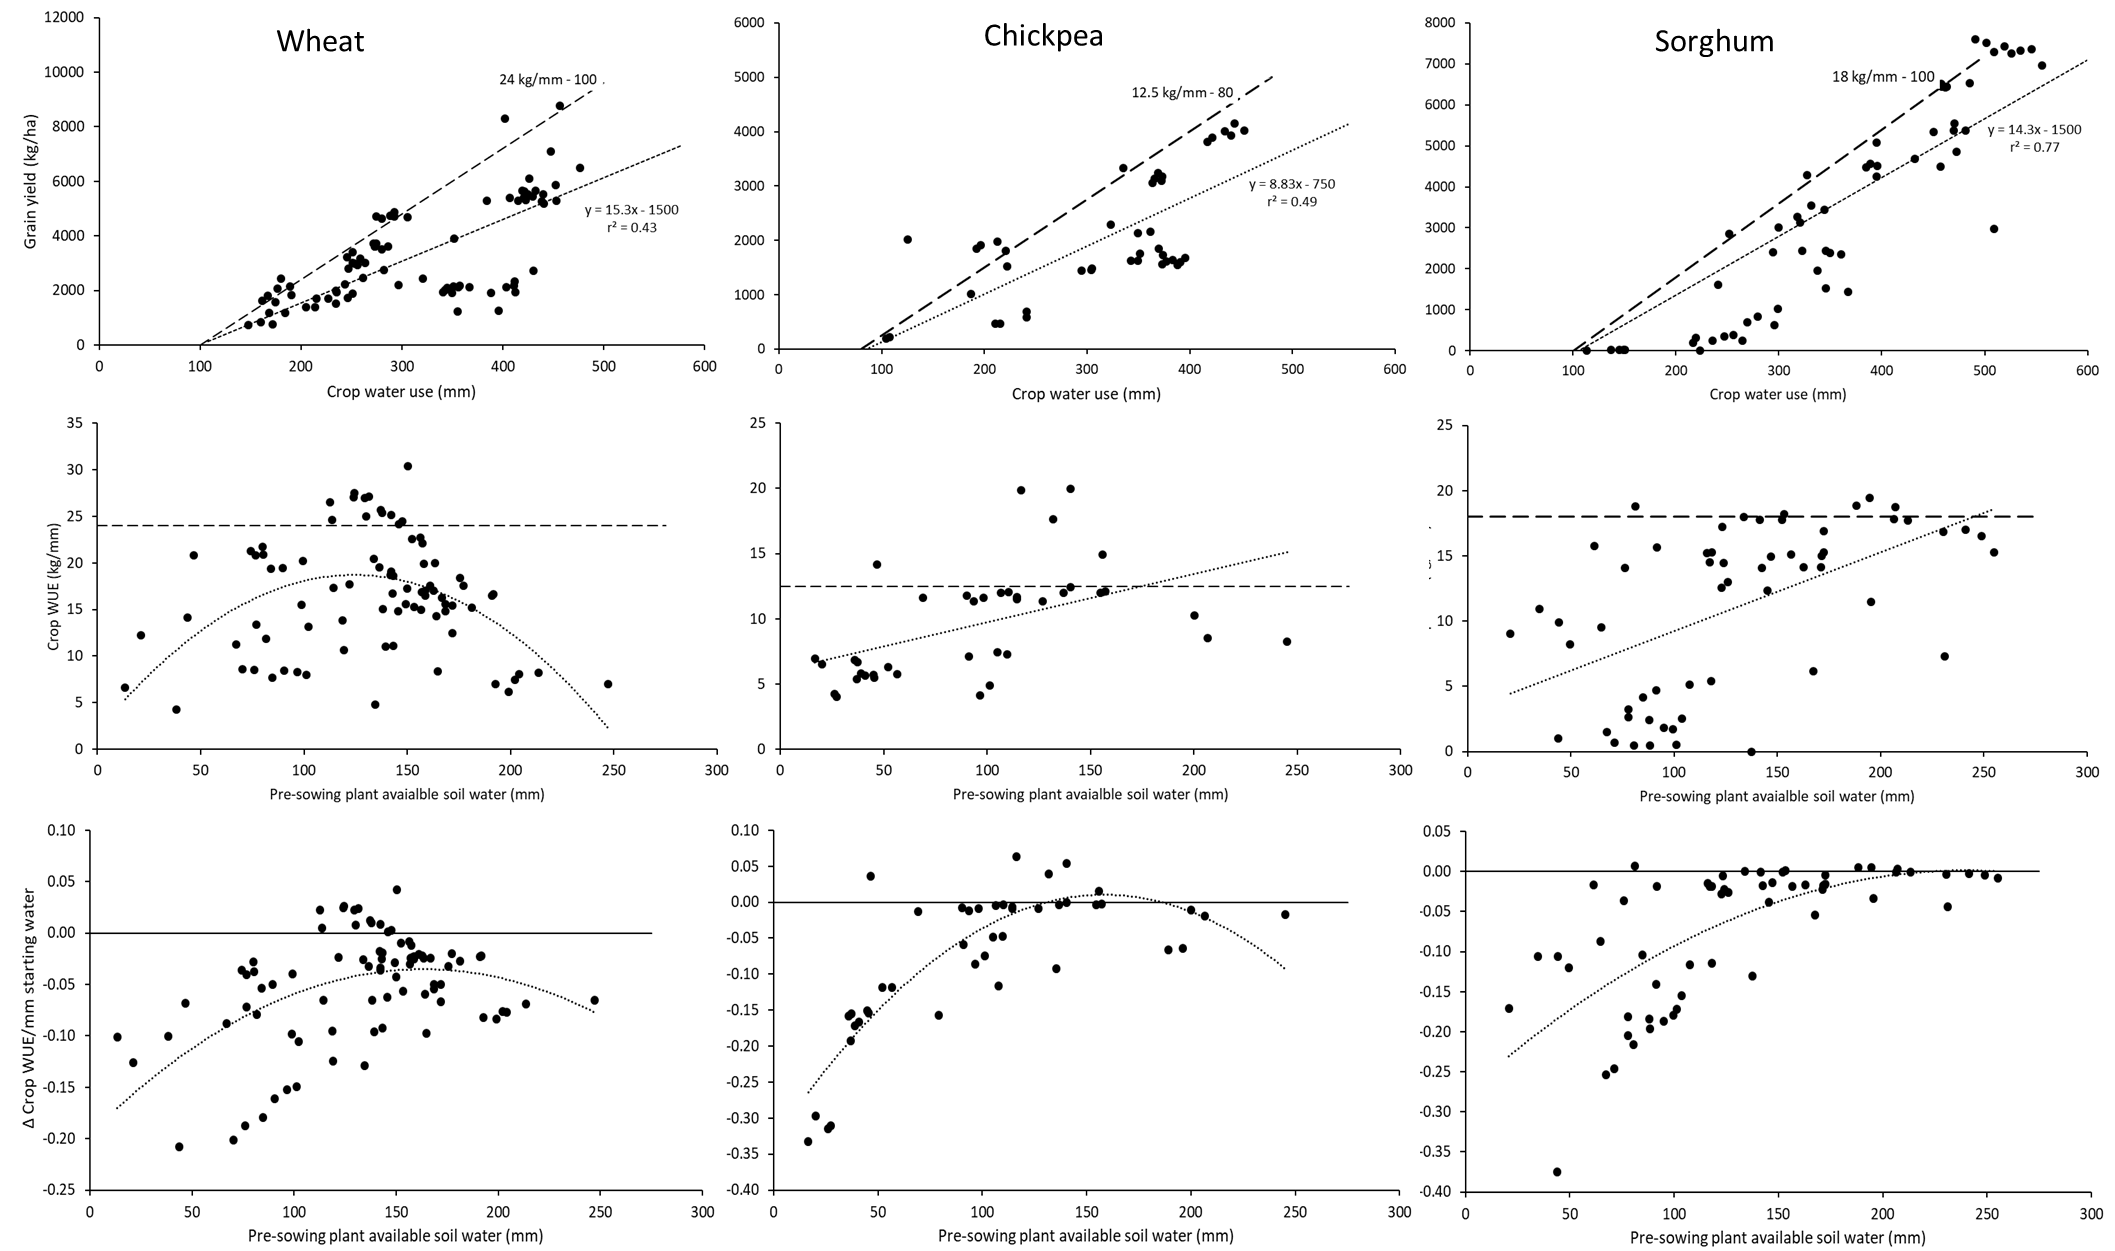 Figure 13. Relationships between water availability and crop yield and water use efficiency (WUE) in wheat, chickpea and grain sorghum collated from data collected across farming systems research sites. TOP –Crop water use (change in soil water plus rainfall) vs. grain yield, showing the maximum potential (dashed line) and the average across the dataset (dotted line); MIDDLE – Plant available soil water prior to planting vs. crop WUE (as calculated above); and BOTTOM – Plant-available soil water prior to planting vs the difference between the measured crop WUE and the potential WUE per mm of additional water available (dashed lines in above figures).
Crop effects on efficiency of subsequent fallows
Here we have collated this data to compare how different crop types impact on subsequent fallow efficiencies (Table 1). We have removed fallows with little rain (<80 mm) because this distorts the values of FE.
Based on > 20 different fallows we monitored, this quantifies some clear crop effects on subsequent fallow efficiencies – typically related to the ground cover provided and its persistence. Winter cereal crops provide the highest fallow efficiencies while the lower cover after winter pulses results in lower fallow efficiencies. Sorghum is intermediate. With fewer observations, fallow efficiencies after canola were intermediate between the winter pulses and winter cereals. Cotton produced much lower fallow efficiencies. The data also clearly shows that short-fallows are more efficient than longer fallows, because during long-fallows the soil is wetter for longer and hence there is more evaporative losses and residue cover levels are reducing with time.
Table 1. Comparison of efficiencies of fallow water accumulation (i.e. change in soil water/fallow rainfall) following different crops. Data are an average of fallows monitored across the farming systems experiments in northern NSW and southern Qld between 2015 and 2019. Only fallows receiving more than 80 mm of rain are included.
Previous crop | All fallows | n. | Short fallow | n. | Long fallows | n. |
|---|---|---|---|---|---|---|
Winter cereals | 30% | 81 | 34% | 54 | 21% | 27 |
Winter pulses | 20% | 36 | 25% | 20 | 15% | 16 |
Sorghum | 22% | 23 | 28% | 7 | 19% | 16 |
Canola | 26% | 5 | 31% | 4 | 6% | 1 |
Cotton | 16% | 3 |
| 16% | 3 |
This means that the impacts of a particular crop on the accumulation of soil water in the following fallow should be considered in the cropping sequence. For example, a fallow receiving 400 mm of rain after a winter cereal would accumulate 120 mm on average, while the same fallow after a grain legume would have only accumulated 80 mm. This difference could have a significant impact on the opportunity to plant a crop and/or the yield and gross margin of the following crop in the cropping sequence.
Conclusions
Nitrogen
Improved pulse varieties and agronomy has seen greater use of pulses. This has not provided increased nitrogen benefits to following crops as the pulse crops often mine mineral nitrogen from the profile. However, increasing nitrogen budgets to 90th percentile yield potential at planting has meant crops have left nitrogen behind in most seasons, so the nitrogen can move down the profile and accumulate in the deeper soil layers. This effect is accentuated where we also added organic carbon to the system, as the soil is supplying more nitrogen to the mineral pool.
Increasing the time spent in fallow is also allowing the soil to mineralise more N, and the small rainfall events in the recent dry seasons have been sufficient to move N down the profile.
Regardless of the source, excess nitrogen was rarely lost to the system, rather it was moved down the soil profile for future crops, and presumably some has moved into the organic pool. But the only way to be sure how much and where nitrogen is positioned is with a well segmented soil test.
Water
In a northern farming system, grain yield is highly dependent on how much water is stored in the profile during the preceding fallow. The efficiency of capturing and storing fallow rainfall is driven by the stubble left by the previous crops and the duration of the fallow period. Crop type also influences how efficiently crop water use is converted to grain. This research suggests storing more than 100 mm PAW prior to planting increases the likelihood of optimising crop WUE.
Increasing cropping intensity by planting with less stored moisture, reduces the potential to recharge deep soils, which can limit the plants ability to access deep stored nutrients.
Crop choice can dictate the next planting opportunity through the different residual water levels at harvest and fallow efficiency of the stubble left behind. This opportunity could be quite different in the presence versus absence of soil constraints.
Acknowledgements
The research undertaken as part of this project (CSA00050, DAQ00192) is made possible by the significant contributions of growers through both trial cooperation and the support of the GRDC, the author would like to thank them for their continued support. We would also specifically like to thank all the farm and field staff contributing to the implementation and management of these experiments, the trial co-operators and host farmers.
Contact details
Andrew Erbacher
Department of Agriculture and Fisheries (DAF)
22-26 Lagoon St, Goondiwindi Qld 4390
Ph: 0475 814 432
Email: Andrew.erbacher@daf.qld.gov.au
Jayne Gentry
Department of Agriculture and Fisheries (DAF)
203 Tor St, Toowoomba Qld 4350
Ph: 0428 459 138
Email: Jayne.gentry@daf.qld.gov.au
Lindsay Bell
CSIRO
PO Box 102, Toowoomba Qld, 4350.
Ph: 0409 881 988
Email: Lindsay.Bell@csiro.au
GRDC Project Code: DAQ1406-003RTX, CSP1406-007RTX,
