Nitrogen in the farming system: drought implications on the availability of nitrogen. How much is there and where is it within the profile? Does cropping sequence influence fallow mineralisation activity?
Take home messages
- Test your soils! It is imperative that growers know the soil nutrient balance and beneficial fungi numbers before they enter back into a cropping system. Some interesting trends that we have found from our research include:
- Even during low and periodic rain periods, mineral nitrogen levels may have increased greatly during the drought - especially during the warmer summer months
- There was minimal to no mineralisation activity during the dry winter months (April-September at Narrabri 2018)
- When research sites did receive isolated rain during the winter months, mineralisation activity was still low but there was a movement of nitrate down the soil profile to where the next crop will use it
- This paper has focused on Nitrogen (N), but growers should also be aware of the dynamics of other key nutrient and beneficial fungi numbers. Data not included in this paper suggests that mycorrhizae fungi (AMF) decreased considerably during the drought, to where the next crop may be impacted if they are susceptible to the long fallow disorder
- Cropping sequence influenced mineralisation activity in the subsequent fallows. This research showed that growing legumes may not boost mineralisation activity, but crops with high dry matter production (such as canola) had greater mineralisation activity in the following fallow periods.
Introduction
The ongoing drought conditions in the northern grains region (NGR) has influenced the nitrogen dynamics of our cropping systems. The enforced long fallows and failed crops have reduced plant vegetative production, resulting in lower organic matter production and a significant reduction of residual stubble cover.
When a future planting opportunity presents itself, to ensure cropping systems continue to produce high grain yields, growers will need to be mindful of the fertility status of their cropping soils. This should be done on a paddock by paddock basis. The extended long fallow and lack of productivity may have nutritional implications for key plant nutrients (N & P) and beneficial fungi numbers within the soils of the NGR.
This paper will outline long-term soil nutrition results from the GRDC, NSW DPI, DAF and CSIRO funded Northern Farming Systems Initiative, and also data collected by the long-term nutrition trials managed by Incitec Pivot. Results have been extracted that specifically relate to the long fallow and current drought conditions experience throughout the NGR and how these differ across various farming systems.
Methodology
In 2014 the Northern Farming Systems Initiative implemented long-term farming systems research at seven sites throughout Queensland and northern New South Wales. A baseline cropping system, representing commercial best practice, was established at each site and tested against systems with higher and lower crop intensity, higher crop diversity, greater use of legumes and higher fertiliser inputs. Parameters including soil water, nitrogen and soil pathogens were regularly monitored along with crop biomass, grain yield and variable costs for each crop as measures of system performance.
This paper will interrogate data from the Narrabri research site (University of Sydney research farm “Llara” and the Pampas site (located 45 minutes south of Toowoomba).
Experimental procedures for the Northern Farming System project included measuring mineral nitrogen (nitrate and ammonium), both pre-sowing and post-harvest for each crop planted over the past four years. Grain content was also analysed for nitrogen (N), phosphorus (P) and potassium (K). Exported nutrients were calculated using grain nutrient content and dry weight grain yield.
The Incitec Pivot research was located at three Darling Downs sites, which were monitored for extensive time periods, measuring nitrogen (nitrate, ammonium and total N%), along with sulphur (MCP & KCl) and soil chloride (S & Cl not presented here). Whilst the initial intent was for samples to be taken monthly, in reality they have been taken irregularly in the months indicated in the figures and graphs below (i.e. not strictly 30 days apart) from pegged plots nominated by growers as representative of their paddock.
Segmented profile samples using the Fertcare soil sampling guidelines (Gourlay & Weaver, 2019) of 0-10 cm; 10-30 cm; 30-60 cm; 60-90 cm and 90-120 cm were collected.
Care is taken at each sampling date to ensure consistent soil core position (i.e. same tramline and wheel track), adjacent to previous core holes and in the same configuration amongst rows and other unique artefacts at each site.
Research site descriptions
Northern Farming Systems Initiative
- Narrabri - The soil at the site is a brown-grey Vertosol with medium-heavy clay throughout the soil profile. The plant available water holding capacity calculated at the site is 190 mm for wheat to a depth of 120 cm, it is likely additional water may be available at deeper depths in this soil, although the site contains high sodicity (ESP >10) at depths below 60 cm. The various research cropping systems are designed in a randomised layout with 4 replications
- Pampas - The soil at the site is a deep black Vertosol with medium-heavy clay throughout the soil profile. There is a graduation from black to brown clay at 1.2-1.7 m at the site, with this occurring at shallower depths at the lower elevation. The site has high background fertility levels and no subsoil constraints. The plant available water holding capacity calculated at the site is 240 mm for wheat to a depth of 150 cm, but it is likely additional water may be available at deeper depths in this soil.
Incitec Pivot Darling Downs sites (commercial paddocks)
Dalby, Qld - Light Brigalow clay soil, CEC 37 cmol(+)/kg, with moderate subsoil chloride (~1,000mg/kg) at >90cm depth. No nitrogen fertiliser was applied to this site since the 2015 wheat crop. A bare fallow plot (uncropped for the duration of sampling) has been compared to an adjacent recently cropped plot area.
- Dalby site A: Fallow: long bare fallow plot 12 m x 12 m ex chickpea 2016. Very low soil cover. Sampling commenced on 2/1/2018
- Dalby site B: Crop: plot 12 m x 12 m grain sorghum planted 1 Dec 2018 and harvested April 2019. Yield 3.4 t/ha, with approximately 60 kg N/ha exported within the grain.
Pampas, Qld - Heavy grey/black clay, CEC 55 cmol(+)/kg with no apparent subsoil constraints. Adjacent plots to monitor the fate of fertiliser N applied vs nil applied
- Pampas NW site: long fallow plot 12 m x 12 m ex grain sorghum 2016/17. Sampling commenced 16/4/2018
- Pampas SE site: long fallow plot 12m x 12m ex grain sorghum 2016/17. Sampling commenced 16/4/2018. 92kgN/ha (200kg urea/ha) (single disc machine) applied 20/6/18.
Mt Irving, Qld - Heavy grey clay, CEC 48 cmol(+)/kg with no apparent subsoil constraints. Sampling commenced on 12/2/2018. Single plot 12 m x 24 m. Ex wheat 2017; 107 kg N/ha as 130 kg/ha BIG N® applied in July 2018 using single disc machine, long fallowed into corn 2018/19 planted on 16/10/2018 and salvaged as silage yielding 11.6 t/ha (wet weight) green chop in January 2019. Following this harvest, 60 kg N as 73 kg/ha BIG N® was applied in April 2019 using a single disc machine.
Results
Drought impact on mineral N in northern cropping systems
The past 18 months in the northern grains region had received lower than average rainfall and above average temperatures. For growers who have been forced into long fallows scenarios due to these drought conditions, there has been a significant change to the mineral N dynamics within their cropping soils. The high temperatures during the summer months provided a basis for high rates of mineralisation activity especially within the vertosols soils that had adequate levels of organic matter. For regions that did not receive a significant storm event or isolated rain, the high mineralisation increased mineral N levels to extremely high amounts.
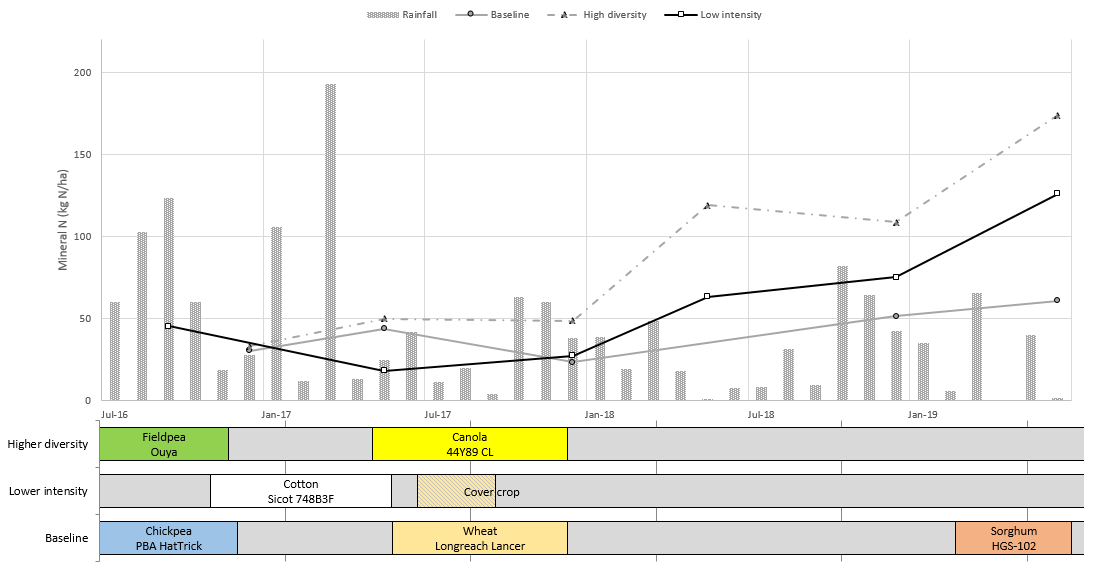
For example, at the Narrabri farming systems site, two cropping systems (Higher Diversity and Lower Intensity) were in fallow since December 2017. During the long fallow period, the cropping systems have increased nitrate N levels from 20 kg N/ha to over 90 kg N/ha (Figure 1). A closer look at the fallow period showed that the cooler 2018 winter months had little to no mineralisation activity at Narrabri, while the warmer summer fallow of 2018-19 provided the greatest increase in nitrate N levels during the 18 month drought period. Although the 2018/19 summer received below average rainfall and above average temperatures, the site did have high mineralisation activity. The lack of plant N uptake allowed for the mineralised N to accumulate during this period.
These results show that the process of mineralisation (where the organic or inorganic matter is converted by microorganisms into plant available N) can occur at low to moderate soil water content and low rainfall periods. Figure 1 shows the decline in monthly rainfall after the 2017 winter at Narrabri. As the systems entered the fallow (2017-18 summer), there was no significant rainfall event during the next two years. Soil moisture during this period remained approximately 40-50% of PAWC (60-80 mm).
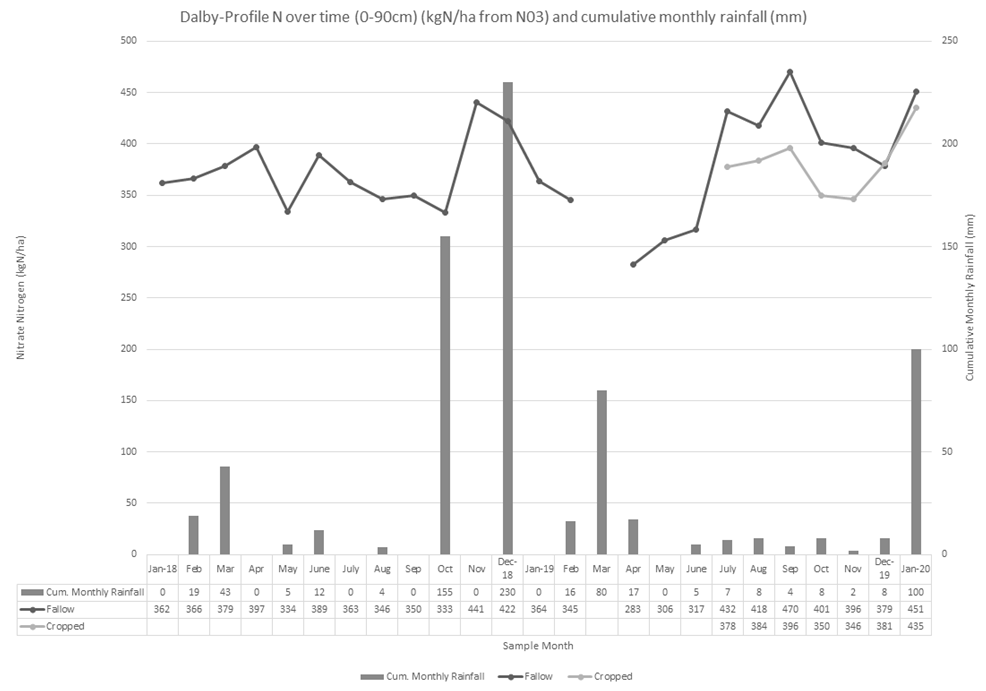
In contrast, if during the long fallow, cropping systems received an isolated rainfall event, the mineral N within the soils may decrease due to losses from denitrification. Denitrification – N losses due to the emissions of N2 – occurs when soils have high nitrate concentration and become saturated with moisture. When the soils’ dry down from peak saturation, nitrogen is lost in gaseous form. The Incitec Pivot site at Dalby received isolated storm events during the month of December 2018. During these months the Dalby site lost mineral nitrogen in the form of nitrate from the peak of 441 kg nitrate N/ha in November 2018 down to 283 kg nitrate N/ha in April 2019 (Figure 2).
Although soil nitrate N levels have increased during the dry drought conditions, one issue that could hamper growers leading back into a cropping sequence is that soil mycorrhizae (AMF) has decreased to alarmingly low levels (data not presented in this paper). Levels are now within the high risk range for susceptible crops for the long-fallow disorder, so growers need to be mindful of their mycorrhizae fungi levels when selecting their first crop after the long fallow period.
 Figure 1. Long term soil mineral N (kg N/ha) levels and monthly rainfall (mm) at the Narrabri farming systems research site (2016-2019).
 Figure 2. Measured nitrogen values in the 0-90cm profile taken from segmented profile samples and cumulative monthly rainfall (mm) from January 2018 until January 2020 at Dalby, Qld.
Where is my nitrogen after the drought?
When studying the available mineral N during the long fallow period, we found after the initial increase of mineralised N in the top soil, there was a definite movement of mineral N down through the soil profile especially for cropping systems dominated by winter crops (Narrabri and Pampas-winter). For instance, the summer season of 2017/18 saw significant levels of mineralisation within the 0-15cm depth at the two Northern Farming Systems sites (Figure 3). This corresponds with the location of microbes responsible for the breakdown of organic matter into the plant available form of nitrate and ammonium. Sampling after the winter of 2017 found that the mineral N that mineralised during the previous summer, had filtered down the profile into the lower depths (30-60 cm). This pattern continued during the last phase of the fallow as the accumulated mineral N increased in the 60-90 cm depth. These results show that in soils that have been accumulating mineral N during recent dry fallow periods, the mineral N continues to move through the soil profile during cooler months and periodic rainfall events. This is important for the next phase of the cropping sequence, as now it can be assumed that not only do we have ample mineral N available to produce grain yields, but the location of the N is within the soil layers where plants require peak N uptake during key growth stages.

What happened to my N fertiliser if I applied it a while ago (or earlier in the drought)?
N application decisions or practices are driven by a series of factors, including agronomic or practical farm calendar timing, N price, soil moisture, other farm enterprise or business demand such as labour availability. In preparation for cropping, growers may have applied nitrogen fertiliser to their fields quite some time ago before the drought forced them into a long fallow. This practice involves a level of risk (pre-plant N losses or recovery in future crops) and compromise (timing, soil conditions may not be ideal).
Is my N still there?
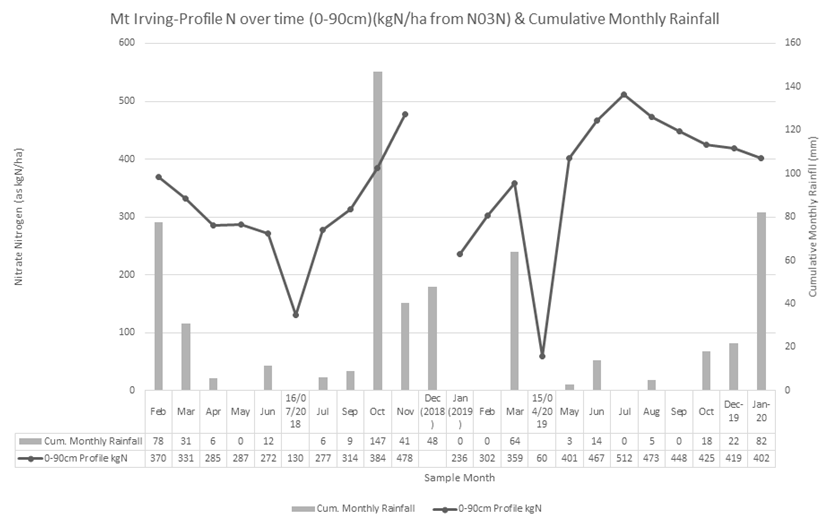
Studies at the Mt Irving Incitec Pivot paddock site show that with soil moisture approximated at 50% of PAWC, the applied nitrogen fertiliser (as Anhydrous ammonia – BIG N) in July 2018 took approximately four months to become converted into nitrate N (Figure 4). In addition to soil moisture, temperature influences the nitrification rate of fertiliser and soil N, and the apparent slow nitrification can be attributed to both soil moisture and soil temperature. Prior to N fertiliser application (April to July 2018), nitrate N equalled 384 kg N/ha (0-90 cm soil depth), however, after the fertiliser had fully nitrified into nitrate nitrogen, culminating in the 0-90cm profile N level of 478 kg N/ha being present in November 2018. It is assumed that whilst the soil moisture profile was stable from April to October 2018, it was the October rainfall (147mm) that likely completed the nitrification of the applied fertiliser and likely provided additional mineralised N to further bolster soil test N values.
The January 2019 soil sample timing coincides with the commencement of the fallow following the corn silage crop being removed. From nutrient samples collected at silage harvest, 105 kg N/ha (+9.5 kg P; 89 kg K; 5.8 kg S & 185 g Zn per hectare) was removed by this crop. It is assumed that the February and March 2019 soil N increases are from the Feb/Mar rainfalls when 56mm was received. With little effective rainfall (frequency or quantity) in events since, the latest soil sampling data (December 2019) provides logical extension that the April 2019-applied BIG N and subsequent mineralisation and nitrification has resulted in a plausible soil test N value being present.
 Figure 4. Incitec Pivot site ‘Mt Irving’ soil sampling profile N data (The 16/7/18 and 15/4/19 data callout boxes indicate the NH3 BIG N application rates by the grower) and cumulative monthly rainfall (mm).
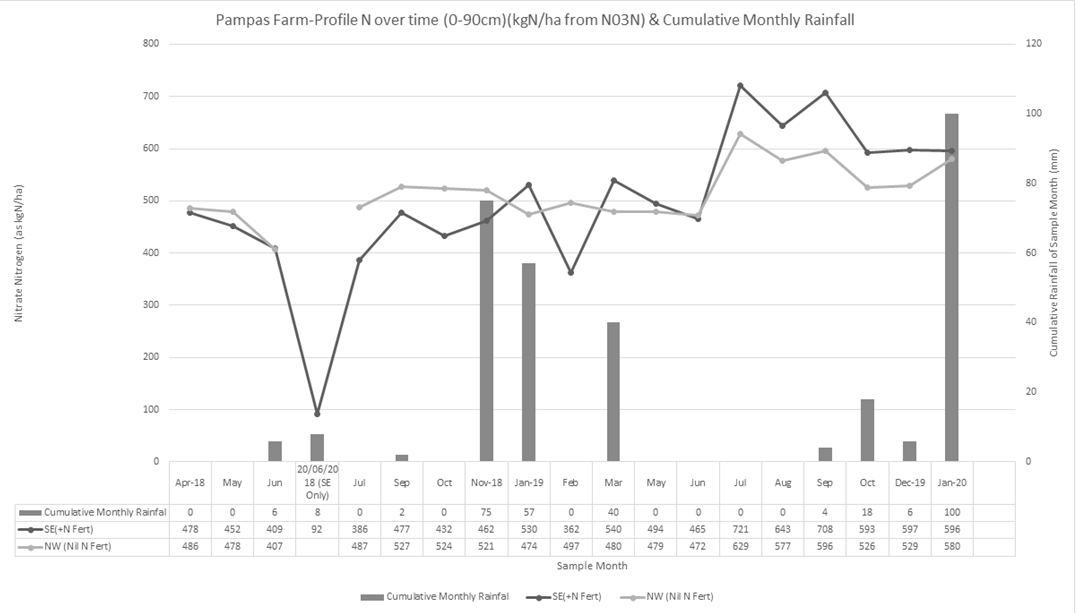
The Incitec Pivot Pampas Qld site had nitrogen applied in a long fallow back in June 2018, in readiness for a 2018-19 summer crop. The 92 kg N/ha application treatment (urea @ 200 kg/ha) had approximately 400 kg N/ha present in the 0-90 cm profile at that time. Due to very low rainfall and no crop removal event since, 74% of the applied N and N present prior to fertilising is accountable as the difference between the fertilised (597 kg N/ha) compared to 529 kg N/ha present in the unfertilised as at December 2019 (Figure 5).
 Figure 5. Pampas profile N over time, comparing N fertilised vs unfertilised, along with cumulative monthly rainfall (mm) (NOTE: The dip in the line graph represents 96 kg N applied as Urea on 20/6/18).
Where is my N in the profile (and the N fertiliser that I have previously applied)?
At the Incitec Pivot Darling Downs sites, the distribution of N in the profile has been expressed and examined as a percentage of the total of the kg N/ha in the measured profile (0-90cm).
At Dalby, Qld, the percentage of profile N in the depth segments remained largely stable except for the October 2018 sample date, following 155 mm of rainfall that month. Whilst a crop was present, the cropped plot showed an appreciable reduction in surface and subsurface nitrate N, presumably because these were the zones from which crop N uptake occurred. The difference in N distribution from July 2019 onwards in the surface 0-10 cm and sub-surface 10-30 cm layers between the area cropped to sorghum 2018-19) and the adjacent fallow area, was markedly different, until the two treatments start to align again in December 2019, some 8 months post-harvest.
At Mt Irving, the percentage of profile N at each profile depth varied. Given this site has had fertiliser N applied in July 2018; a silage corn crop grown that removed nitrogen; cultivation following the silage; and further N applied in April 2019: a natural assumption is that the distribution of N in the profile over that period would be sporadic. What is evident though is that the two N applications were not detectable as nitrate for 3-4 months from the July 2018 applied N; and 2 months after the April 2019 application. This is supported by ammonium N values being elevated following fertiliser applications prior to the product nitrifying into nitrate.
Flat N rates vs tactical ‘gut feel’ or soil test based N rates
Data (Walker & O’Mara, 2015) from the 35 year long term Incitec Pivot site at “Colonsay” on the Darling Downs indicates that growers could simplify their N approach by applying N rates that equal or exceed crop removal from their rotation preceding each and every crop. Whilst times of variance of ‘normal’ seasons may mean growers need to be more tactical, of course considering fallow length, mineralisation rates and rainfall, the measurement and management of N using soil tests to quantify the quantity and position of N in the soil profile is well warranted. Then an informed N rate can be determined to reset the system.
Conclusion
The drought conditions over the last 18 months has promoted mineralisation activity within the soils of the northern grain region. While the mineralisation process occurs in the topsoil (0-10 cm depth) and this is where the majority of nitrate N is located, there is still a natural progression of mineral N down the soil profile over the long fallow period. The periodic small rainfall events were adequate to promote some mineralisation and N movement throughout the profile and importantly into the soil depths where the highest N uptake by plant roots occurs during the key growth stages.
Of particular importance to growers in the northern grains region is that the mycorrhizae fungi (AMF) responsible for plant vigour during early seedling growth decreased to very low levels during the non-productive period (data not presented in this paper). Growers should become aware of the AMF levels and other key nutrients (P, K & Zn) within their soils before they head back into cropping and follow the best management guidelines when returning into a cropping sequence. While soils may have adequate plant available nitrogen due to mineralisation after a long fallow period, additional phosphorus, potassium and/or zinc may be required to aid potential AMF deficiency.
Quantification and measurement of yield grain nutrient content to calculate nutrient removal should be considered by growers and advisors to more closely to ascertain the magnitude of nutrient export in differing seasons, species and cropping systems. This is particularly evident where a higher frequency of legumes or higher yielding summer grain crops are grown in a crop rotation. Of heightened interest is the frequency and magnitude of removal of all nutrients, but especially the nitrogen and potassium export quantities from a rotation. The long term cropping system results show that crop type and the dry matter production play important roles in the amount of mineralisation that occurs in the subsequent fallows. As a result, mineral N could vary greatly spatially within your cropping soils.
When phasing back into a cropping rotation, it is paramount that growers test their soils, to understand the nutrient dynamics. Sampling adequately to account for the variability, position and magnitude of N (and P, K and Zn) present in profiles by segmenting their soil samples to better understand their starting point, especially for when they are re-commencing a cropping program post-drought.
Acknowledgements
The research undertaken as part of this project (DAQ00190 and CSA00050) is made possible by the significant contributions of growers through both trial cooperation and the support of the GRDC, the author would like to thank them for their continued support. We would also specifically like to thank all the farm and field staff contributing to the implementation and management of these experiments, the trial co-operators and host farmers.
Incitec Pivot Fertilisers thanks Andrew Johnston, DRS Farms, Dalby; Paul & Renee Elsden, Elsden Farms, Pampas/Brookstead; and the Kuhnemann and Orr families of Mt Irving Farming Co, for the provision of trial sites, hospitality, cooperation and crop data.
References
Baird, J, Gentry, J, Lawrence, D, Bell, L, Aisthorpe, D, Brooke, G, Erbacher, A, Verrell, A and Klepper K. (2019). The impact different farming systems have on soil nitrogen, phosphorus and potassium. GRDC Update, Goondiwindi
Gourley, CJP and Weaver, DM (2019). A guide for fit for purpose soil sampling, Fertilizer Australia, Canberra, Australia
Walker, C and O’Mara, B (2015). “Lessons learnt about nitrogen and phosphorus from a 30 year study in a sub-tropical continuous cropping system on a vertosol”. Proceedings of the 17th Australian Agronomy Conference, Hobart.
Contact details
Jon Baird
NSW Department of Primary Industries
ACRI, 21888 Kamilaroi HWY, Narrabri, NSW
Ph: 0429 136 581
Email: jon.baird@dpi.nsw.gov.au
Bede O'Mara
Incitec Pivot Fertilisers
PO Box 623, Toowoomba, Qld, 4350
Ph: 0417 896 377
Email: bede.omara@incitecpivot.com.au
BIG N® is a registered trademark of Incitec Pivot Limited.
GRDC Project Code: DAQ1406-003RTX, CSP1406-007RTX,
Was this page helpful?
YOUR FEEDBACK
