What are the optimal flowering periods for wheat across Western Australia and how will they change with potential climate change?
What are the optimal flowering periods for wheat across Western Australia and how will they change with potential climate change?
Author: Chao Chen, Andrew L Fletcher, Ota Noboru, Roger A Lawes | Date: 05 Mar 2020
Key Messages
- There were clear geographical patterns in the optimal flowering periods for wheat across the wheatbelt of Western Australia, with earlier opening and closing dates (23 Jul–30 Sep) in the northeast and later opening and closing dates (23 Aug–21 Oct) in the southwest.
- Optimal flowering periods for wheat in WA would be expected to occur earlier under future climate scenarios, especially under a drier climate.
- Provided flowering occurs within the optimal flowering period, long-duration cultivars sown early would achieve higher yield under both current and future climates, but early-sowing opportunities will be limited under dry scenarios.
Aims
The aims of this study were to:
- identify the spatial patterns of the optimal flowering periods of wheat across the wheatbelt of Western Australia for current climate;
- explore the potential changes in optimal flowering period for future climate; and
- explore the combination of cultivar choice and sowing date to achieve the optimal flowering period.
Introduction
Extreme weather events such as frost, heat and drought are a great challenge for Australian grain growers under both current and future climate scenarios (Zheng et al 2012; Barlow et al 2015). For wheat, Australia's most important grain crop, even short episodes of frost or heat stress around flowering can reduce grain yield considerably. Flowering date is critical for wheat yield, with flowering needing to occur within an optimal period to minimise the effects of frost, heat and drought on yield.
The optimal flowering period is influenced by the combined effects of temperature, precipitation, solar radiation and soil properties. As a result, the opening, closing and duration of the optimal flowering period vary from season-to-season and from location-to-location. For a given location, growers tend to seek a flowering period that allows wheat yield to be within 95% of the maximum yield across a range of seasons (Flohr et al 2017). Thus, it is important to identify the spatial pattern of the optimal flowering period over large crop-producing regions like the wheatbelt of WA, which has crops across about 8.5 million hectares of land each year. Global climate change is expected to bring warmer temperatures, changed rainfall patterns, exacerbate some types of extreme weather events and increase atmospheric carbon dioxide concentration in the wheatbelt of WA (Asseng et al 2019). Such changes to the mean and extremes of relevant climate variables could change the timing of the optimal flowering period of wheat in this region. To maintain and improve wheat production, it is important to determine how the optimal flowering period could change under future climate change. For both current and future climates, another important aspect is to understand how sowing date and cultivar can be combined to allow wheat to flower during its optimal flowering period. The findings will enable WA growers to determine the optimal flowering periods for their farms and to select a cultivar and sowing date combination to achieve the optimal flowering period for maximum yield.
Method
Identifying the spatial pattern of the optimal flowering periods for wheat across the wheatbelt of WA under the current climate
APSIM (Holzworth et al 2014) with scripts to quantify the impacts of frost and heat on wheat yield (Bell et al 2015) was used to the predict the optimal flowering periods that would minimise the effects of frost, heat and water stress on wheat yield. Daily meteorological data were obtained from the SILO data for the period of 1967–2017, with a spatial resolution of ~5km × ~5km. Soils were obtained from disaggregated soil polygon maps, with a spatial resolution of ~ 90m × ~ 90m. For each grid, a widely grown short-season wheat cultivar (Wyalkatchem) was sown at three-day intervals between 14 Mar and 15 Jul each year on a dominant soil (which covers the largest area). The soil’s initial condition and fertiliser management were set up using the approach of Flohr et al (2017). Over the simulations of 51 years (1967–2017) by 42 sowing dates, the smoothed frost- and heat-limited wheat yield was related to the flowering date to identify the optimal flowering period, i.e. flowering dates corresponding to ≥95% of the maximum mean yield limited by frost, heat and water stress.
Evaluating the possible change of the optimal flowering period under future climate
Two contrasting sites (Mullewa and Kojonup) were selected across the wheatbelt region of WA to investigate the effects of climate change on the optimal flowering periods of wheat. The observed daily climate data for the period of 1961–2000 were obtained from SILO for each location, which was used to represent current climate conditions. Statistically downscaled daily climate data for six selected general circulation models (Wang et al 2019): three predicted a ‘least-amount’ of rainfall decrease at all four locations and three predicted a largest rainfall decrease, referred to as ‘wet’ and ‘dry’ scenarios, respectively) for the period of 2061–2100 under a high greenhouse gas emission scenario were used as future climate scenarios. The optimal flowering periods for each climate scenario at each location were determined from the simulation setups using the same agronomic management practices detailed in the above section. The optimal flowering periods under future wet and dry scenarios were compared with those under the current climate to analyse the effect of climate change on the optimal flowering periods for wheat in WA.
Targeting the optimal flowering period for both current future climates
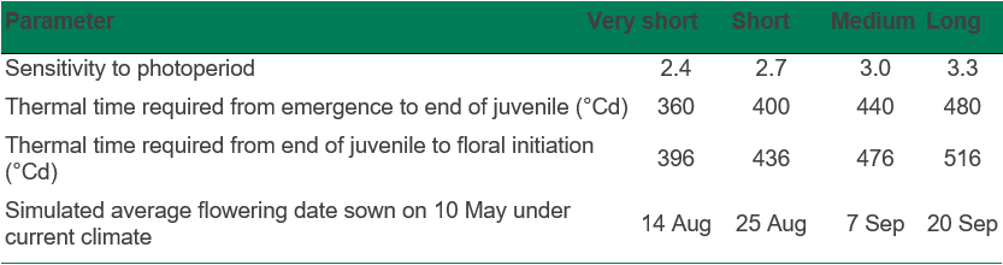
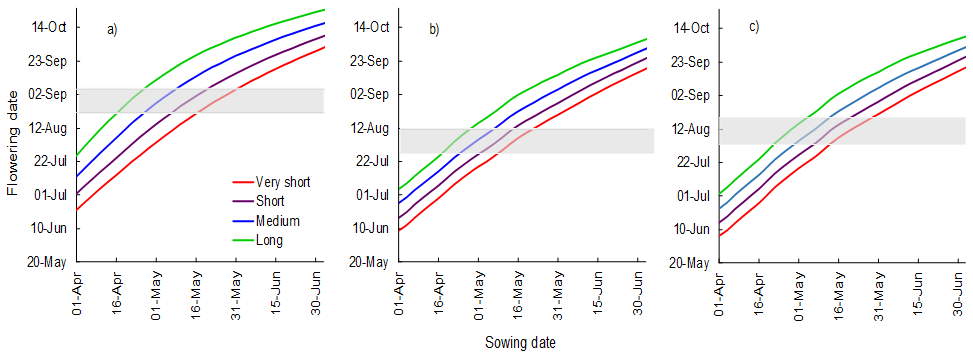
To identify optimal combinations of sowing date and variety to allow flowering to occur during the optimal flowering period, simulations were performed at the location of Merredin using the sowing and management practices detailed above, with one commonly sown fast-developing spring wheat cultivar (Wyalkatchem, referred to as short-season) and three virtual cultivars (referred to as very short-, medium- and long-season, respectively, Table 1). The virtual cultivars were created by changing the parameters of thermal time to flowering and photoperiod sensitivity, which resulted in the differences in flowering date. For example, for a mid-season sowing date (10 May), the average flowering date was 14 Aug, 25 Aug, 7 Sep and 20 Sep for the very short-, short-, medium- and long-season cultivars, respectively.
Table 1. Phenological parameters for an existing short-season variety parameterised in the APSIM and three APSIM-created spring wheat varieties with different maturity types (very short-, medium- and long-season).
Results
Spatial variation in optimal flowering periods under current climate
Due to the spatial variation in climate, the opening and closing dates of the optimal flowering periods showed large spatial variation across the wheatbelt (Figure 1). The opening dates of the optimal flowering periods ranged from 23 Jul to 30 Sept from the northeast towards the southwest (Figure 1a). Generally, the early opening dates corresponded to the early closing dates, the latter of which ranged from 23 Aug to 21 Oct from the northeast to the southwest (Figure 1b). The duration (the difference between closing and opening dates) of the optimal flowering periods varied from 11 to 32 days with the range between 11 and 25 days in most of the wheatbelt (Figure 1c).
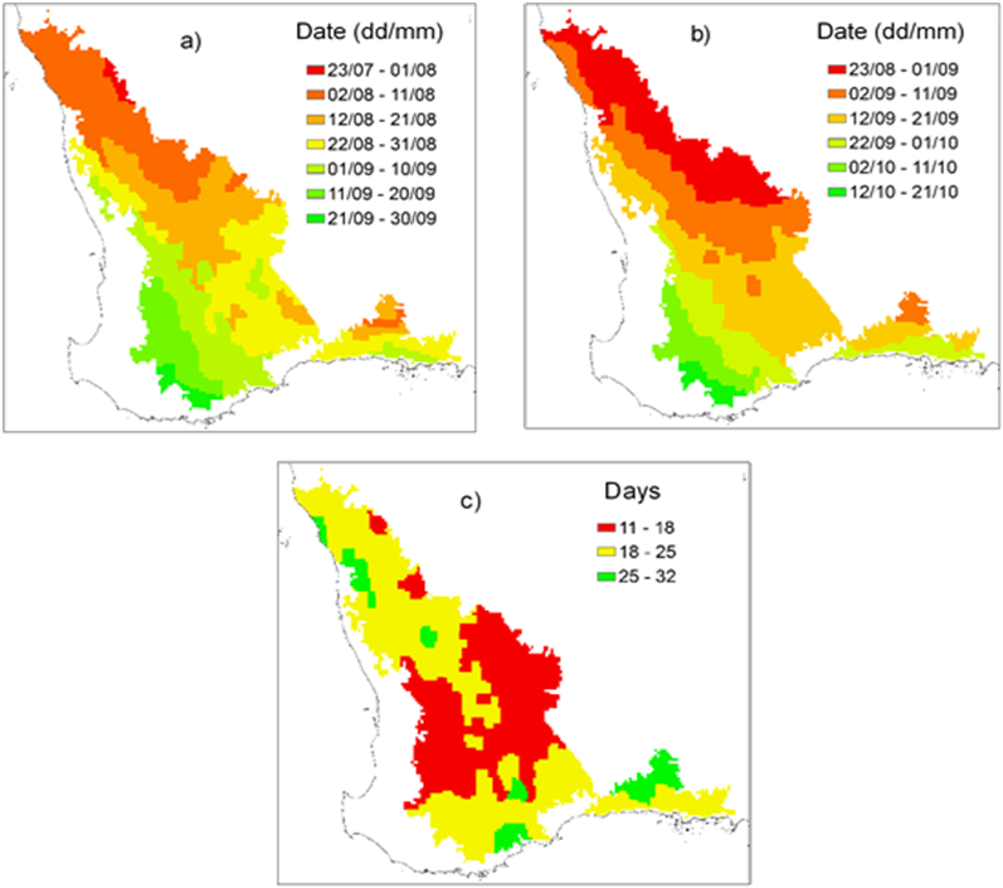
Figure 1. Simulated long-term (1967–2017) mean opening dates (a), closing dates (b) and durations (c) of the optimal flowering periods for wheat in the wheatbelt of WA.
Shifts in optimal flowering periods in response to climate change
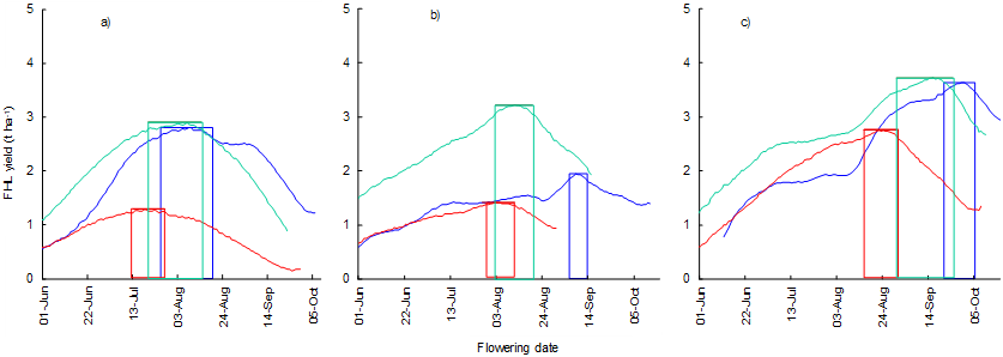
The potential changes in future climate were predicted to affect the optimal flowering period of wheat (Figure 2). Optimal flowering periods occured earlier under future climate scenarios. Under the wet scenario, the opening dates of the optimal flowering periods were advanced by six days at the drier and warmer location (Mullewa, Figure 2a) and 23 days at the colder and wetter location (Kojonup, Figure 2c). The shift in the timing of the optimal flowering periods was larger under the dry scenario, with opening dates advanced from 13 to 37 days and closing dates occurring 21 to 36 days earlier across the three locations. The shift of the optimal flowering period was smaller at Mullewa than Kojonup, due to the reduction in the future frost risk (data not shown).
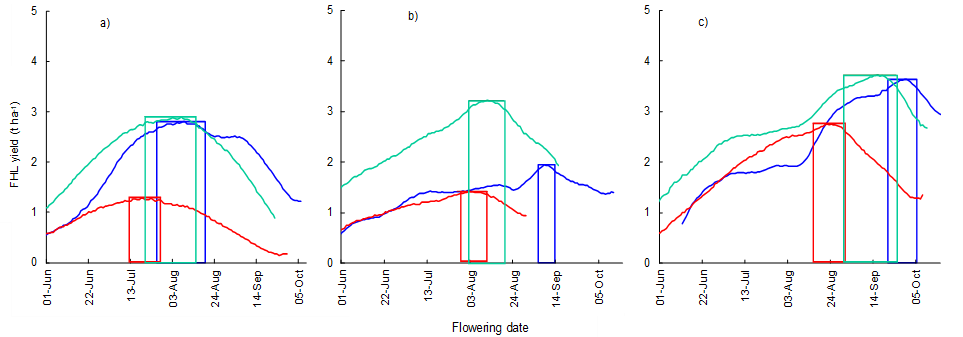
Figure 2. Simulated optimal flowering periods of wheat calculated at three study locations across the wheatbelt of Western Australia: a) Mullewa, b) Merredin, c) Kojonup. The lines represent the mean yield response to frost, heat and water stress across a range of flowering dates for current climate (blue), future dry climate scenario (red) and future wet climate scenario (green). Columns are the estimated optimal flowering period for the scenarios of the current climate (blue), future dry climate (red) and future wet (green) climate.
Combining sowing date and cultivar to achieve the optimal flowering period
The interactive effect of sowing date and cultivar on wheat phenological development means that to achieve the optimal flowering period, a short-season cultivar should be sown later than a long-season cultivar for both current and future climates (Figure 3). For example, at Merredin under the current climate, the optimal sowing periods were 5 May–20 May for the short-season cultivar and 16 Apr–17 Apr for the long-season cultivar. The simulated future climate change shortened crop growth duration (Zheng et al 2012) and the optimal flowering period occurred earlier. As a result, in future climates, the same cultivar of wheat would need to be sown at similar dates to those for the current climate to achieve the optimal flowering period (Figures 3 b, c). In terms of yield, early sowing of long-season varieties is preferable to achieve the optimal flowering period in both current and future climate scenarios because it would result in higher yield potential (data not shown).
References
Asseng, S., Martre, P., Maiorano, A., Rötter, R.P., O’leary, G.J., Fitzgerald, G.J., Girousse, C., Motzo, R., Giunta, F., Babar, M.A., 2019. Climate change impact and adaptation for wheat protein. Global change biology 25, 155-173.
Barlow, K., Christy, B., O’leary, G., Riffkin, P., Nuttall, J., 2015. Simulating the impact of extreme heat and frost events on wheat crop production: a review. Field Crops Research 171, 109-119.
Bell, L.W., Lilley, J.M., Hunt, J.R., Kirkegaard, J.A., 2015. Optimising grain yield and grazing potential of crops across Australia’s high-rainfall zone: a simulation analysis. 1. Wheat. Crop and Pasture Science 66, 332-348.
Flohr, B.M., Hunt, J.R., Kirkegaard, J.A., Evans, J.R., 2017. Water and temperature stress define the optimal flowering period for wheat in south-eastern Australia. Field Crops Research 209, 108-119.
Holzworth, D., et al., 2014. APSIM - Evolution towards a new generation of agricultural systems simulation. Environmental Modelling & Software 62, 327-350.
Wang, B., Feng, P., Chen, C., Li Liu, D., Waters, C., Yu, Q., 2019. Designing wheat ideotypes to cope with future changing climate in South-Eastern Australia. Agric. Syst. 170, 9-18.
Zheng, B., Chenu, K., Fernanda Dreccer, M., Chapman, S.C., 2012. Breeding for the future: what are the potential impacts of future frost and heat events on sowing and flowering time requirements for A ustralian bread wheat (T riticum aestivium) varieties? Global Change Biology 18, 2899-2914.
Acknowledgments
This research was funded by the Grains Research and Development Corporation through the project CSA00056.
GRDC Project Code: CSP1606-007RTX,