Growing competitive sorghum and mungbean crops to suppress summer weeds
Take home message
- Feathertop Rhodes grass (FTR) and awnless barnyard grass (ABG) are both difficult to control summer grass weeds with both species prone to herbicide resistance evolution
- Growing a competitive sorghum or mungbean crop can reduce growth and seed production of FTR and ABG
- ABG is more susceptible to the impacts of crop competition than FTR
- Sorghum competitiveness can be increased by growing the crop at a narrow row spacing (50 cm) and increased density (10 to 15 plants/m2)
- Mungbean competitiveness is most effectively increased through the use of narrow row spacing (25 and 50 cm)
- Consider growing a competitive summer crop to take pressure off relying solely on in-crop herbicides for summer grass control.
Introduction
Herbicides are a main stay of weed control in conservation cropping systems. However, reliance on herbicides for weed control has caused widespread herbicide resistance.
Key summer weeds in the northern region are feathertop Rhodes grass (Chloris virgata) (FTR) and awnless barnyard grass (Echinochloa colona) (ABG). Both weeds have populations confirmed as resistant to glyphosate and there has recently been confirmed cases of group A (haloxyfop) resistance in FTR.
To minimise further resistance and to retain herbicide efficacy, non-chemical weed control tactics, such as growing a competitive crop, are needed. A competitive crop can suppress in-crop weeds and reduce total reliance on herbicides for weed control. There are a number of agronomic approaches that lead to increased crop competition including, narrow row spacing, increased plant density, as well as species and cultivar choice. Each of these approaches can provide an advantage to the crop over weeds in competition for water, nutrients, light and space.
In the northern cropping region, sorghum is a key summer crop. However, there are challenges in controlling summer grass weeds in this crop due to the lack of herbicide options and the wide row spacing commonly used.
Mungbean is another commonly grown summer crop, which as a broad leaf crop, provides an opportunity to apply grass selective herbicides pre- or post-plant or post-emergence for summer grass weed control. However, mungbeans are poorly competitive and like sorghum, are commonly grown in wide rows, greatly reducing competition against in-crop weeds when compared to narrower row spacings.
This paper highlights key findings from four years of research on the impact of competitive sorghum and mungbean crops on the growth and reproductive development of FTR and ABG.
Materials and methods
Field experiments, duplicated in SE Qld (Hermitage) and NW NSW (Narrabri), investigated the effects of narrow row spacing, increasing crop plant density and cultivar choice of sorghum and mungbean on competition with weeds. In each experiment, herbicides were not applied, and artificial weed populations were established either through sowing weed seeds and thinning to target population (Hermitage), or by transplanting weeds into the crop (Narrabri). Target crop and weed populations were established in fixed quadrats where crop and weed growth were measured. Three mungbean varieties Crystal, Jade-AU and Satin II, selected for cultivars comparison, are protected under the Plant Breeders Rights Act 1994.
Results
Sorghum
Row spacing
Over the 2018/19 summer growing season, at both Hermitage and Narrabri, sorghum cultivars Taurus, 85G33 and Rippa were grown at row spacings of 50 and 100 cm and a crop density of 10 plants/m2. At both sites, there was a competitive advantage for sorghum grown at 50 cm row spacing. Only data from the Hermitage site are shown here, but the effect was mirrored at the Narrabri site.
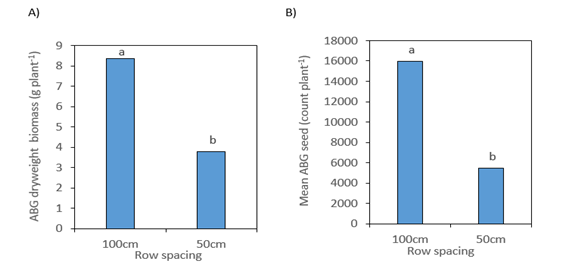
Reducing row spacing from 100 to 50 cm reduced (P=0.002) the biomass of ABG plants by 55% (Figure 1A). Similarly, ABG seed production was reduced (P<0.001) at the 50 cm row spacing (Figure 1B).
Figure 1. Awnless barnyard grass (ABG) A) biomass and B) seed production as affected by sorghum row spacing at Hermitage, Qld 2018/19. Within each graph, different letters indicate significant (P<0.05) difference after pairwise comparison.
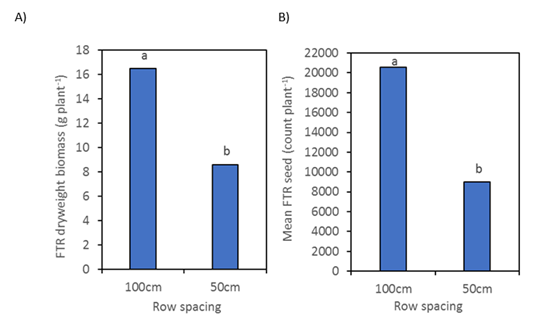
Narrow row spacing in sorghum reduced FTR biomass (P<0.001) and seed production (P<0.001) (Figure 2). At the 50 cm row spacing, biomass and seed production were 48 and 56% lower, respectively.
Figure 2. Feathertop Rhodes grass (FTR) A) biomass and B) seed production as affected by sorghum row spacing at Hermitage, Qld 2018/19. Within each graph, different letters indicate significant (P<0.05) difference.
Crop density
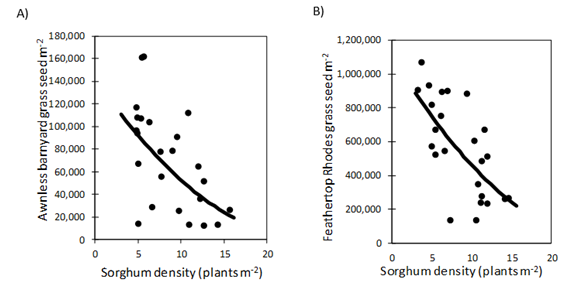
Increased sorghum plant density reduced the growth and seed production of both FTR and ABG. In a 2017/18 field trial at Hermitage, an increasing sorghum density significantly reduced both ABG (P=0.001) and FTR (P=0.004) seed production (Figure 3).
Figure 3. Relationship between sorghum plant density and seed production of A) awnless barnyard grass and B) feathertop Rhodes grass, Hermitage, Qld 2017/18.
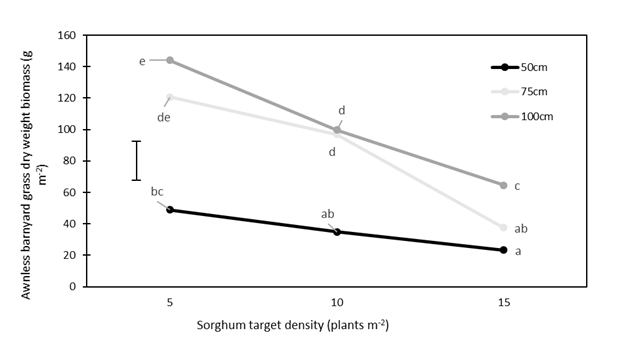
Increasing sorghum plant density and narrower row spacing similarly reduced growth of ABG in the Narrabri trial (Figure 4). Weed biomass at a narrow row spacing of 50 cm was lower at each corresponding crop density than at a wide row spacing of 100 cm. Within each row spacing, the ABG biomass was lower at a high sorghum density (15 plants m-2) compared with a low sorghum density (5 plants m-2).
Figure 4. Effect of sorghum row spacing and crop density on awnless barnyard grass biomass. Narrabri, NSW 2017/18. Data points with a different letter are significantly different (P=0.05). LSD = 24.7.
Cultivar
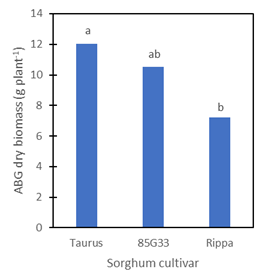
At the Hermitage site, sorghum cultivar had no impact on the suppression of either FTR or ABG. In contrast, at the Narrabri site, the biomass production of ABG was significantly reduced by the Rippa cultivar (P=0.04) compared to Taurus (Figure 5). However, in this same trial, the seed production of ABG was not affected by sorghum cultivar (P=0.599).
Figure 5. Awnless barnyard grass (ABG) biomass as affected by sorghum cultivar at Narrabri, NSW 2018/19. Different letters indicate significant (P<0.05) difference after pairwise comparison.
Crop yield
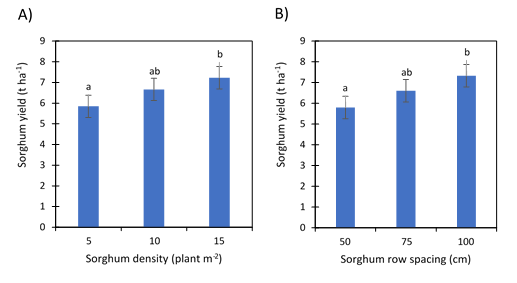
In most of the field trials, sorghum grown at narrower row spacing or higher crop density had no impact on crop yield. This demonstrates that, the use of agronomic practices of narrower row spacings and increased crop plant densities that increased sorghum competition effects on weeds, did not reduce yields. In fact, in one of the Narrabri field trials, increased sorghum density and narrow row spacing resulted in yield increases (Figure 6). At both sites, there were no differences in yield between cultivars.
Figure 6. Effect of A) sorghum density and B) sorghum row spacing on sorghum grain yield, Narrabri, NSW 2017/18. Data points on each graph with a different letter are significantly different at P=0.05. LSD bar is shown on both graphs = 54.
Mungbean
Row spacing
Establishing mungbean crops in narrower row spacings consistently reduced the seed production and growth of both ABG and FTR in multiple field trials over four summer seasons. Hermitage site results are presented to indicate these consistent trends.
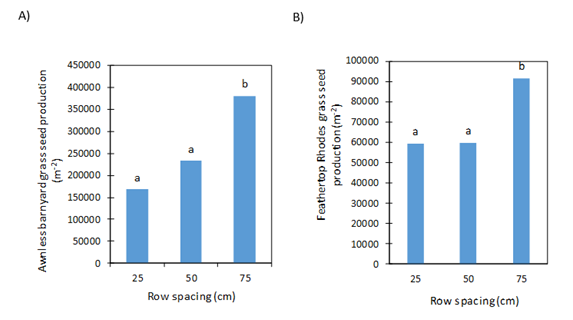
Mungbean grown at a narrower row spacing of 25 and 50 cm reduced the number of ABG seed produced compared to a wider row spacing of 75 cm (Figure 7A). Similarly, narrow row spacing reduced FTR seed production (Figure 7B).
Figure 7. Effect of mungbean row spacing on A) feathertop Rhodes grass and B) awnless barnyard grass seed production, Hermitage, Qld 2016/17. Data with a different letter are significantly different (P=0.05). LSD=28,260 (A) and 125,934 (B).
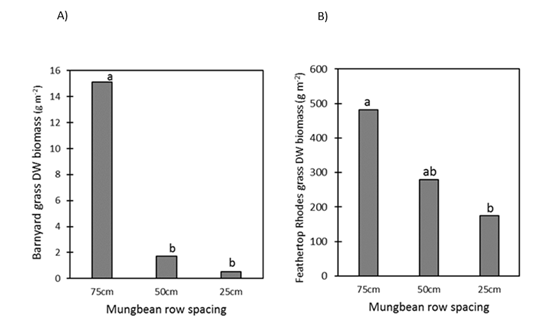
Reducing row spacing from 75 to 50 and 25 cm decreased ABG biomass by 89% and 96%, respectively (Figure 8A). FTR biomass was also reduced (P=0.02) when row spacing was reduced from 75 to 25 cm (Figure 8B). There was no difference (P>0.05) in FTR biomass between 25 and 50 cm row spacing.
Figure 8. Effect of mungbean row spacing on the dry weight (DW) biomass of A) awnless barnyard grass and B) feathertop Rhodes grass at Hermitage, Qld 2017/18. Different letters indicate significant (P<0.05) difference after pairwise comparison.
Crop density
Across field sites, crop density consistently had no or little impact on the competitiveness of mungbean. Only at one Narrabri field trial was there an interaction (P=0.013) between row spacing and crop density for ABG biomass (Table 1). As row spacing widened, there was a general increase in ABG biomass at each mungbean plant density. Within each row spacing, crop density had no effect on ABG biomass, except for at 25 cm where a lower crop density of 20 plants m-2 had significantly greater biomass.
Table 1. Effect of mungbean row spacing and density on awnless barnyard grass dry weight biomass, Narrabri, NSW 2017/18. Back-transformed data presented with log-transformed numbers in parentheses. Numbers followed by a different letter are significantly different (P=0.05). LSD on transformed data = 0.4026.
Mungbean density (plants m-2) | Weed biomass (g m-2) at each row spacing | ||
|---|---|---|---|
25 cm | 50 cm | 75 cm | |
20 | 37.9 (3.7) b | 47.8 (3.9) bc | 62.4 (4.1) c |
25 | 19.0 (3.0) a | 46 (3.8) bc | 64.2 (4.2) c |
30 | 13.9 (2.7) a | 33.7 (3.5) b | 67.4 (4.3) c |
Cultivar
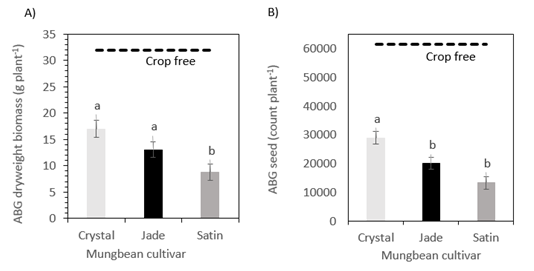
The comparison of mungbean cultivars Crystal, Jade-AU and Satin II across a range of row spacings identified a cultivar effect at Hermitage but not at Narrabri. Unfortunately, there was poor establishment of FTR, so only results for ABG are presented here. ABG biomass was the least when grown under the cultivar Satin II (Figure 9). While there was no difference between Crystal and Jade-AU, the trend was for a lower ABG biomass in Jade-AU. A similar effect was shown for ABG seed production with a significantly (P<0.001) lower number of seeds plant-1 in Satin II and Jade-AU, but with the least seed being produced in Satin II(Figure 9).
Figure 9. Awnless barnyard grass (ABG) A) biomass and B) seed count as affected by different mungbean cultivars at Hermitage, Qld 2018/19. Standard error bars are shown. Different letters indicate significant (P<0.05) difference after pairwise comparison. LSD = 4.1 (A) and 6934 (B). Crop free indicates mean ABG biomass and seed production in fallow plots.
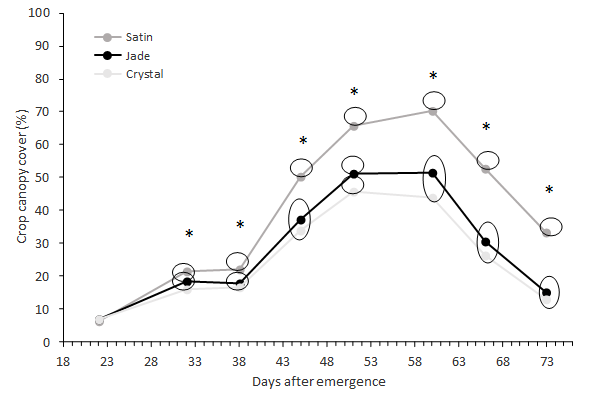
Throughout the field trial, crop canopy cover (%) was assessed by analysing overhead crop photos. This enabled a comparison of potential shading effects of the mungbean cultivars (Figure 10). From 38 days after emergence (DAE) and until the final assessment at 72 DAE, Satin II had the greatest canopy cover (P<0.001). While the canopy cover of Crystal and Jade-AU was not different at most sampling times, except for 51 DAE, where the canopy cover provided by Jade-AU was greater. These results help to explain why under Satin II there was less ABG biomass and seed production.
Figure 10. Canopy cover (%) over time of mungbean cultivars at Hermitage, Qld 2018/19. At each time of assessment, * denotes a significant difference. Points within an assessment time that are circled together are not significantly different. Overall LSD = 6.008.
Crop yield
There was not a consistent trend for mungbean yield in response to either row spacing or cultivar. However, across trials, mungbean yield was not affected by crop density. Differences in crop yield results are likely to be a seasonal response.
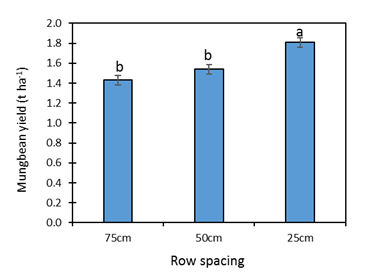
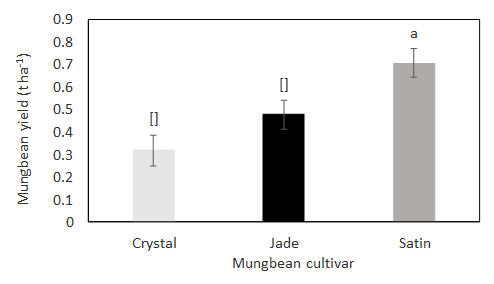
At one Hermitage trial, a higher yield was measured in plots of 25 cm rows (1.8 t ha-1) compared to 50 cm rows (1.5 t ha-1) or 75 cm rows (1.4 t ha-1) (Figure 11). At the same Hermitage site, Satin II, which was the most competitive cultivar, was also the highest (P<0.001) yielding cultivar (Figure 12). Crystal, which was the least competitive, also had the lowest yield.
Figure 11. Effect of mungbean row spacing on crop yield at Hermitage, Qld 2017/18. Different letters indicate significant (P<0.05) difference after pairwise comparison for that graph. LSD = 0.1492. Standard error bars are shown.
Figure 12. Yield of different mungbean cultivars at Hermitage, Qld 2018/19. Standard error bars are shown. Different letters indicate significant (P<0.05) difference after pairwise comparison. LSD = 0.124.
Conclusion
Our research shows there are weed control benefits in growing competitive sorghum and mungbean crops. Although some of the findings have differed between trials and seasons, results show narrow row spacing can improve competitiveness for both crops and is the approach that will likely have the largest and most consistent impact on weed growth and seed production. Increasing sorghum plant density also consistently increased the competitive effects of this crop against these weeds, whereas mungbean density had less impact. Cultivar choice may have an impact in both crops but is likely to be dependent upon seasonal conditions. Favourably, our results show that growing a competitive crop not only reduces weed competition and seed set but can improve or maintain crop yield.
Acknowledgements
The research undertaken as part of this project is made possible by the significant contributions of growers through both trial cooperation and the support of the GRDC, DAF and University of Sydney. The authors would like to thank these contributors for their continued support.
Contact details
Michael Widderick (Principal Research Scientist)
Queensland Department of Agriculture and Fisheries
Ph: 07 4529 1325
Email: Michael.widderick@daf.qld.gov.au
Asad Shabbir (Postdoctoral Research Associate – Weed Ecology)
University of Sydney
Ph: 02 4651 9884
Email: asad.shabbir@sydney.edu.au
Varieties displaying this symbol beside them are protected under the Plant Breeders Rights Act 1994.
GRDC Project Code: UOS1703-002RTX,
Was this page helpful?
YOUR FEEDBACK

