Managing nitrogen for high crop yields and sustainable farming systems
Managing nitrogen for high crop yields and sustainable farming systems
Author: James Hunt (La Trobe University) | Date: 22 Jul 2020
Take home messages
- Nitrogen (N) deficiency is the single biggest factor contributing to the Australian wheat yield gap.
- You need to soil test in order to make any sort of rational decision about N fertiliser.
- Yield Prophet®, back of the envelope calculations and ‘N bank’ targets are all valid ways of managing N fertiliser to achieve potential yields and avoid running down total N.
- Don’t fear overapplication of N - on most soils in the Wimmera-Mallee unused N carries over and is available for use by subsequent crops and helps maintain soil organic matter.
Background
Australian wheat yields are only half what they could be for the rainfall received (Hochman et al. 2017). Nitrogen (N) deficiency is the single biggest factor contributing to this yield gap. This is also likely to be true for other non-legume crops (barley, canola and oats) which reduces farm profitability and global food security. Alleviating N deficiency would increase national wheat yields by 40 per cent (Hochman and Horan 2018), and substantially improve farm profit.
On farms with no legume pastures, most of the crop N supply must come from fertiliser. Grain legumes do not provide enough N to support yield of subsequent crops at the intensity at which they are currently grown. N fertiliser is a costly input and use of it increases cost of production and value-at-risk for growers. Growers fear that over-fertilisation will result in ‘haying off’, which reduces both yield and quality. There is also the concern that overapplied fertiliser that is not used by crops is lost to the environment by leaching, volatilisation and denitrification. Consequently, efforts continue to be made to match N fertiliser inputs to seasonal yield potential. This is difficult in southern Australia due to the lack of accurate seasonal forecasts for rainfall.
The difficulty in matching N supply to crop demand and a tendency for growers to be conservative in their N inputs is responsible for a large proportion of the yield gap that can be explained by N deficiency. Chronic N deficiency has also caused soil organic matter to decline (Angus and Grace 2017) and has driven a rise in the proportion of low protein grain produced in Australia, which has eroded our standing as a producer of quality wheat in export markets.
‘N banks’ are a strategy for managing N in crop production areas with low environmental losses (leaching, denitrification). Most of the Wimmera-Mallee has soils which are free-draining and hold a reasonable amount of water, and therefore, environmental losses of N are low. N banks are therefore an effective strategy for managing N in most of the region. Exceptions are areas prone to waterlogging or have very sandy soils. The advantages of N banks are that they are simple to calculate, crops are rarely N deficient, and if set at an appropriate level for the environment, soil organic N is not mined. They also shift the cost of N fertiliser into years following a year of high production, rather than in the year of possible high production.
N banks require growers to set a locally relevant target for crop N supply (soil mineral N plus fertiliser N) that is enough to maximise yield in the majority of seasons. Soil mineral N is then measured early in the growing season, and if less than the target N bank, is topped up to the target value with fertiliser N. A more detailed description of N banks and a long term experiment investigating their effectiveness can be found here
Key Question 1: How do we assess the N bank after a big season last year?
Assessment of the N bank is achieved by soil testing for nitrate and ammonium. The ‘N bank’ management system relies on growers knowing how much mineral N (nitrate and ammonium) they have available to a crop early in the growing season. Consequently, for any rational decision to be made on N management, it is critical that paddocks are soil tested to measure mineral N. This can be done any time from March through to June, but if done following sowing it is essential that samples are taken from the inter-row to avoid sampling any fertiliser N applied at sowing. Soil cores should be taken to at least 0.6m (ideally >1.0m) and segmented into different depths (e.g. 0-0.1 m, 0.1-0.3 m, 0.3-0.6 m). At least six cores need to be taken per paddock or production zone within a paddock, and bulked samples carefully mixed. Samples should be kept cool and ideally air dried before being sent to an accredited laboratory for analysis. A good soil sampling contractor will do all of these things for you!
Key Question 2: With a big production year in mind, what are the key messages for growers to consider when developing a nitrogen strategy?
The yield gap due to N deficiency is always bigger in high production years. Growers either need to make a realistic assessment of current economic yield and associated crop nitrogen demand or choose an N bank target (see calculations in following section). They then need to calculate how much mineral N was available to crops early in the season from soil samples (refer preceding section), and therefore how much fertiliser N needs to be applied to achieve economic yield or the N bank target.
The bulk of this fertiliser should be applied in July-early August when cereal crops are at Z30-31 and canola hasn’t started elongating. Applying at this time minimises volatilisation losses (cold often wet soil with rain fronts coming through) and maximises chances of crop uptake. If you are applying N during July you do not need to do it right in front of a substantial rain, just do it by the calendar. Crops can be topped up later in the season (e.g. Z37), but risk of volatilisation losses are higher and substantial rain is needed to make sure the N becomes available to crops. If top-dressing later than mid-August you should do it in front of a substantial (>15 mm) forecast rain.
Growers in the Wimmera and Mallee shouldn’t fear over-application (supplying more N than the crop needs this year) on paddocks that aren’t sandy or don’t reliably get waterlogged. Leaching and denitrification losses are very low and N that is not used by the crop this year will be available for next year’s crop. Crop simulations and the BCG-La Trobe long-term N field experiment at Curyo is showing that occasional over-application is more profitable in the long-term than under-application (Figure 1). This agrees with findings from a similar long term experiment in semi-arid China (Guo et al. 2012). The only other reason not to overapply is if your cash flow is tight and you can’t afford not to get a return on investment in fertiliser N this year.
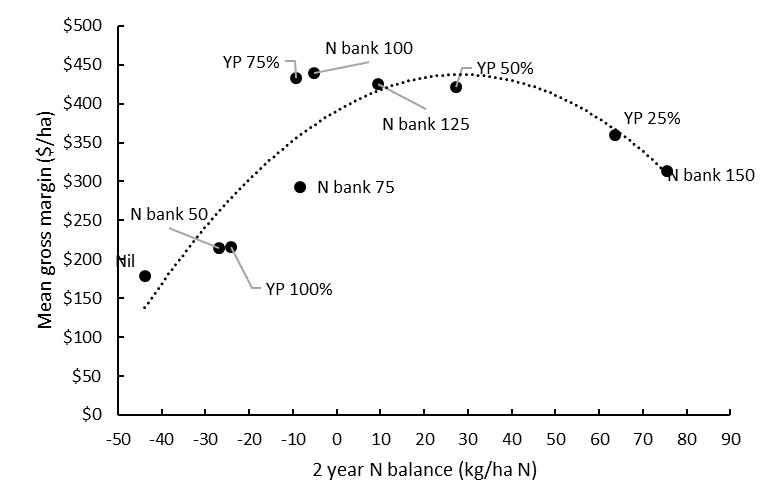
Figure 1. The BCG-La Trobe University long-term N management experiment at Curyo is showing that N management strategies that over-apply (i.e. have a neutral to positive N balance) are more profitable. These strategies will also avoid mining soil mineral N and thus running down soil organic matter. Visit here for details of the experiment. Note, the number following ‘N bank’ treatments is the N bank target in kg/ha. YP=Yield Prophet treatments at different levels of probability (YP100% targets yield assuming the worst season finish on record, YP50% targets yield assuming a median finish etc.).
Many growers continue to be concerned about ‘haying off’ (negative yield and quality response to applied fertiliser N), but chances of this happening are low in modern farming systems. This is due to;
- The shift to continuous cropping and decline in pasture area has reduced both soil mineral N prior to sowing, and the amount that mineralises in-season.
- Stubble retention further reduces in-crop mineralisation by increasing immobilisation.
- Soil testing prevents N from being applied to paddocks with very high levels of soil mineral N.
- Modern crops are less susceptible to haying off. Canola and high harvest index cultivars of barley, such as Spartacus are virtually immune. Modern wheat cultivars that have been heavily selected for grain size (e.g. Scepter) carry a very low risk.
Key question 3: What tools are available for growers and consultants to help with decision making?
Yield Prophet® is still an effective tool for attempting to match N supply to seasonal demand. The downside of Yield Prophet® is that it is data-hungry and requires experience to get it right. This simple spreadsheet tool available here requires less data but doesn’t give probabilistic output or include seasonal forecasts. It uses the old ‘back of the envelope’ calculation as follows;
Crop water supply (mm) = 0.25*(Nov-Mar rain) + growing season rain to-date + your guess at rain for the rest of the season
Water limited potential yield (t/ha) = 0.022*(crop water supply – 60)
Economic yield = 0.8*(water limited potential yield)
Crop N demand (kg/ha N) = 40*(economic yield)
Fertiliser N requirement (kg/ha N) = crop N demand – (soil mineral N + previous fertiliser application)
If you allow for in-crop mineralisation when calculating fertiliser requirement, you will run down soil organic N and thus soil organic matter. We can work this through with an example for a wheat crop in the Wimmera using rainfall from Rupanyup Post Office with a conservative estimate of how much rain we might get for the remainder of the season (120 mm). We’ll also assume there was 75kg/ha mineral N measured in soil cores prior to sowing.
Crop water supply (mm) = 0.25*(157mm) + 125mm + 120mm = 284mm
Water limited potential yield (t/ha) = 0.022*(284 – 60) = 4.9t/ha
Economic yield = 0.8*(4.9) = 3.9t/ha
Crop N demand (kg/ha N) = 40*(3.9) = 156kg/ha N
Fertiliser N requirement (kg/ha N) = 156kg/ha N – (75kg/ha N + 7kg/ha N) = 74kg/ha N
This crop needs 74kg/ha N applied as fertiliser (160kg/ha urea) to achieve economic yield assuming there is 120mm of rain between now and the end of October.
The problem with Yield Prophet® and the ‘back of the envelope’ strategy is they require a forecast of the future (i.e. how much rain is going to fall between now and the end of the season). With the N management strategy that is currently being developed, we don’t even attempt to match crop N supply to seasonal demand, we just make sure that the crop has enough N supply (soil mineral N measured early in the season + fertiliser) to achieve water limited potential yield in the majority of seasons. We do this by selecting an N bank target appropriate for the environment. A target of 125kg/ha N is proving most profitable in the southern Mallee, but it is likely to be more like >175kg/ha N in the Wimmera (E Meier et al. CSIRO unpublished). We then use soil mineral N measurements from soil cores to work out how much mineral N the crop has and top up the balance with fertiliser. For example;
Soil mineral N measured in soil cores = 75kg/ha N
N bank target = 175kg/ha N
Fertiliser required to meet N bank target = 175 – 75 = 100kg/ha N (217kg/ha urea)
This system relies on having low leaching or denitrification losses so that any surplus N applied carries over to the next season. You need to apply less N following a low yielding year with a lot of carryover, and more N following a high yielding year with lots of crop N uptake and N offtake in grain.
Two years of results from the experiment at Curyo indicate that the N bank strategy and Yield Prophet® use similar amounts of N and are equally profitable (Figure 2), and this is confirmed by simulation studies over many seasons (E Meier et al. CSIRO unpublished).
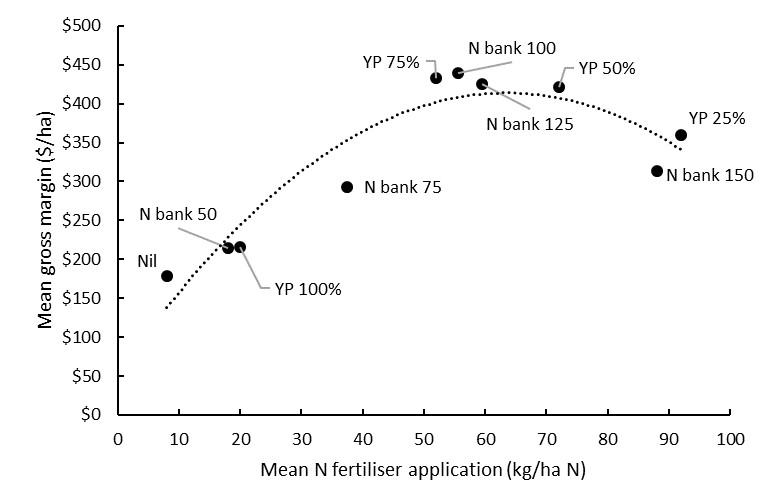
Figure 2. Mean fertiliser application and mean gross margin (2018-2019) for the BCG-La Trobe University long-term N management experiment at Curyo. Visit here for details of the experiment. Note, the number following ‘N bank’ treatments is the N bank target in kg/ha. YP=Yield Prophet treatments at different levels of probability (YP100% targets yield assuming the worst season finish on record, YP50% targets yield assuming a median finish etc.).
Conclusion
Nitrogen deficiency is the single biggest cause of the Australian wheat yield gap. Growers can easily reduce this yield gap, increase profitability and stop mining soil N by better managing fertiliser N inputs. Soil testing is essential to do this. N banks, Yield Prophet® or ‘back of the envelope’ calculations are all equally effective at reducing N limitation and increasing profit. N banks are much simpler to calculate but run a higher risk of losses and have not been validated in the field over the long-term.
Acknowledgements
This project is funded by La Trobe University through the Securing Food, Water and the Environment Research Focus Area and the Mallee Catchment Management Authority, through funding from the Australian Government’s National Landcare Program.
Useful resources
Managing N fertiliser to profitably close yield gaps
References
Angus, JF, Grace, PR (2017) Nitrogen balance in Australia and nitrogen use efficiency on Australian farms. Soil Research 55, 435-450.
Guo, S, Wu, J, Coleman, K, Zhu, H, Li, Y, Liu, W (2012) Soil organic carbon dynamics in a dryland cereal cropping system of the Loess Plateau under long-term nitrogen fertilizer applications. Plant and Soil 353, 321-332.
Hochman, Z, Gobbett, DL, Horan, H (2017) Climate trends account for stalled wheat yields in Australia since 1990. Global Change Biology 23, 2071–2081.
Hochman, Z, Horan, H (2018) Causes of wheat yield gaps and opportunities to advance the water-limited yield frontier in Australia. Field Crops Research 228, 20-30.
Contact details
Associate Professor James Hunt
Department of Animal, Plant and Soil Sciences, La Trobe University
0428 636 391
j.hunt@latrobe.edu.au
@agronomeiste